User Guide
Getting Started as a User
This section guides you through accessing and validating your Karios system.
Accessing the System - Logging In & Registration
Logging In
To access the Karios management interface, open a supported web browser (Chrome or Safari – current year release recommended). Navigate to the Karios management URL and you’ll see a login screen.
Default Administrator Account
Username:
adminPassword: Use the generated password
Note
System Password Retrieval The system generates a default password that can be retrieved directly from your node’s command line interface. For step-by-step instructions, refer to Obtaining UI Password from the CLI in the documentation appendices.
Important
Use these credentials initially to explore the application’s full capabilities, but immediately change them after your first login.
Login Process
Open Web Browser: Launch a supported web browser (Chrome or Safari current year release)
Navigate to Karios: Enter the Karios management interface URL
Enter Credentials: Input username and password in the login form
Sign In: Click the “Sign in” button to access the system
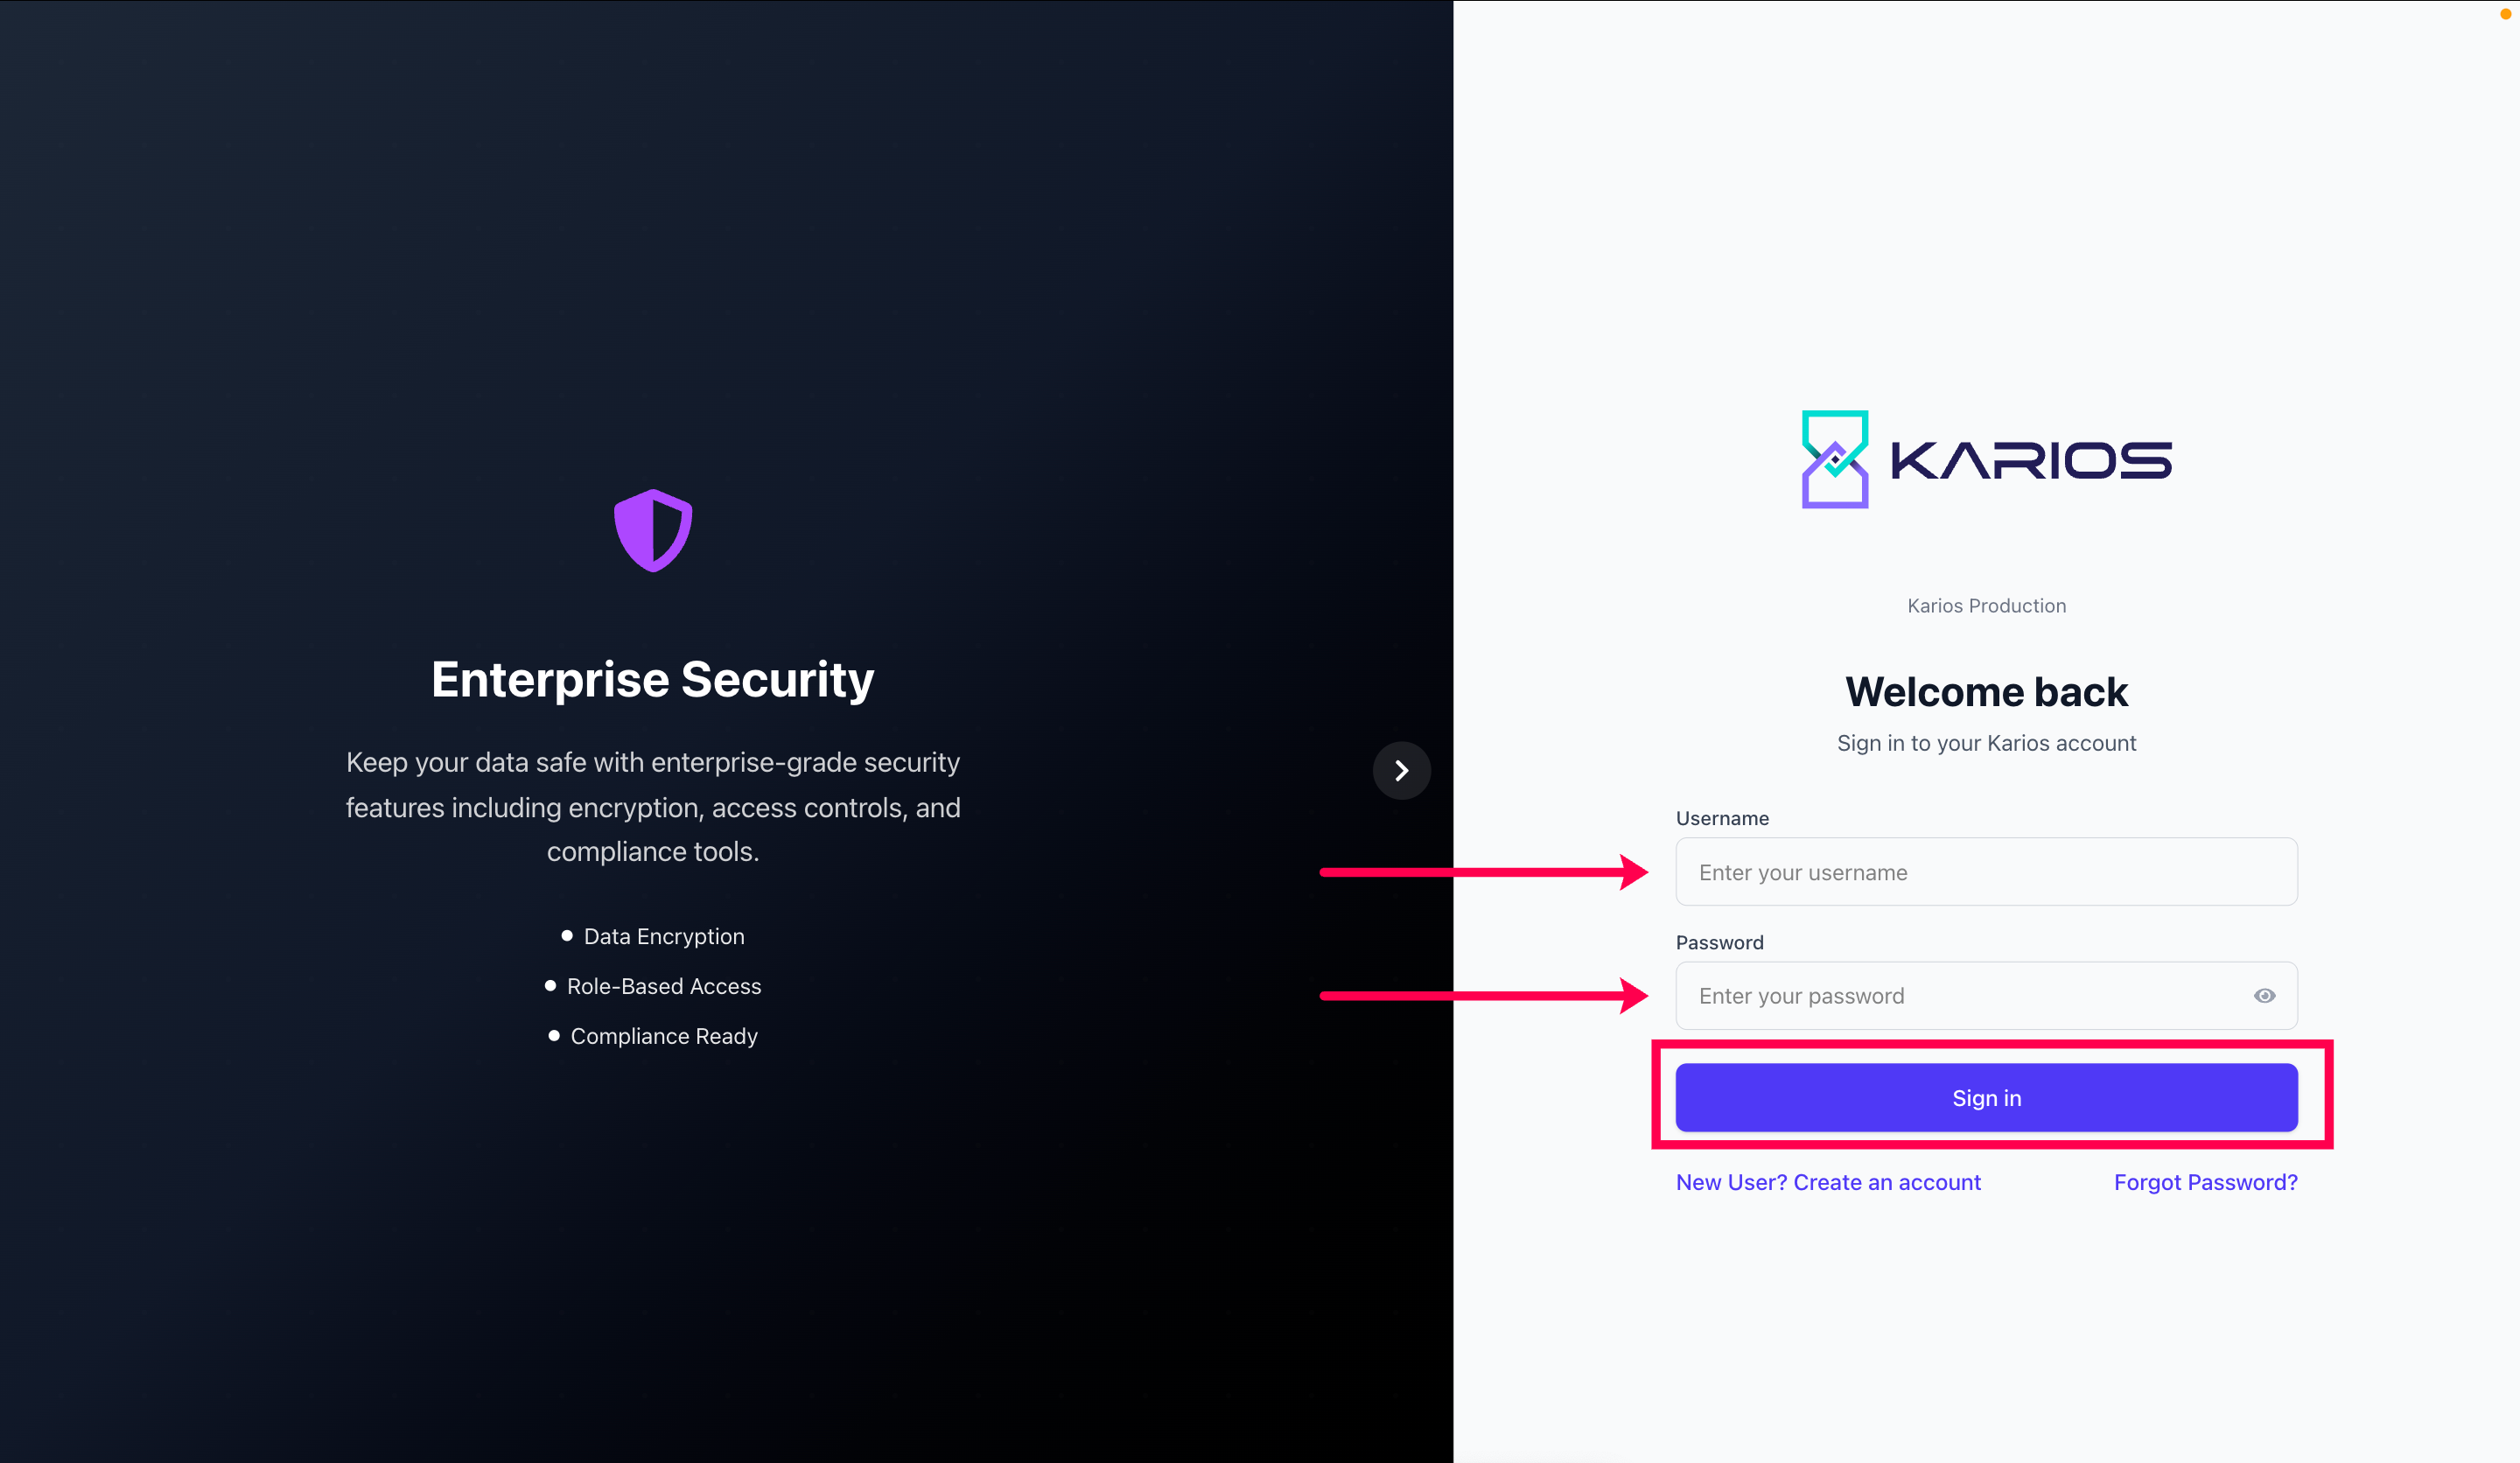
Figure : Login Process
New User Registration
Sign Up Option: Click “New User? Sign Up” link on the login page
Complete the registration form with required details:
Username: A unique username for system identification
Email Address: A valid email address (used for account verification)
First Name: Your first name
Last Name: Your last name
Password: A strong, secure password that meets the system requirements
Confirm Password: Re-enter your password to verify it
Account Creation: Click “Sign Up” to create the new user account
Note
New users are not granted any access by default. Contact a system administrator for permission upgrades if needed. Detailed instructions on how to provide access are available in the Getting Full Access section of the documentation.
Access Level Considerations
Read-Only Access: New registered users have limited permissions
Administrative Access: Full system capabilities require administrative privileges
Permission Management: Contact system administrators for permission upgrades (Refer User Management & Permissions section)
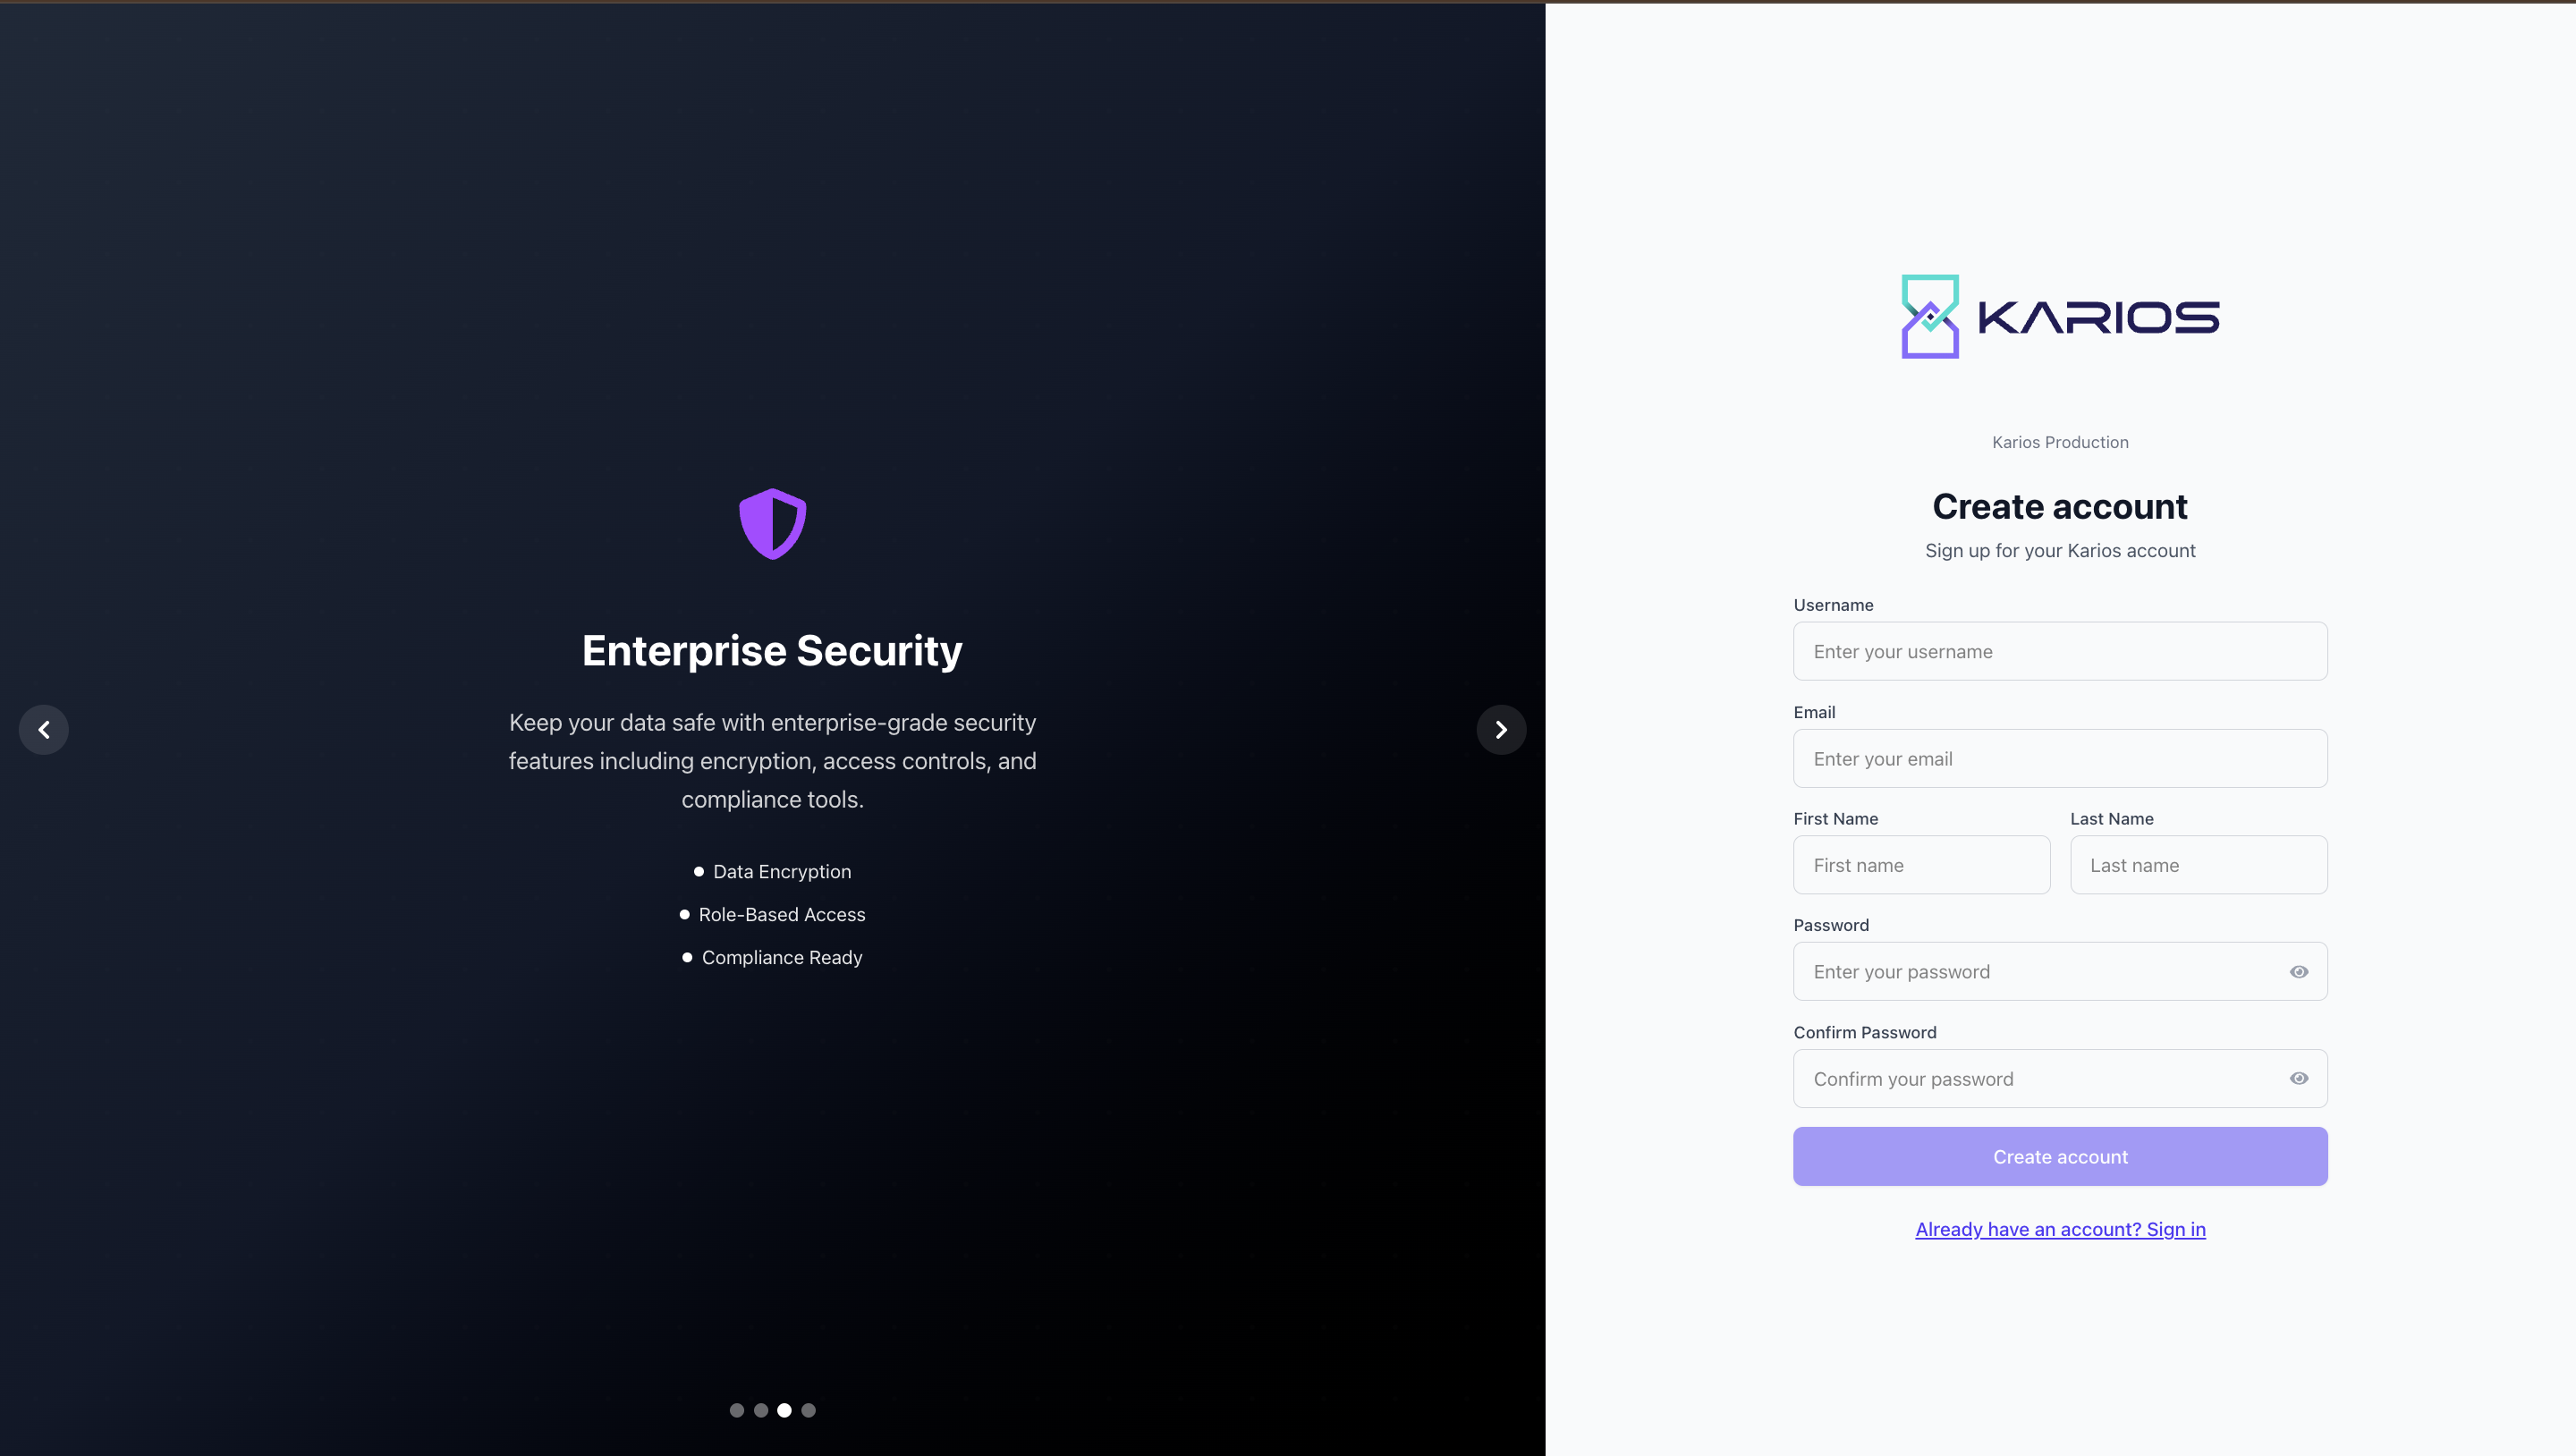
Figure : New User Registration
Account Management
To return to the login page, click “Existing User? Login.”
2FA Setup Requirements
Before proceeding, ensure you have:
A smartphone or tablet with internet access
One of the following authenticator apps installed:
Google Authenticator (iOS/Android)
Microsoft Authenticator (iOS/Android)
Authy (iOS/Android/Desktop)
1Password (with TOTP support)
Bitwarden (with authenticator feature)
Tip
Authenticator apps generate time-based one-time passwords (TOTP) that change every 30 seconds, providing secure access even if your password is compromised.
Setting Up 2FA
2FA Registration Prompt
After successful admin login, you’ll see the “Set up Two-Factor Authentication” screen
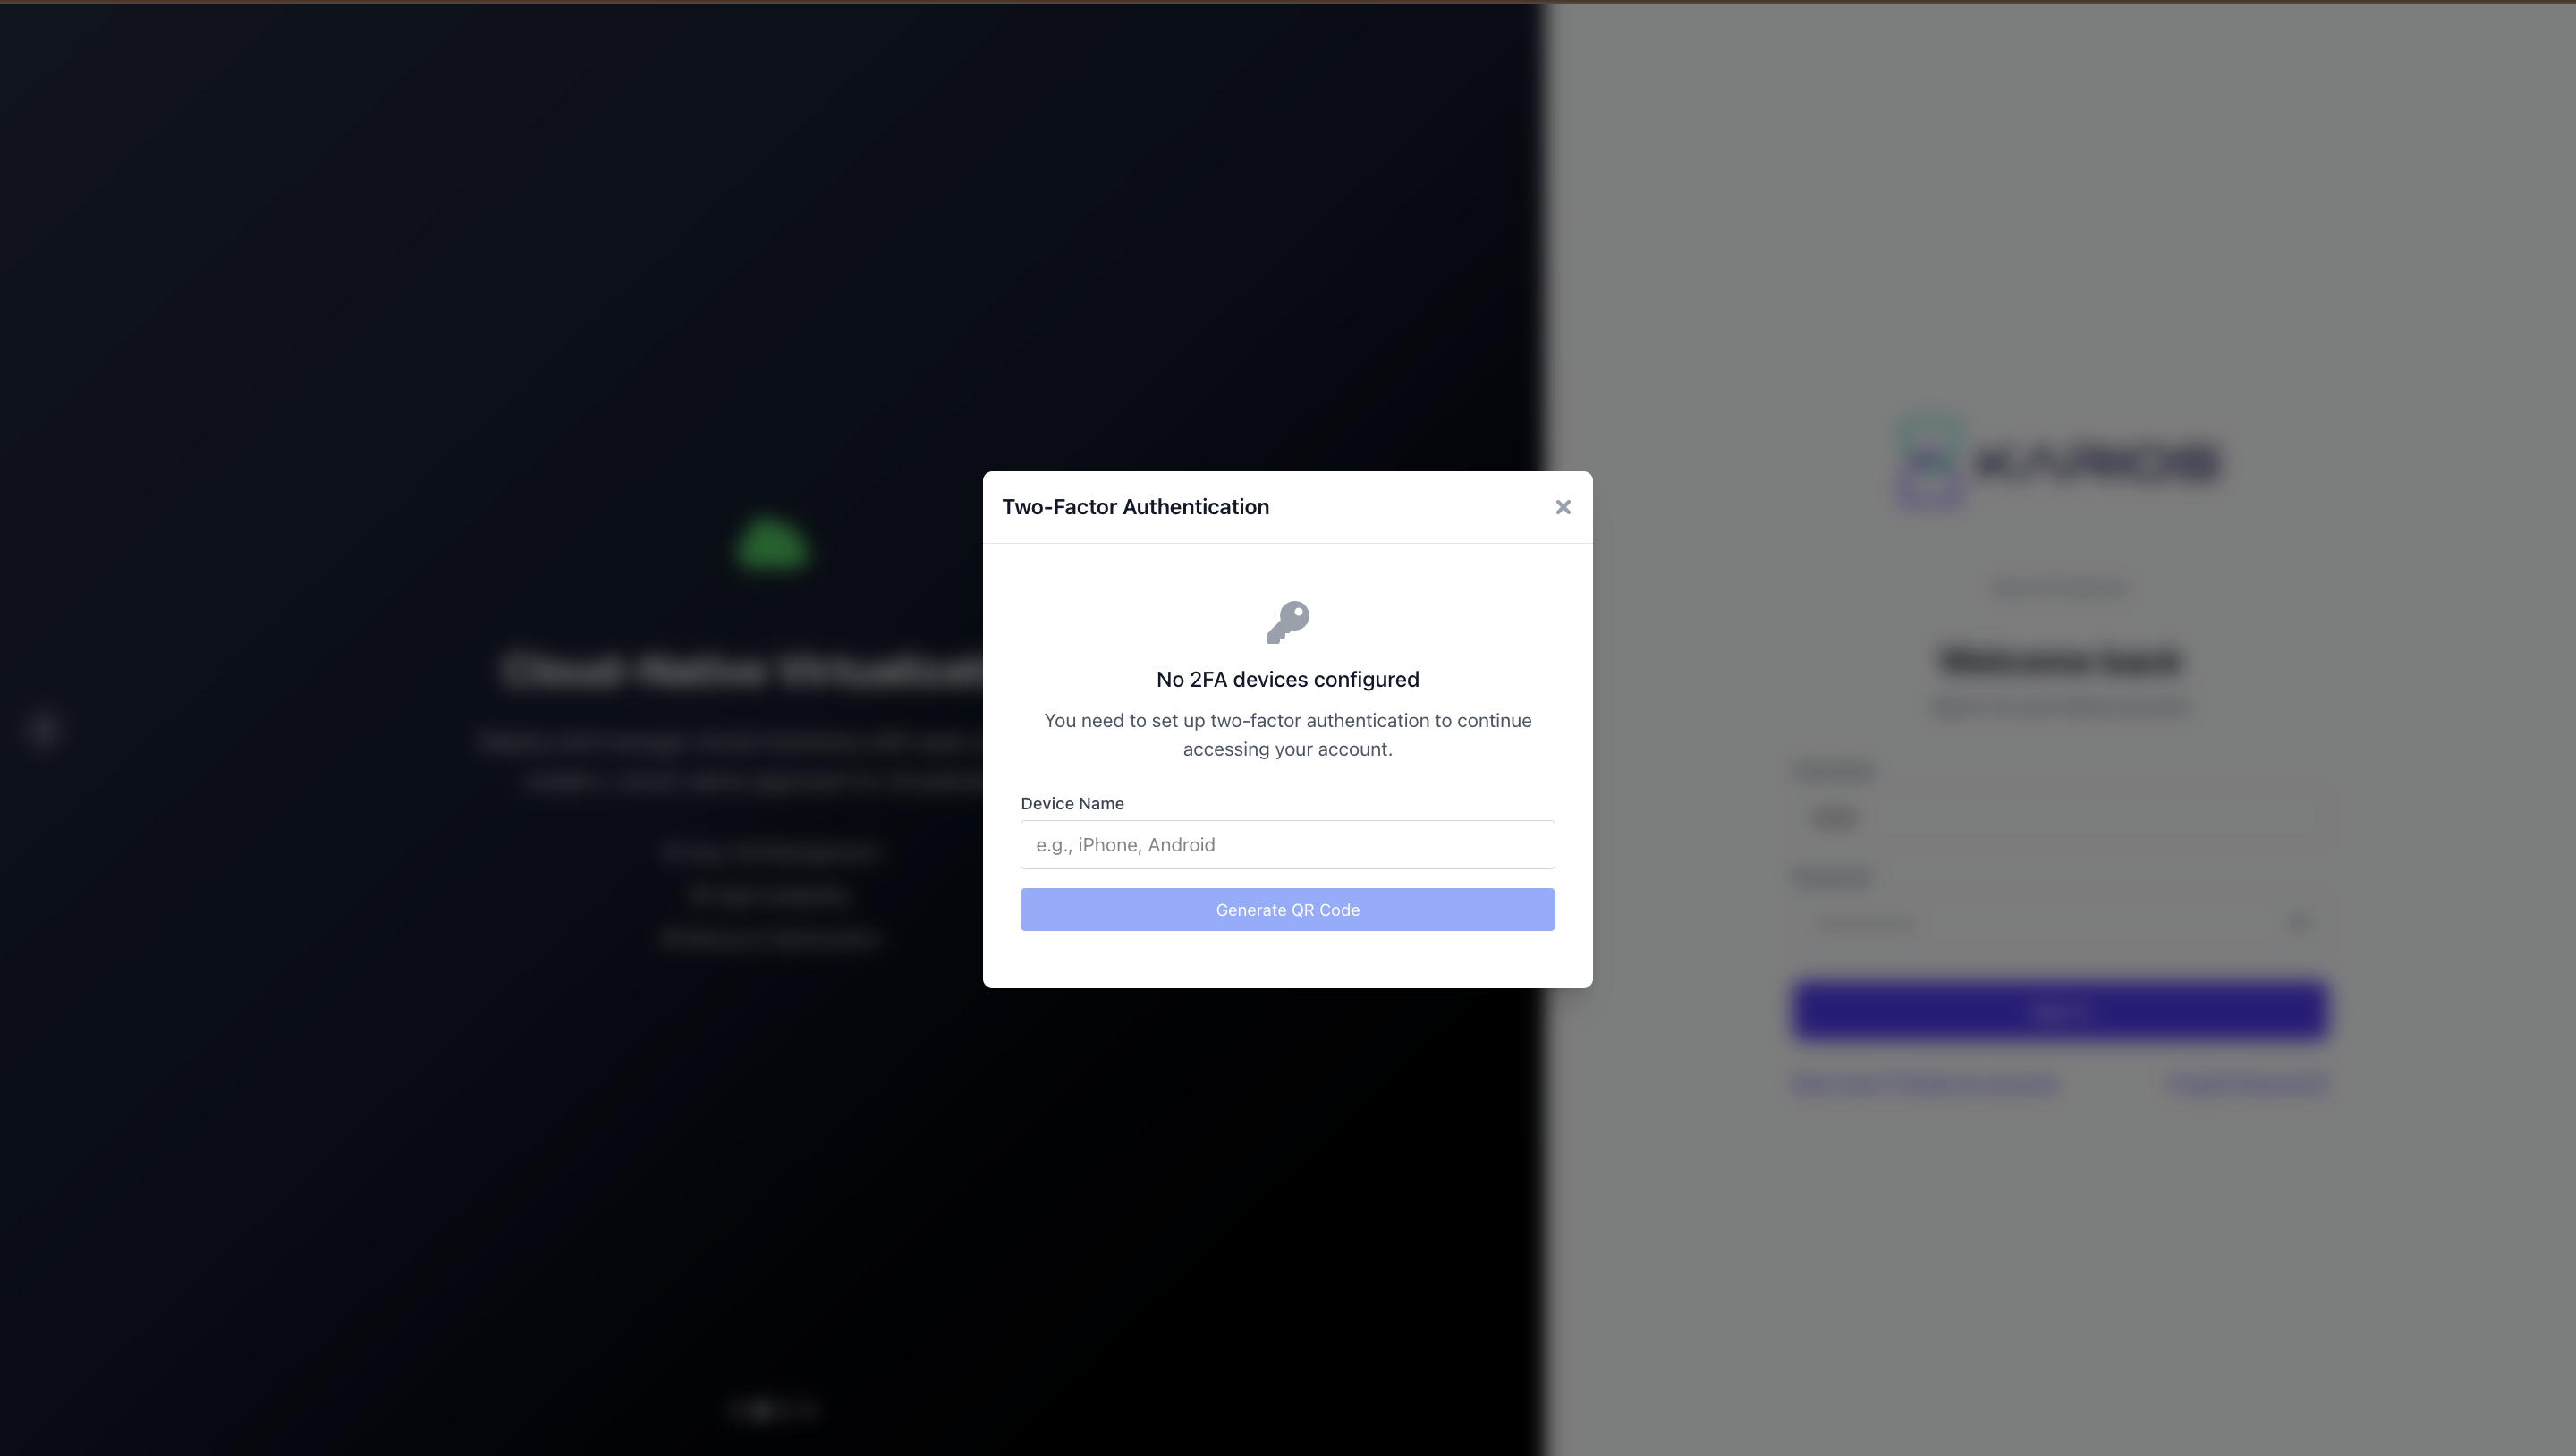
Figure : 2FA Registration Prompt
The system displays: “You need to setup two-factor authentication to continue accessing your account.”
QR Code Display
A unique QR code will be presented on the screen
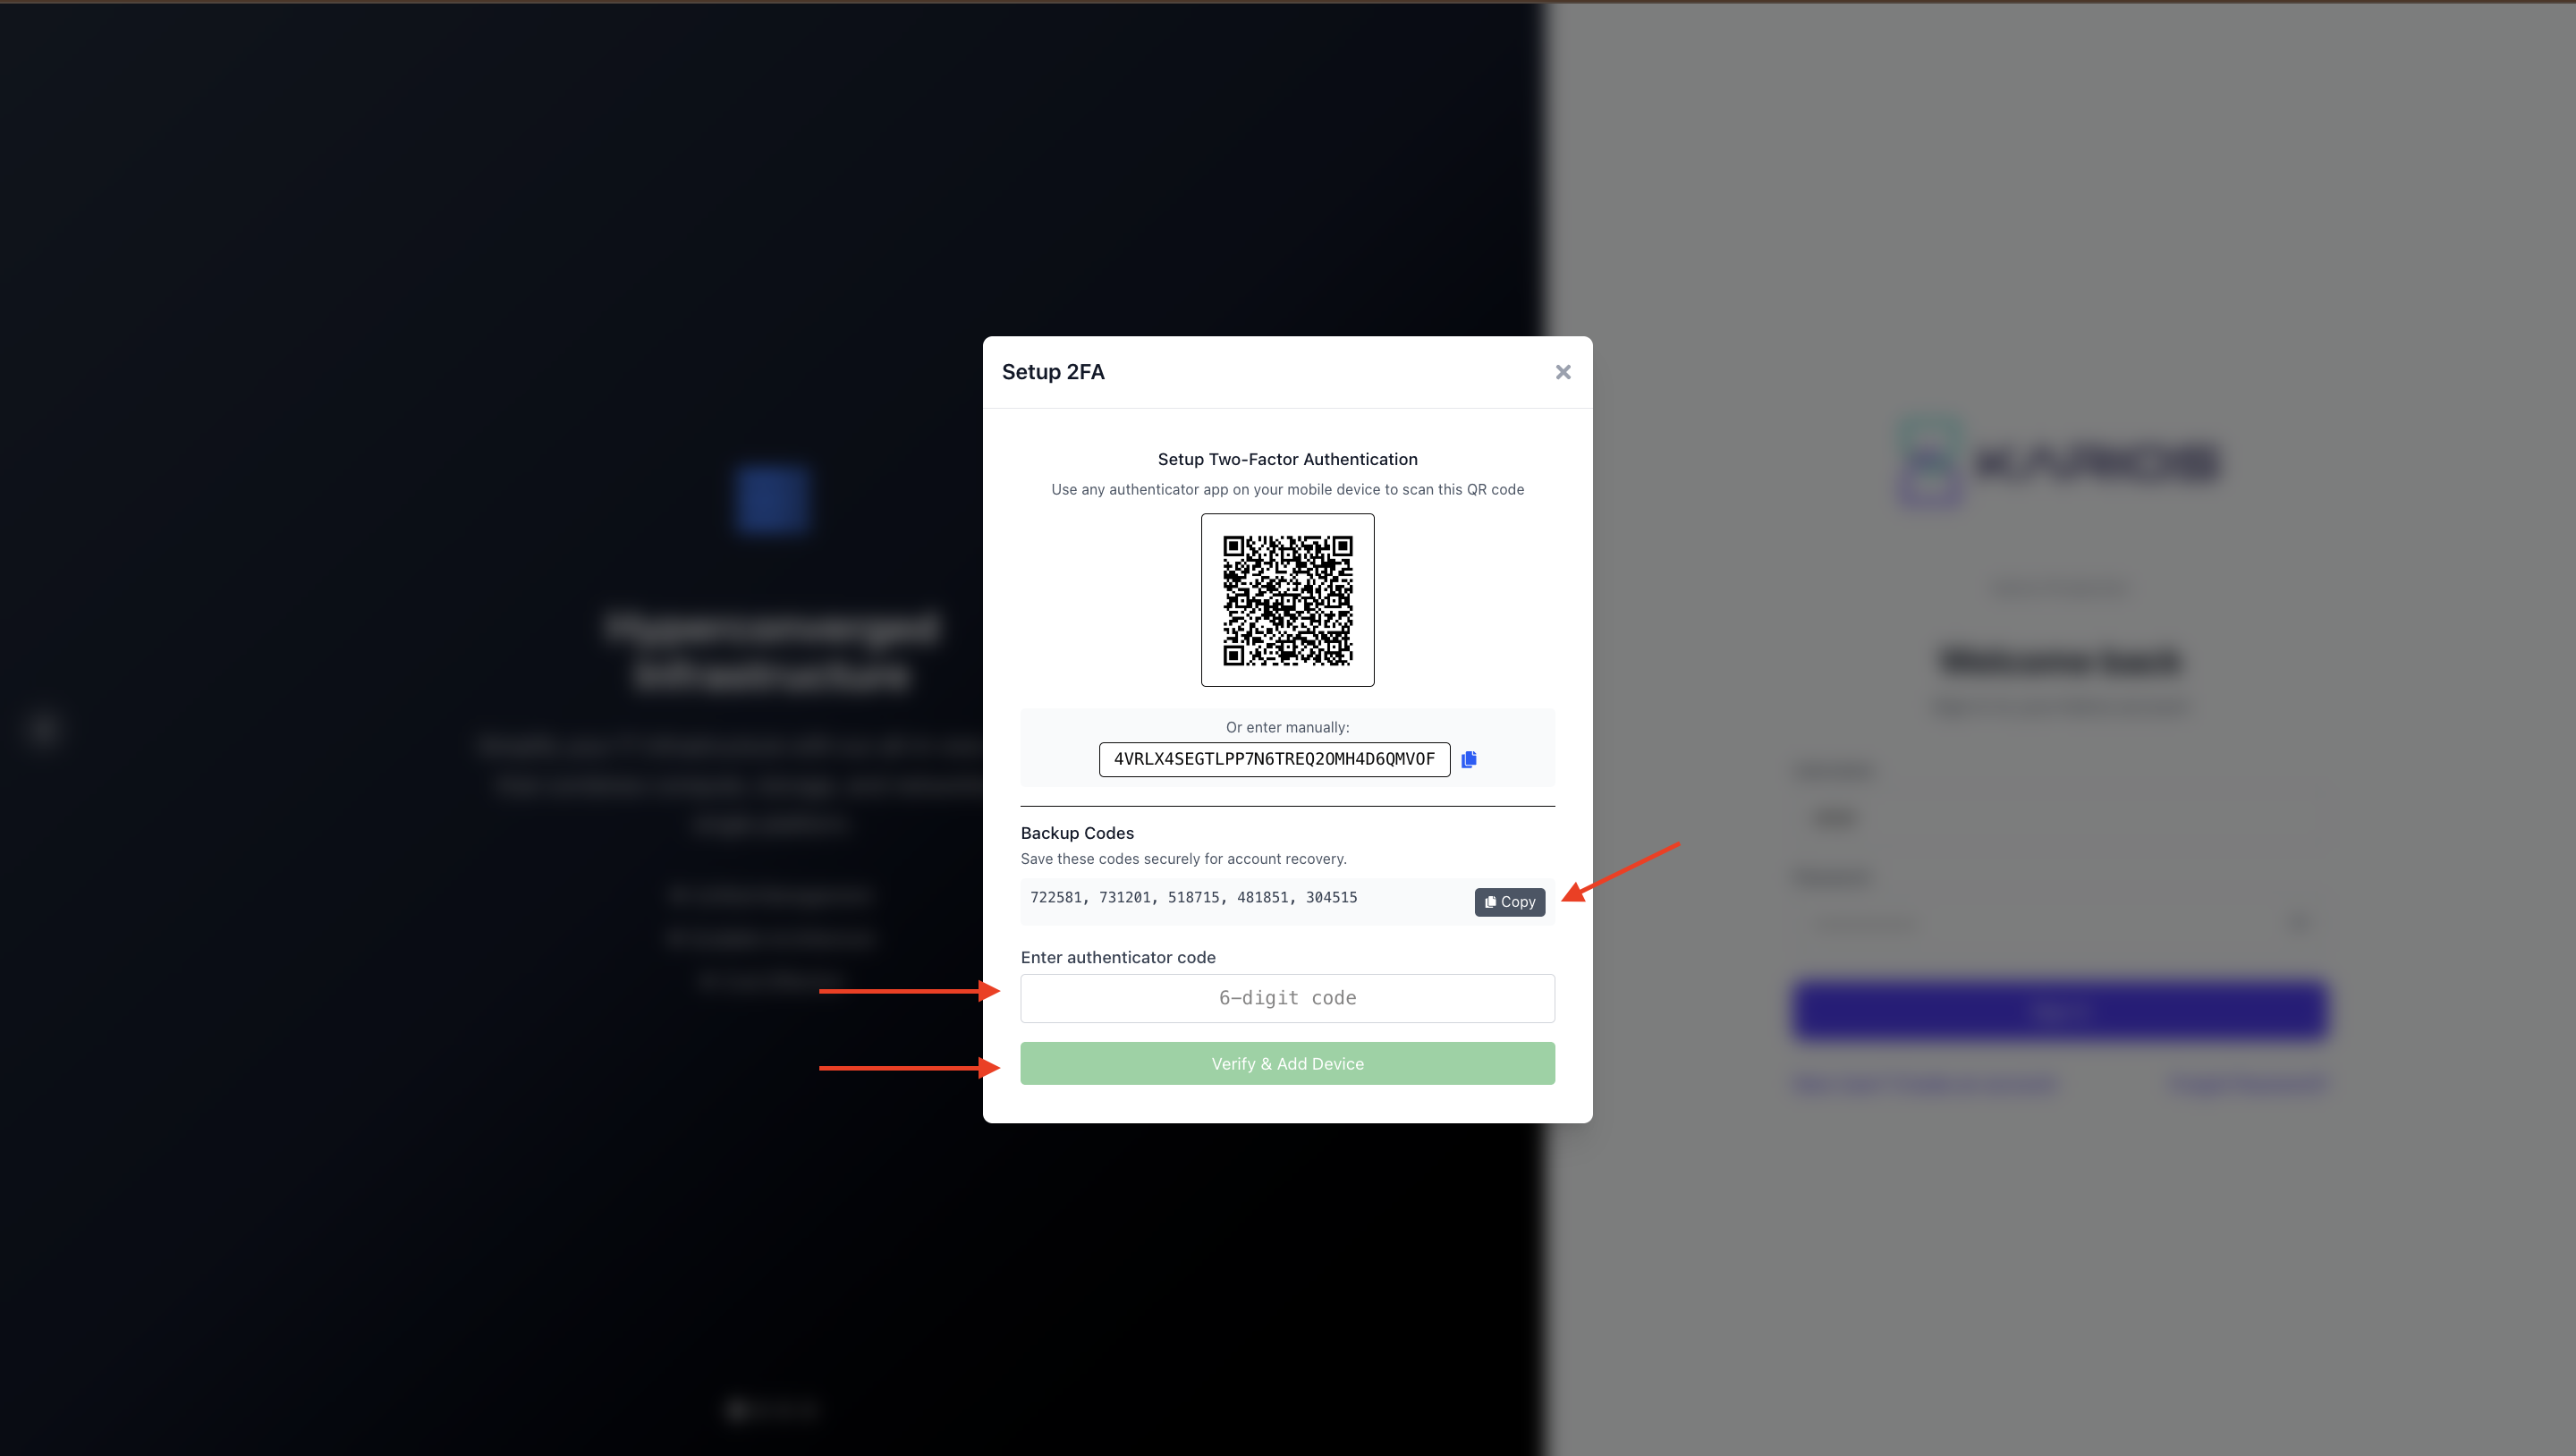
Figure : 2FA QR Code
This QR code contains your account’s secret key for generating time-based codes
Warning
This QR code is unique to your account and should not be shared with anyone or stored in unsecured locations.
Configure Your Authenticator App
Open your chosen authenticator app on your mobile device
Tap “Add Account” or the “+” button
Select “Scan QR Code” or “Scan Barcode”
Point your device’s camera at the QR code displayed on screen
Your authenticator app will automatically configure the account
Manual Entry Option (if QR scanning fails)
Select “Enter Code Manually” in your authenticator app
Enter the following information:
Account Name: Your admin username
Secret Key: The alphanumeric code displayed below the QR code
Time-based: Ensure this option is selected (30-second intervals)
Note
Manual entry is useful when camera scanning isn’t available or when setting up 2FA on multiple devices.
Verify 2FA Setup
Your authenticator app will immediately start generating 6-digit codes
Enter the current 6-digit code from your app into the “Verification Code” field
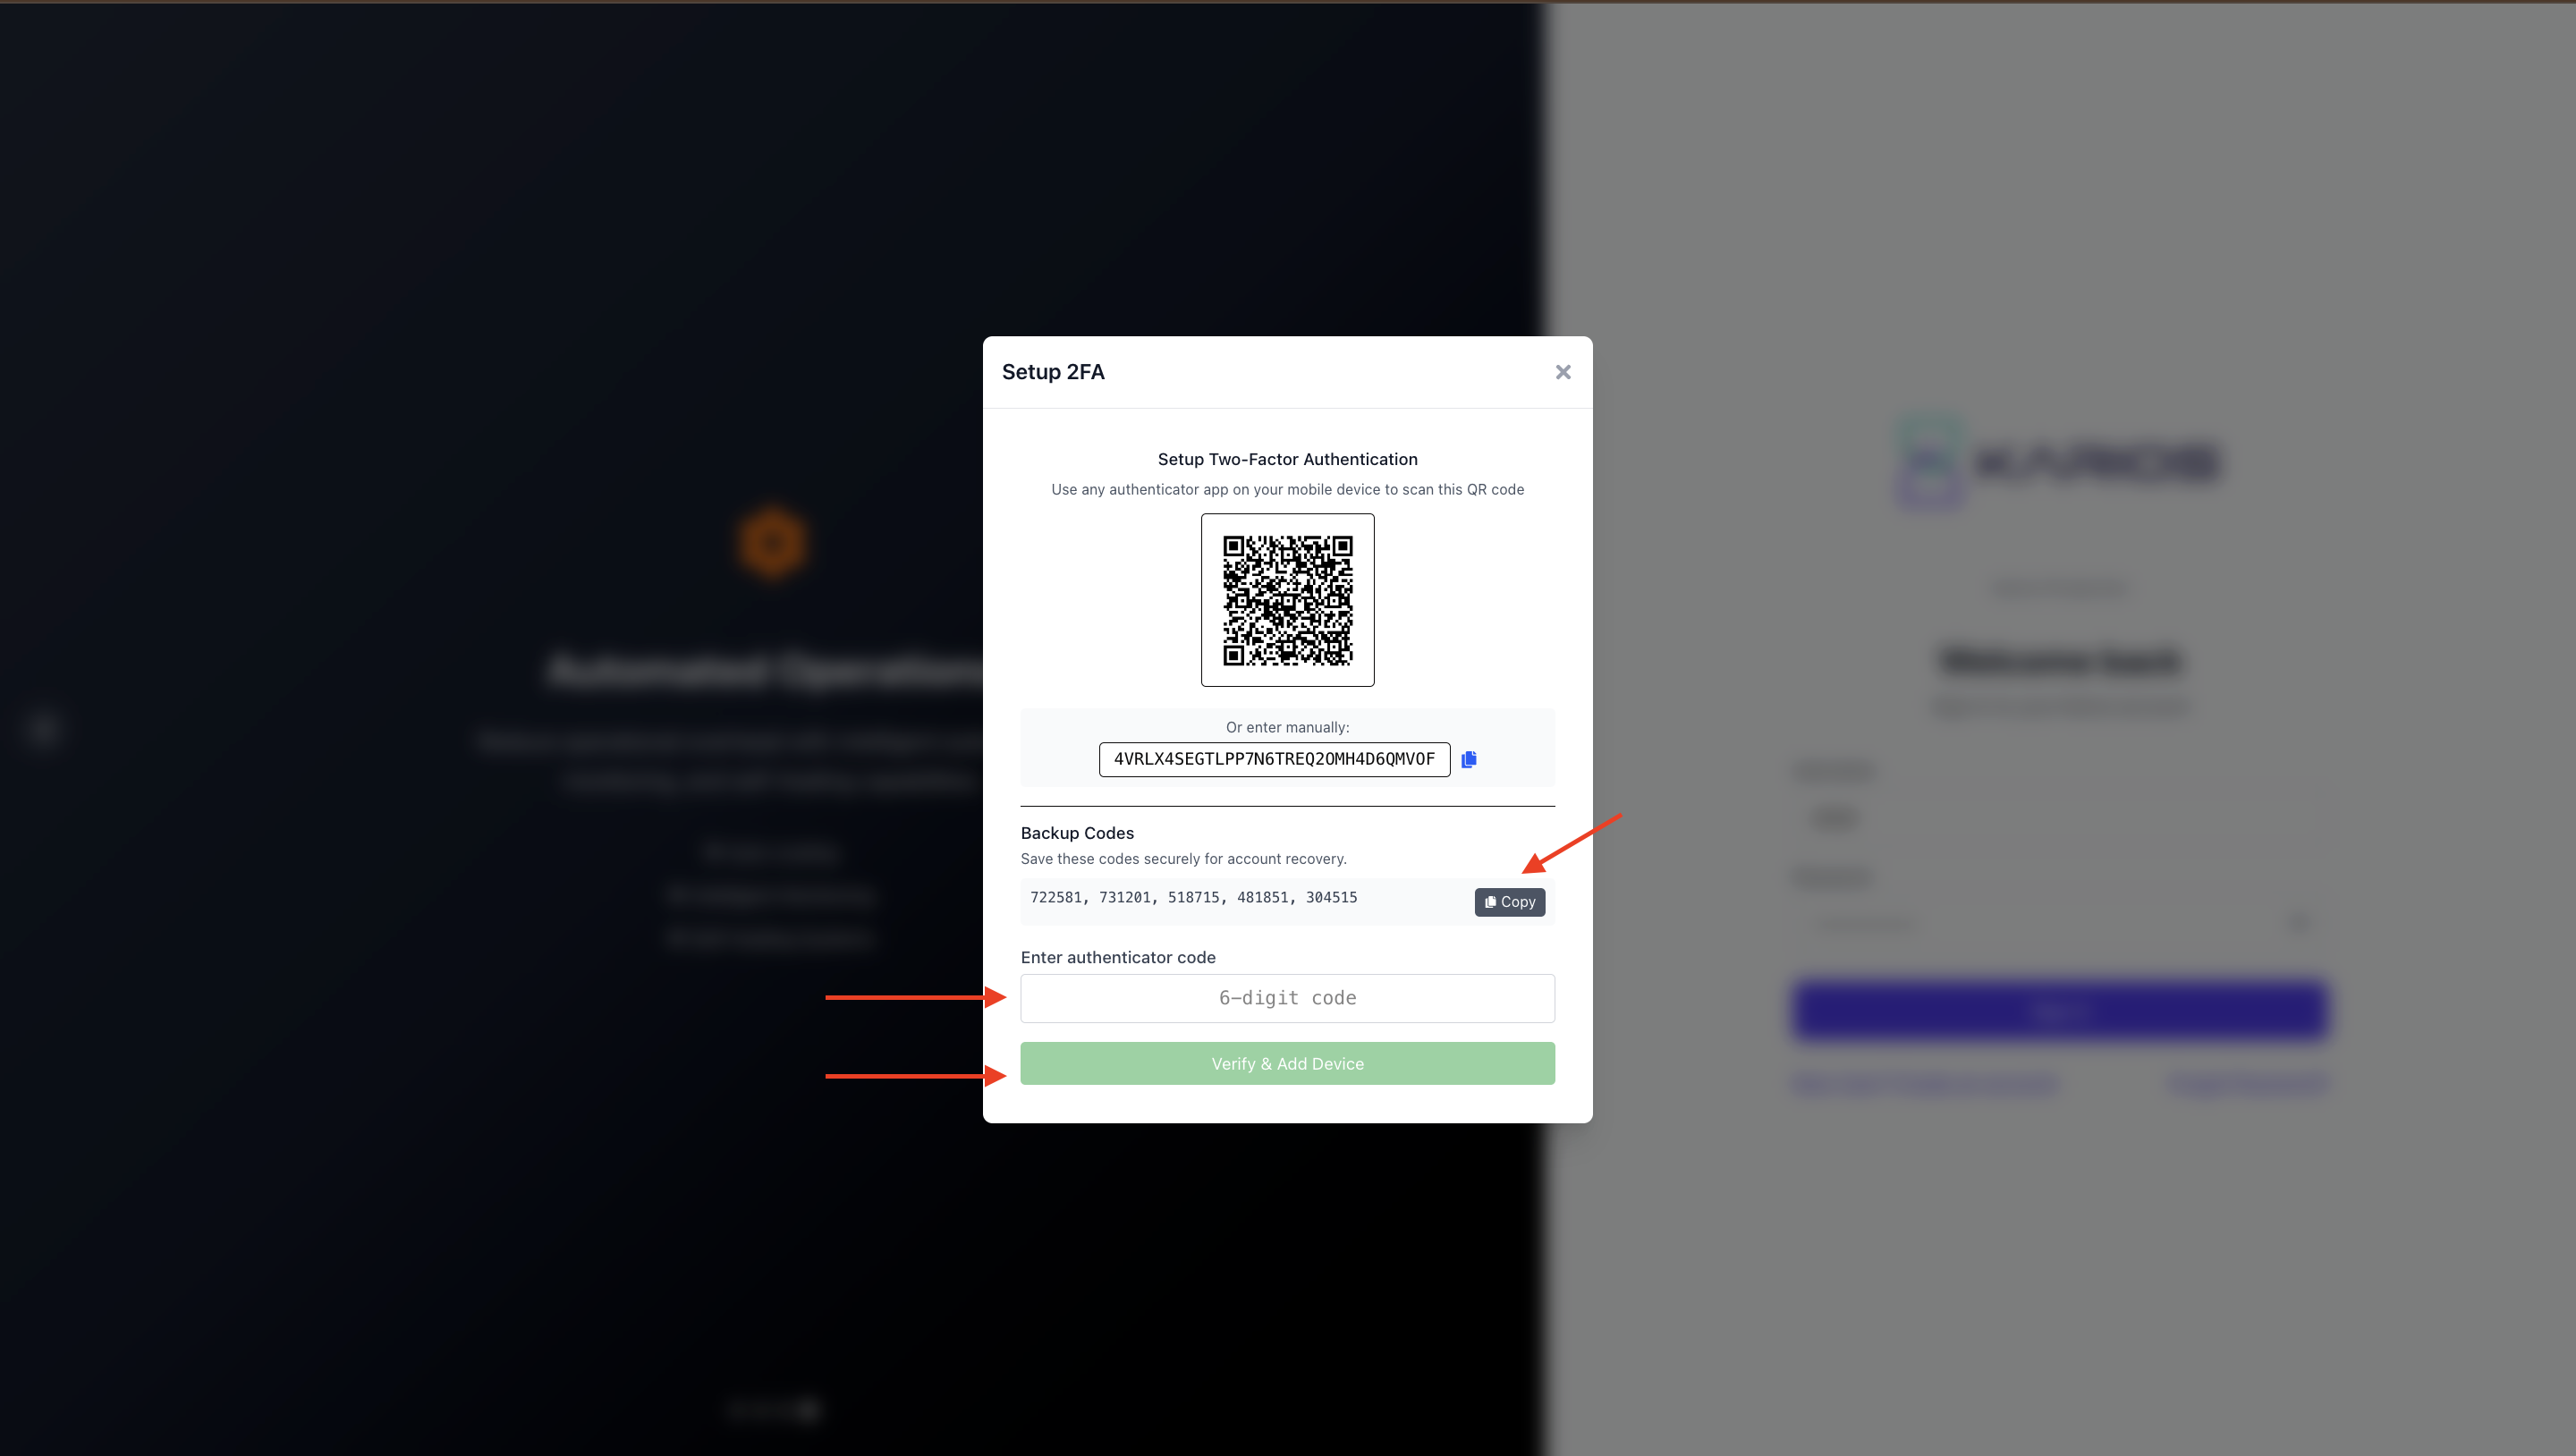
Figure : 2FA Enter Code
Click “Verify and Enable 2FA”
Tip
If the first code doesn’t work, wait for the next 30-second cycle and try the new code. Clock synchronization between your device and the server is important for successful verification.
Backup Codes Generation
Upon successful verification, the system generates backup recovery codes
Download or print the backup codes and store them in a secure location
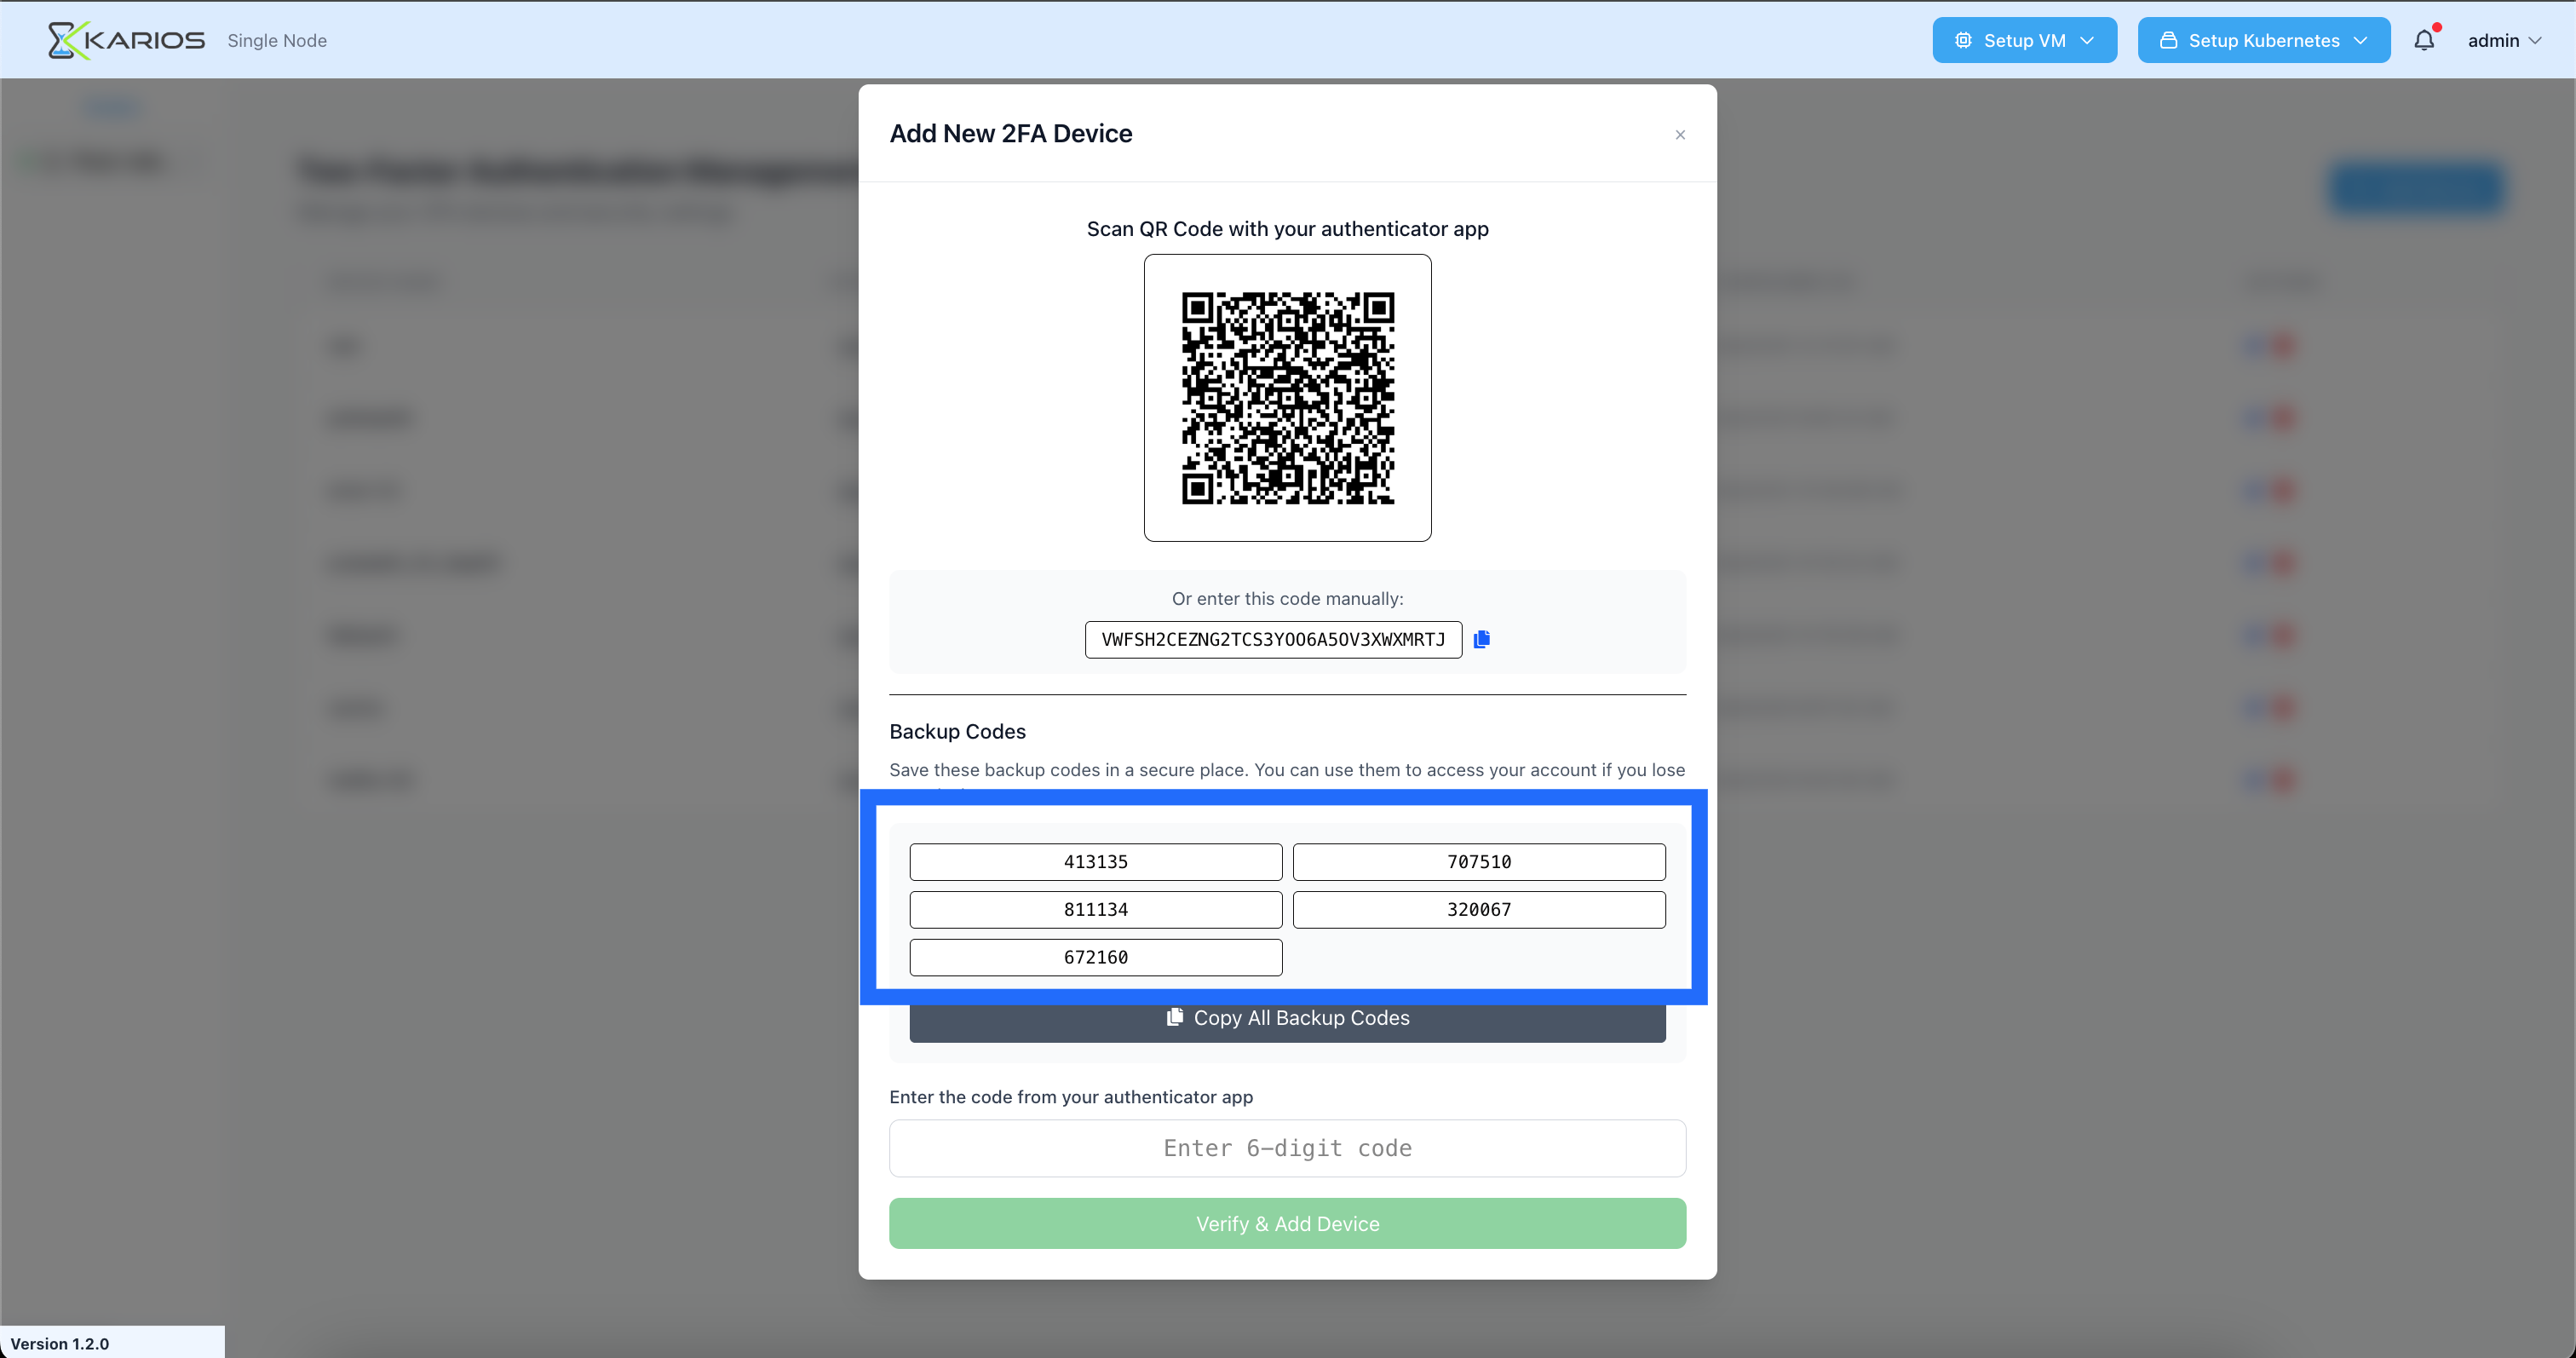
Figure : 2FA Backup Codes
Important
Save these backup codes securely - they allow account recovery if you lose your device. Each backup code can only be used once, so treat them like passwords and store them safely.
Account Recovery:
If you forget your password, use the “Forgot Password?” link to initiate the recovery process.
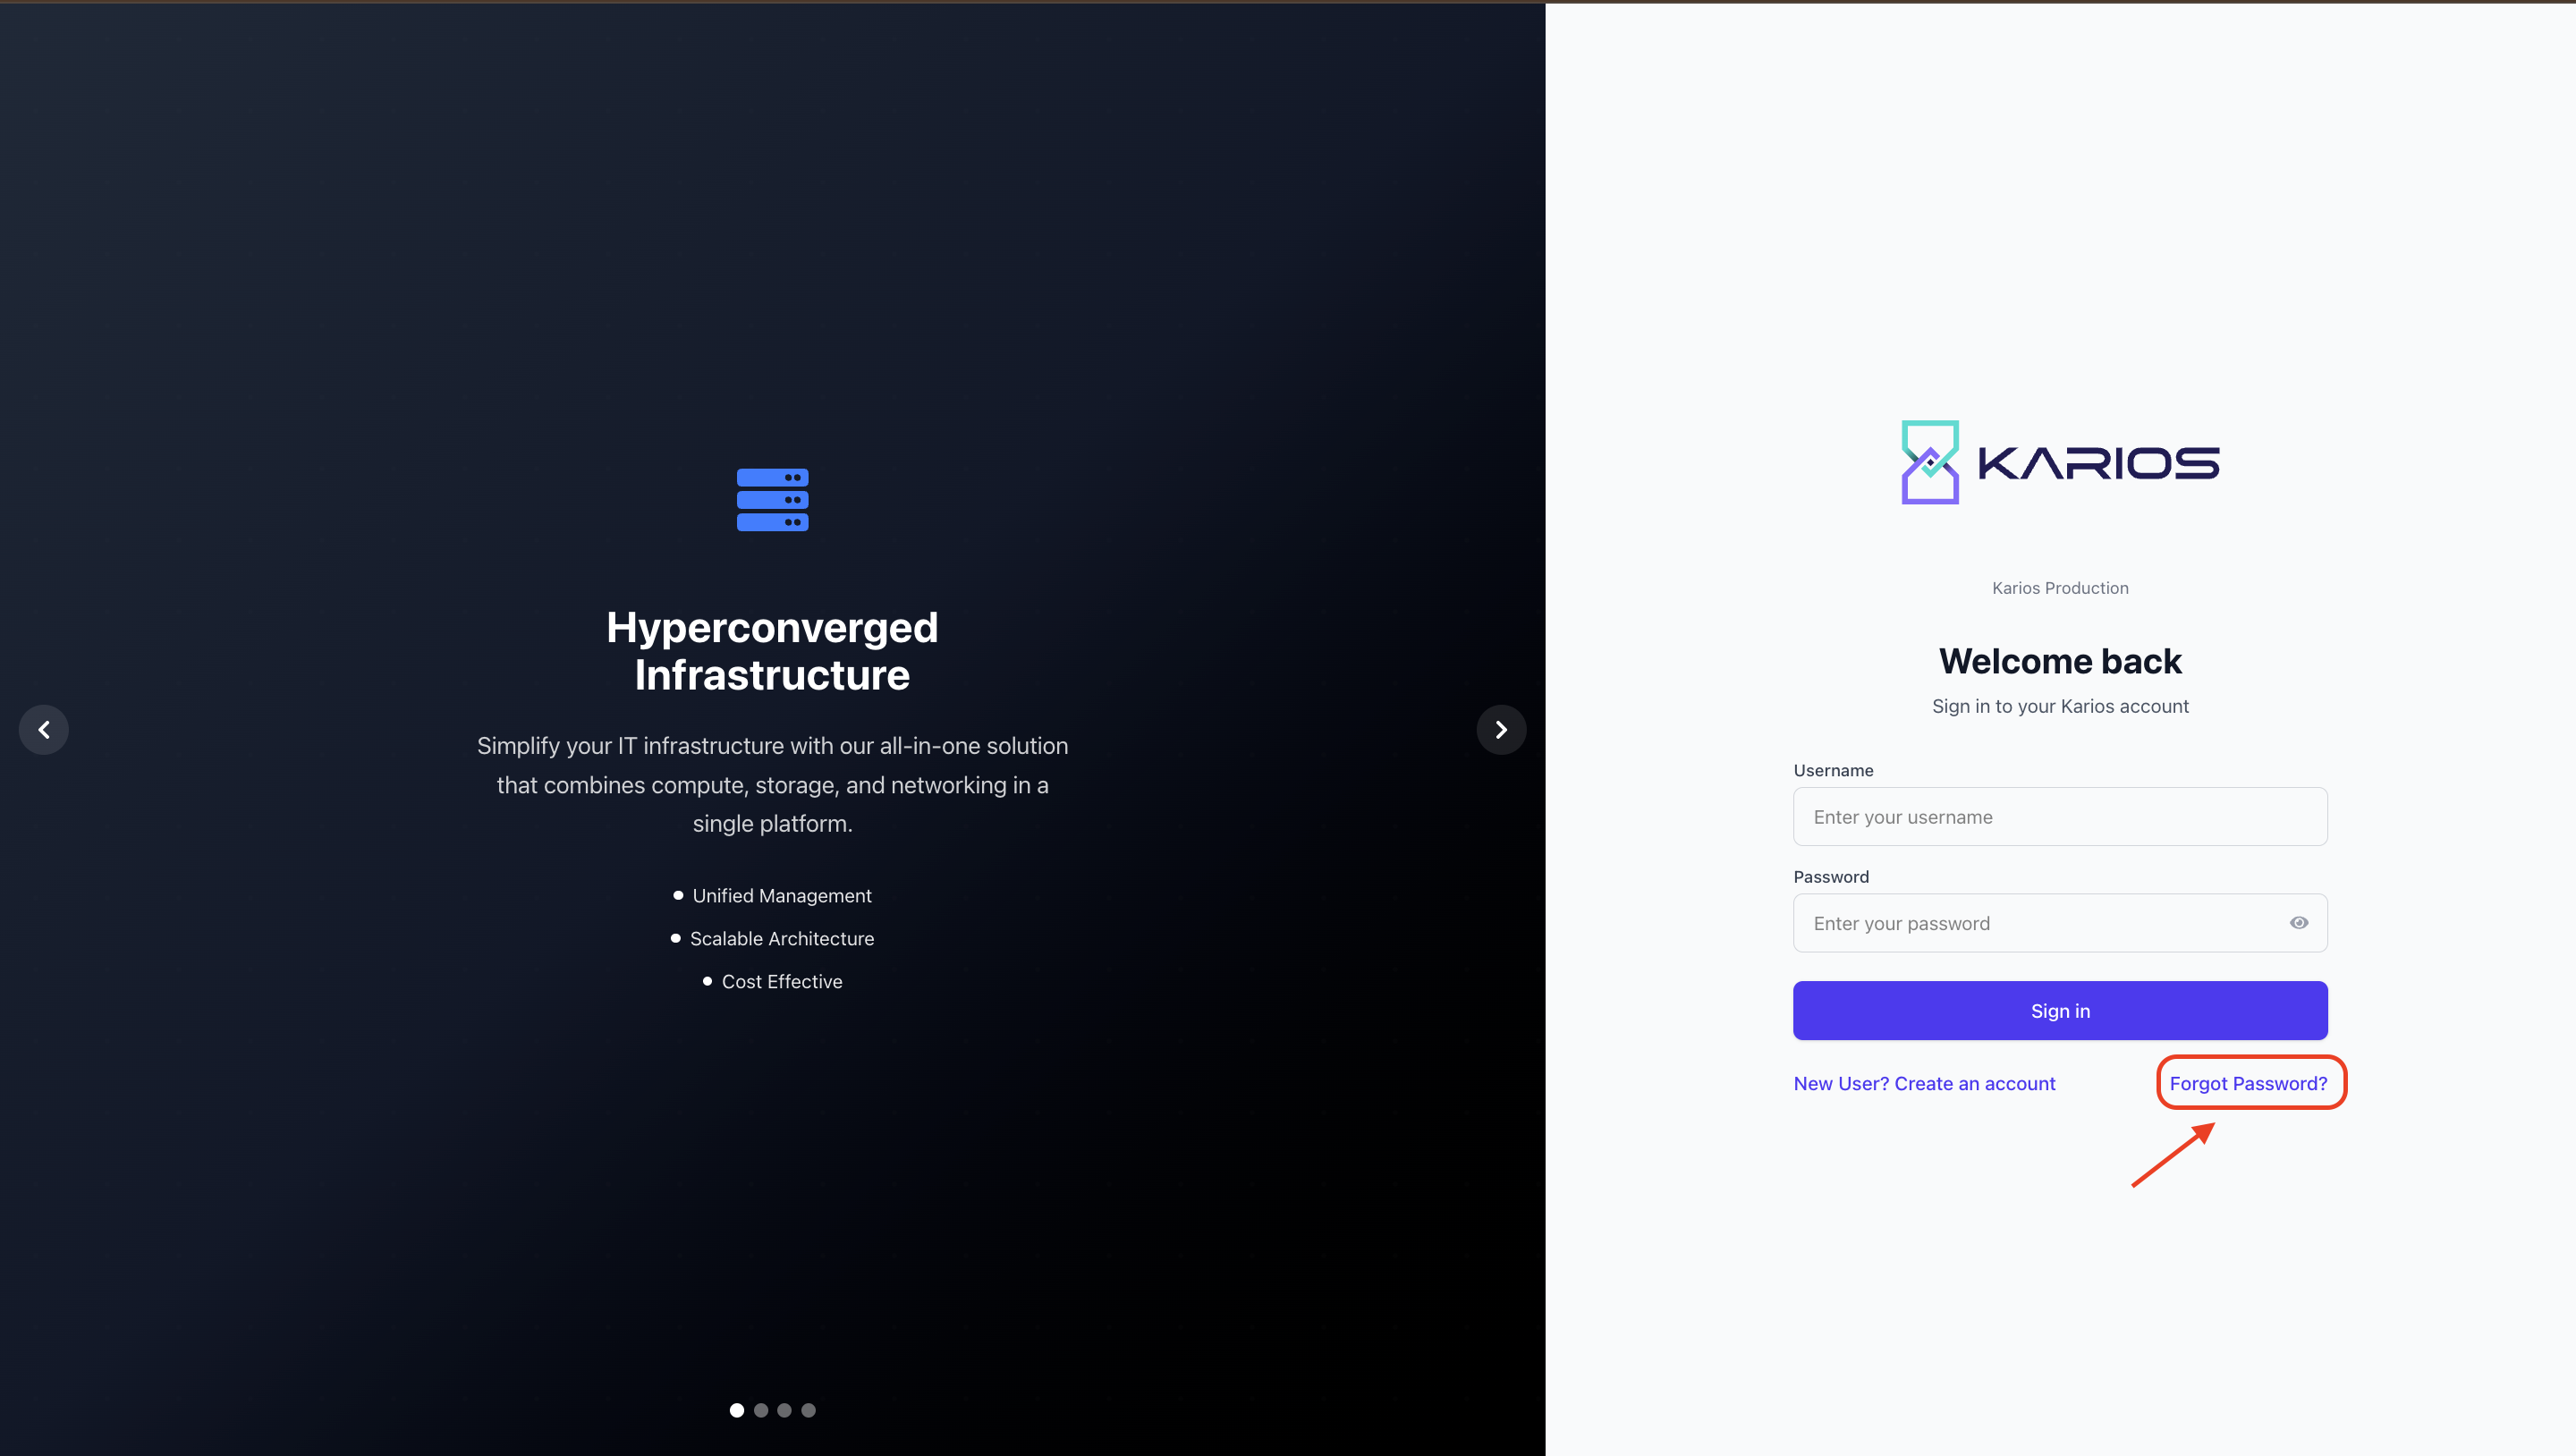
Figure : Forgot Password
Give your username to initiate a reset password request.
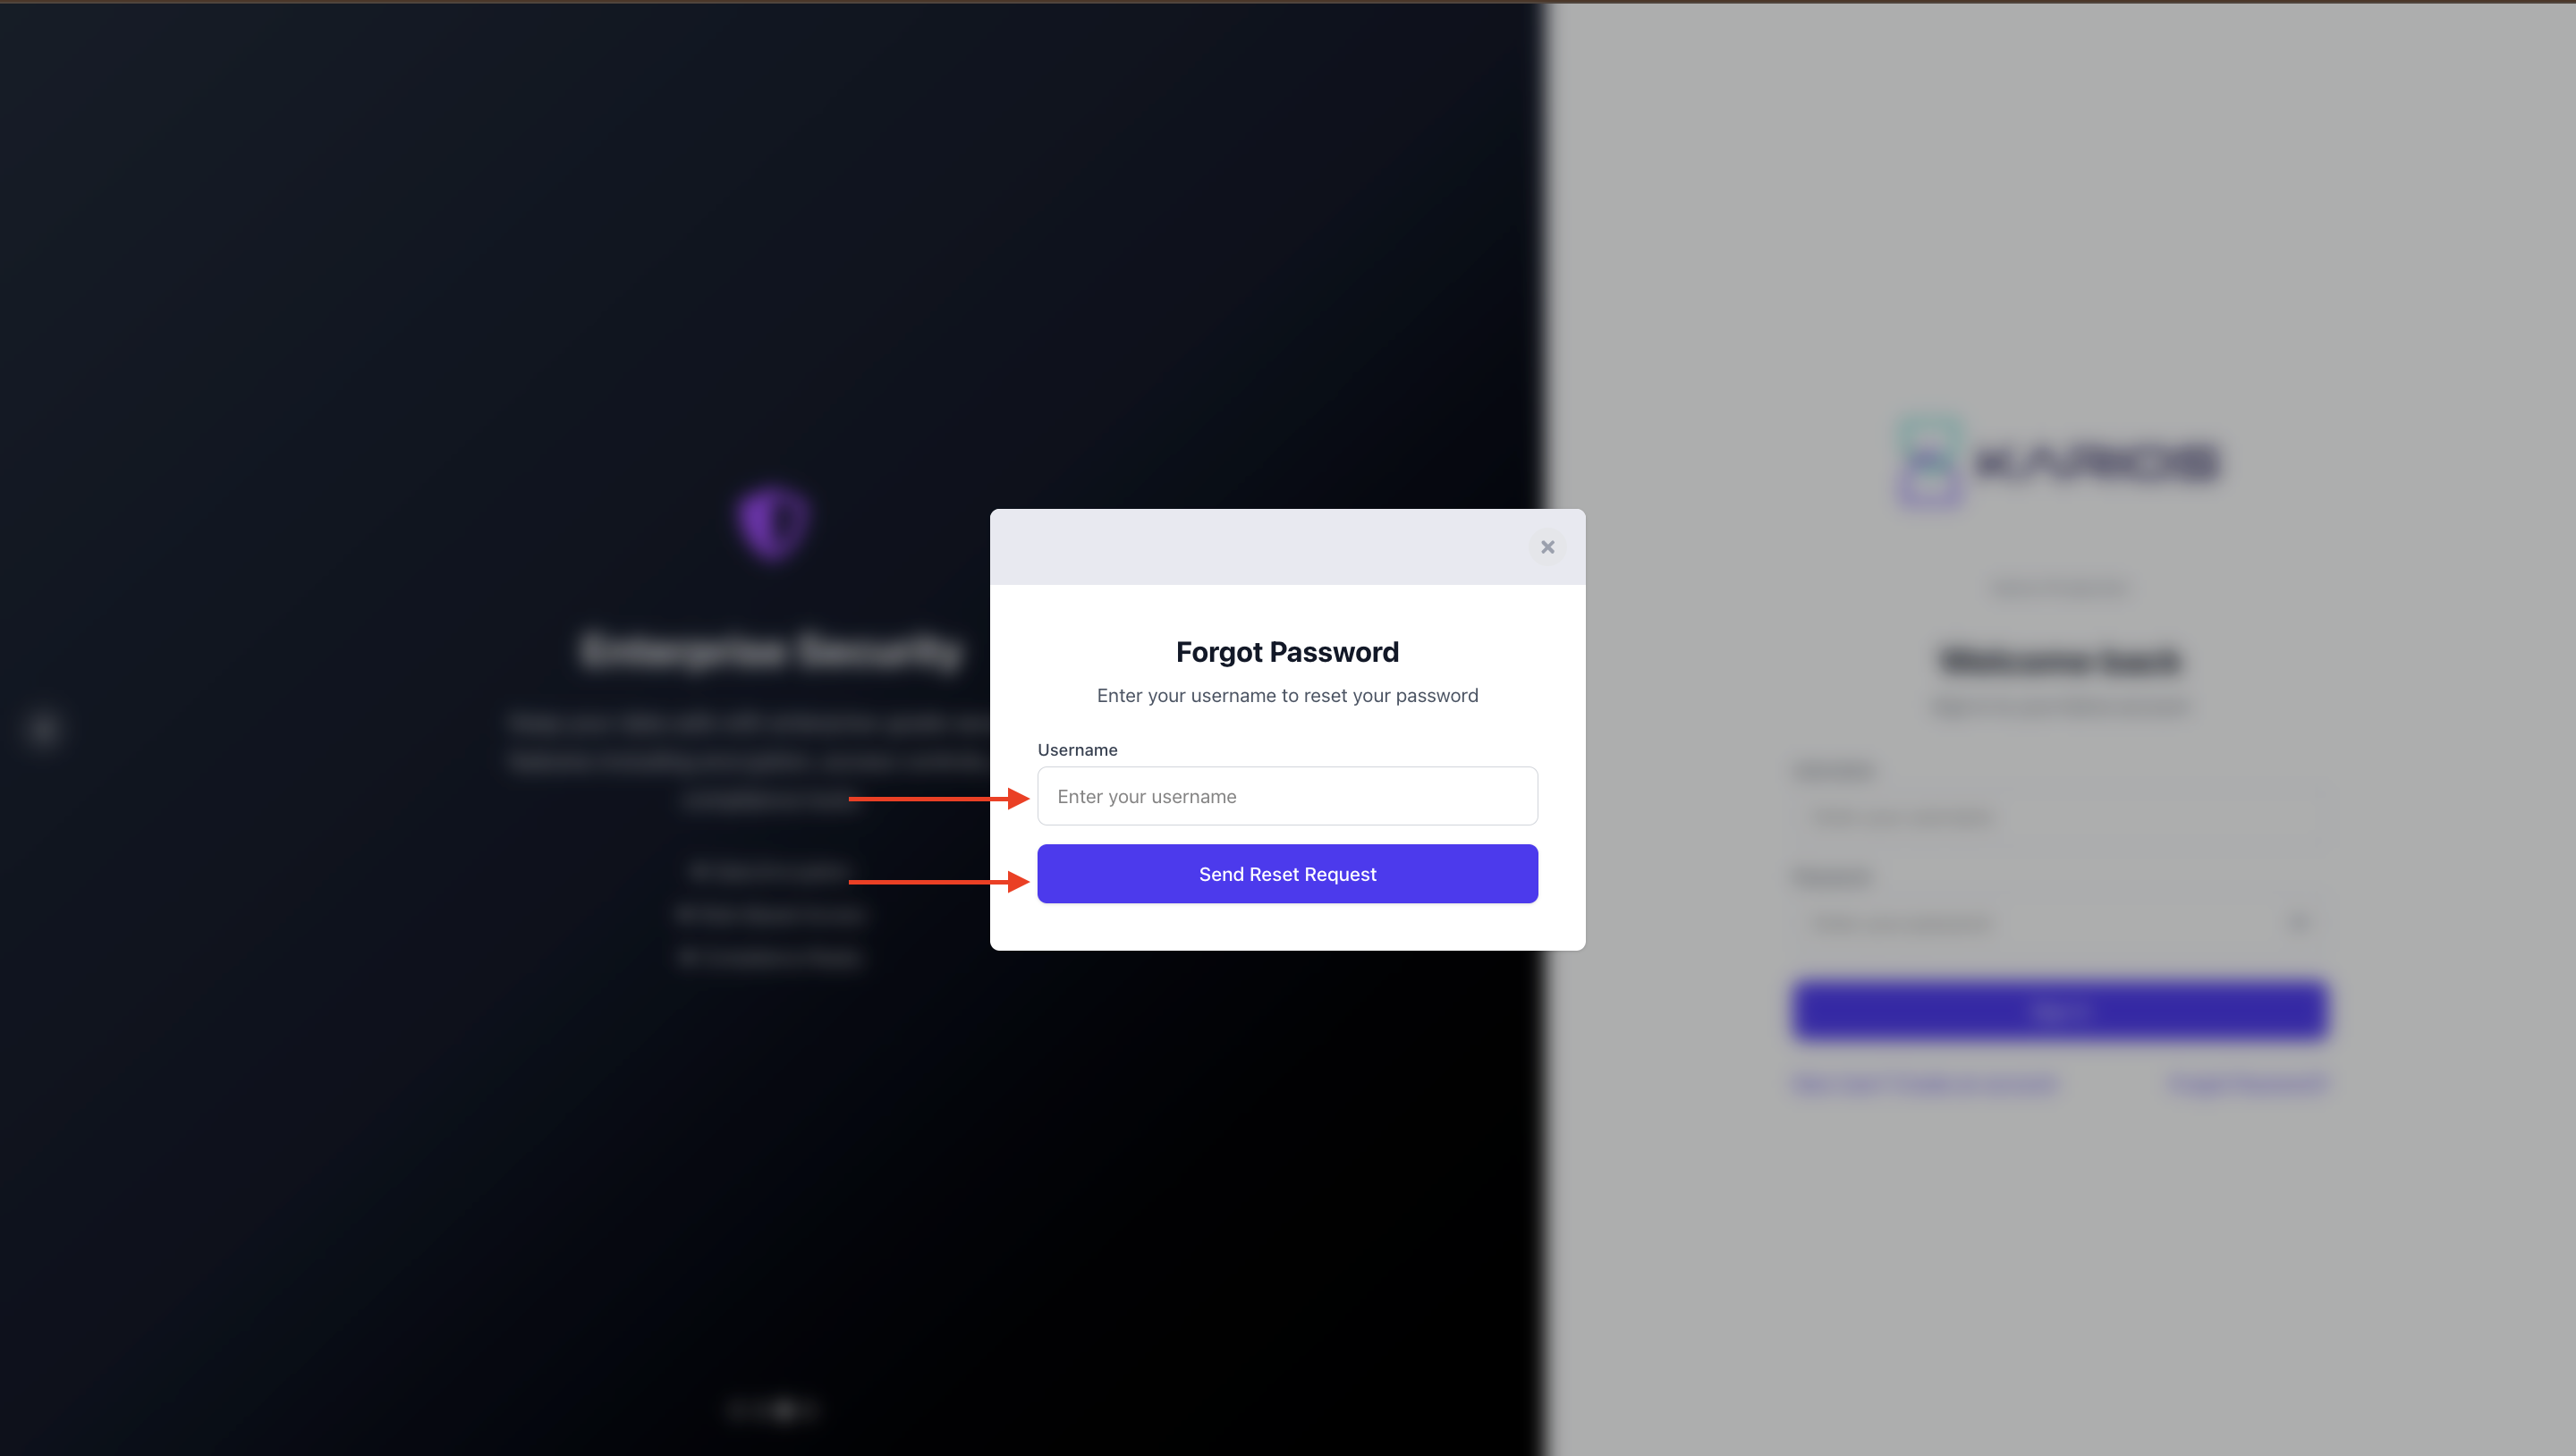
Figure : Forgot Password Enter Username
If a device is configured , please choose one from the list.
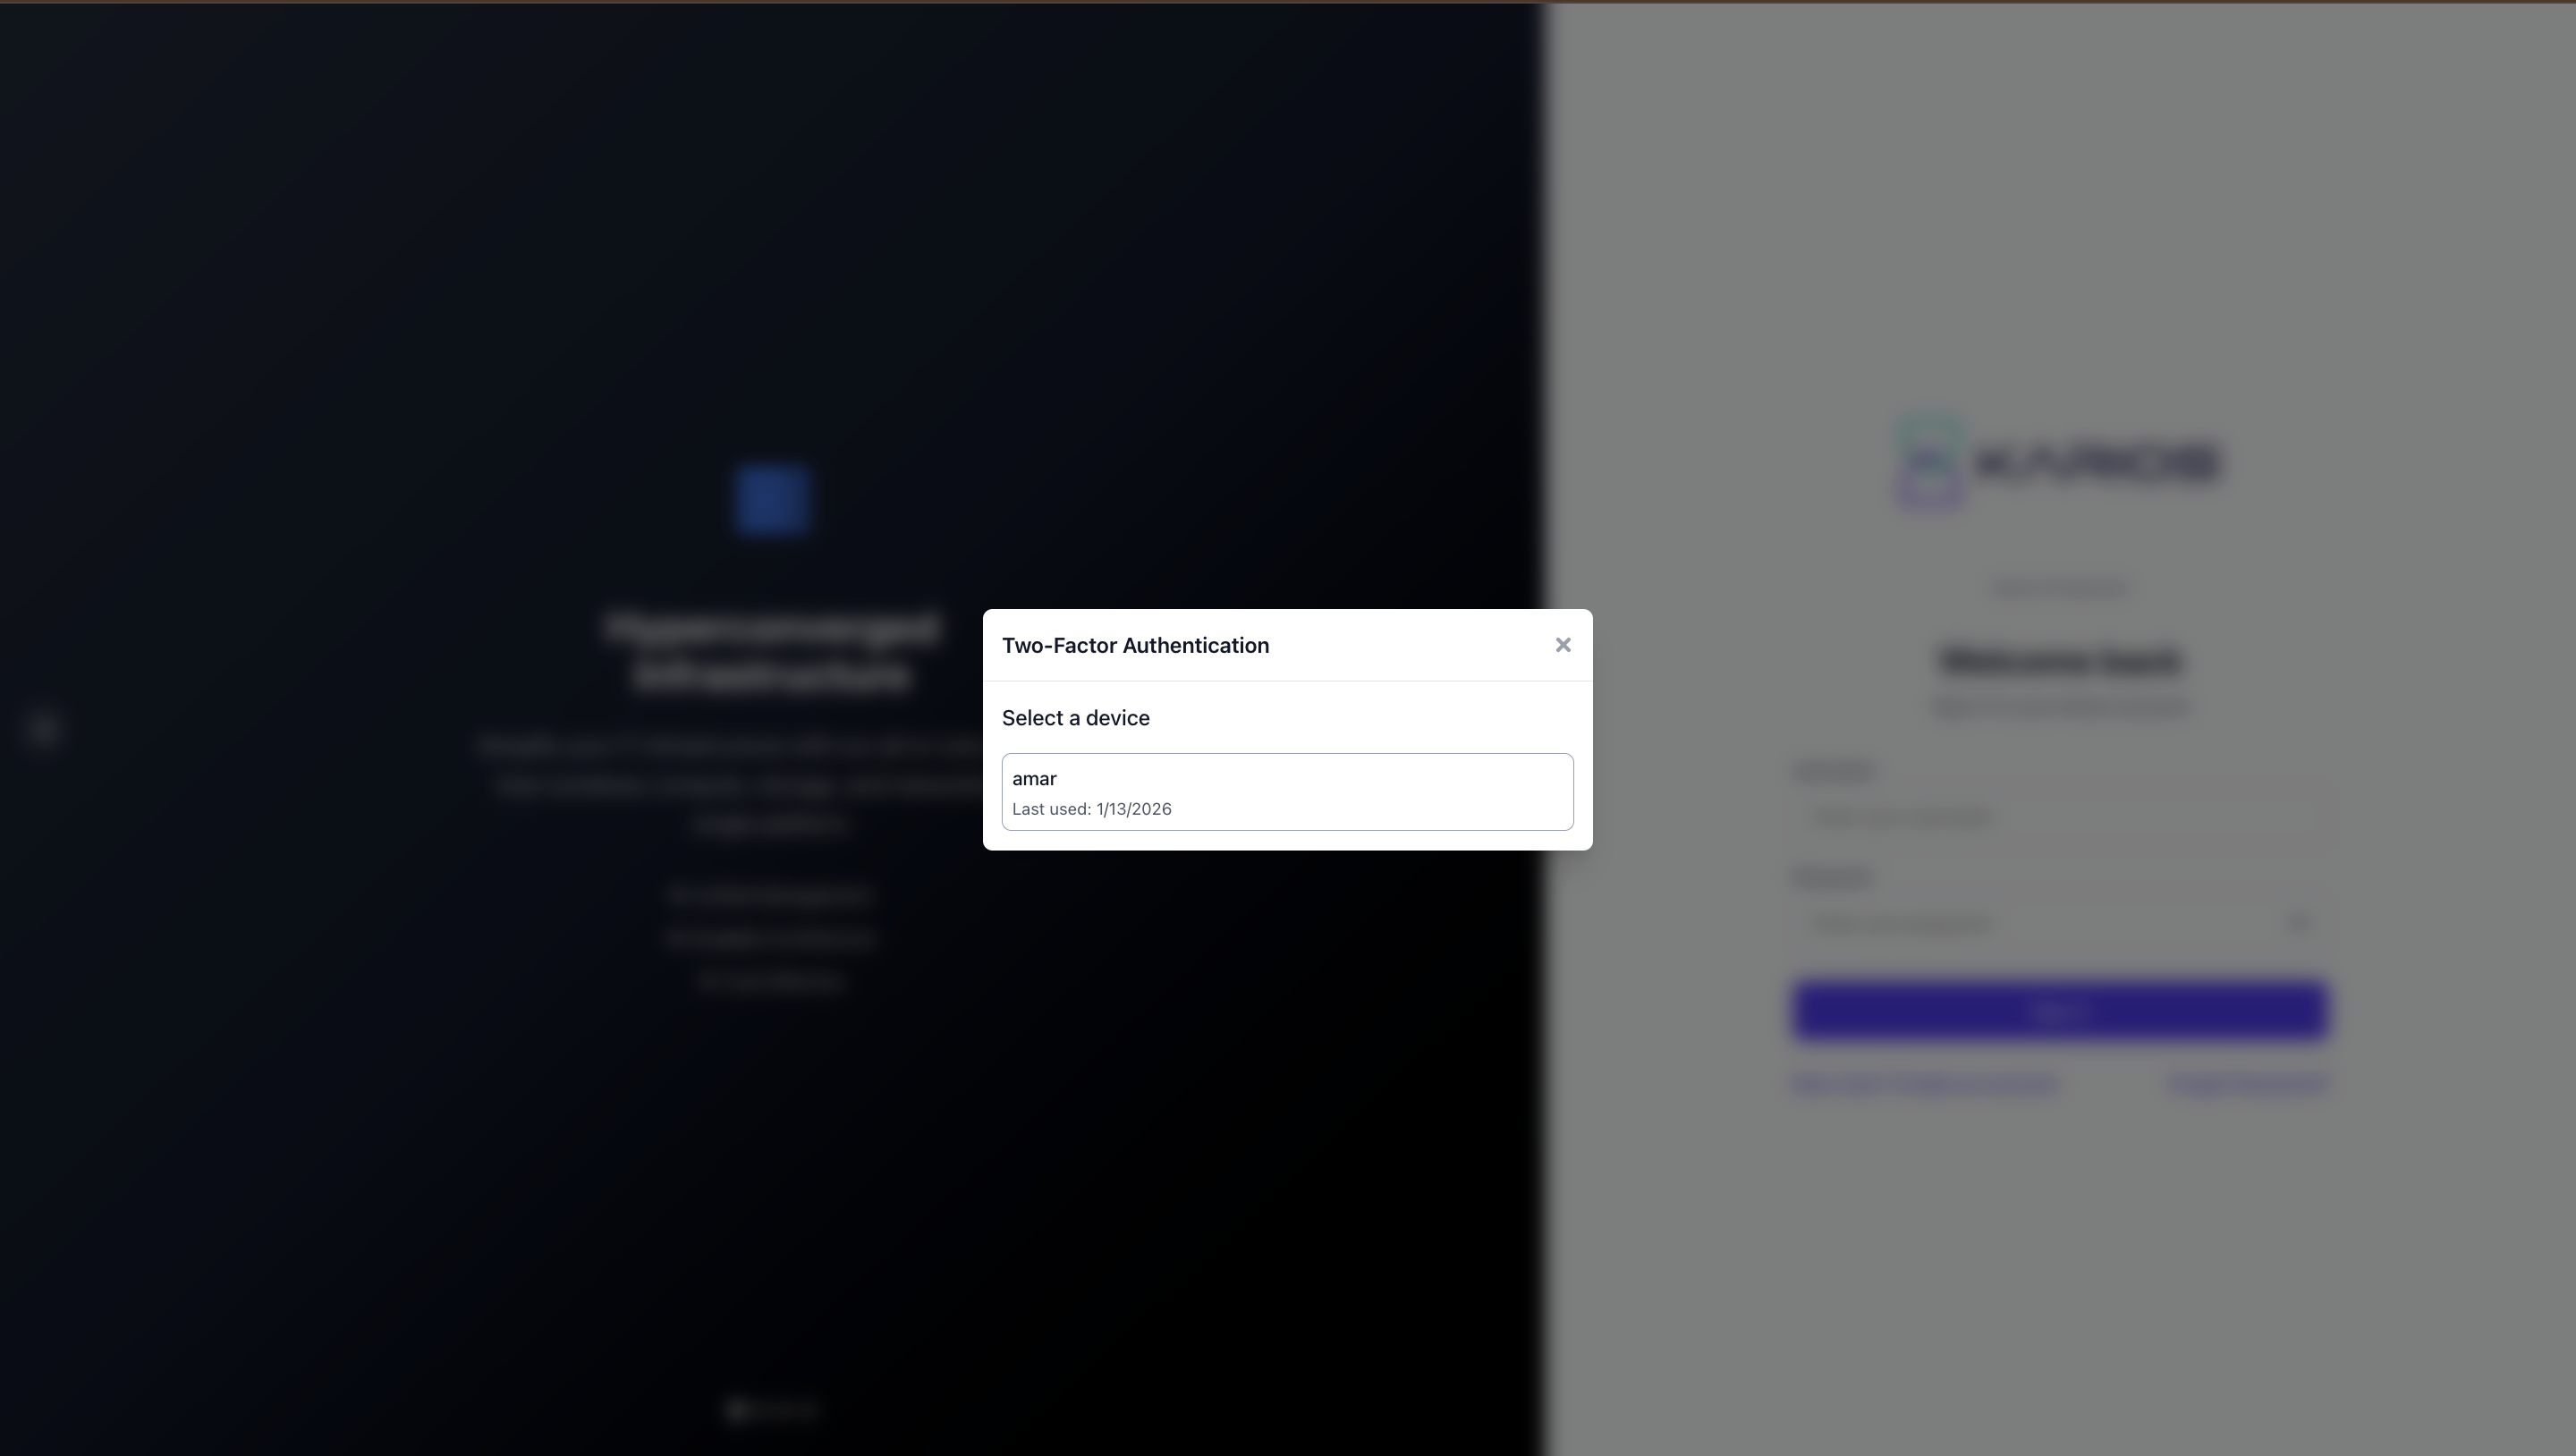
Figure : Forgot Password Choose Device
Give your 2FA code to reset your password.
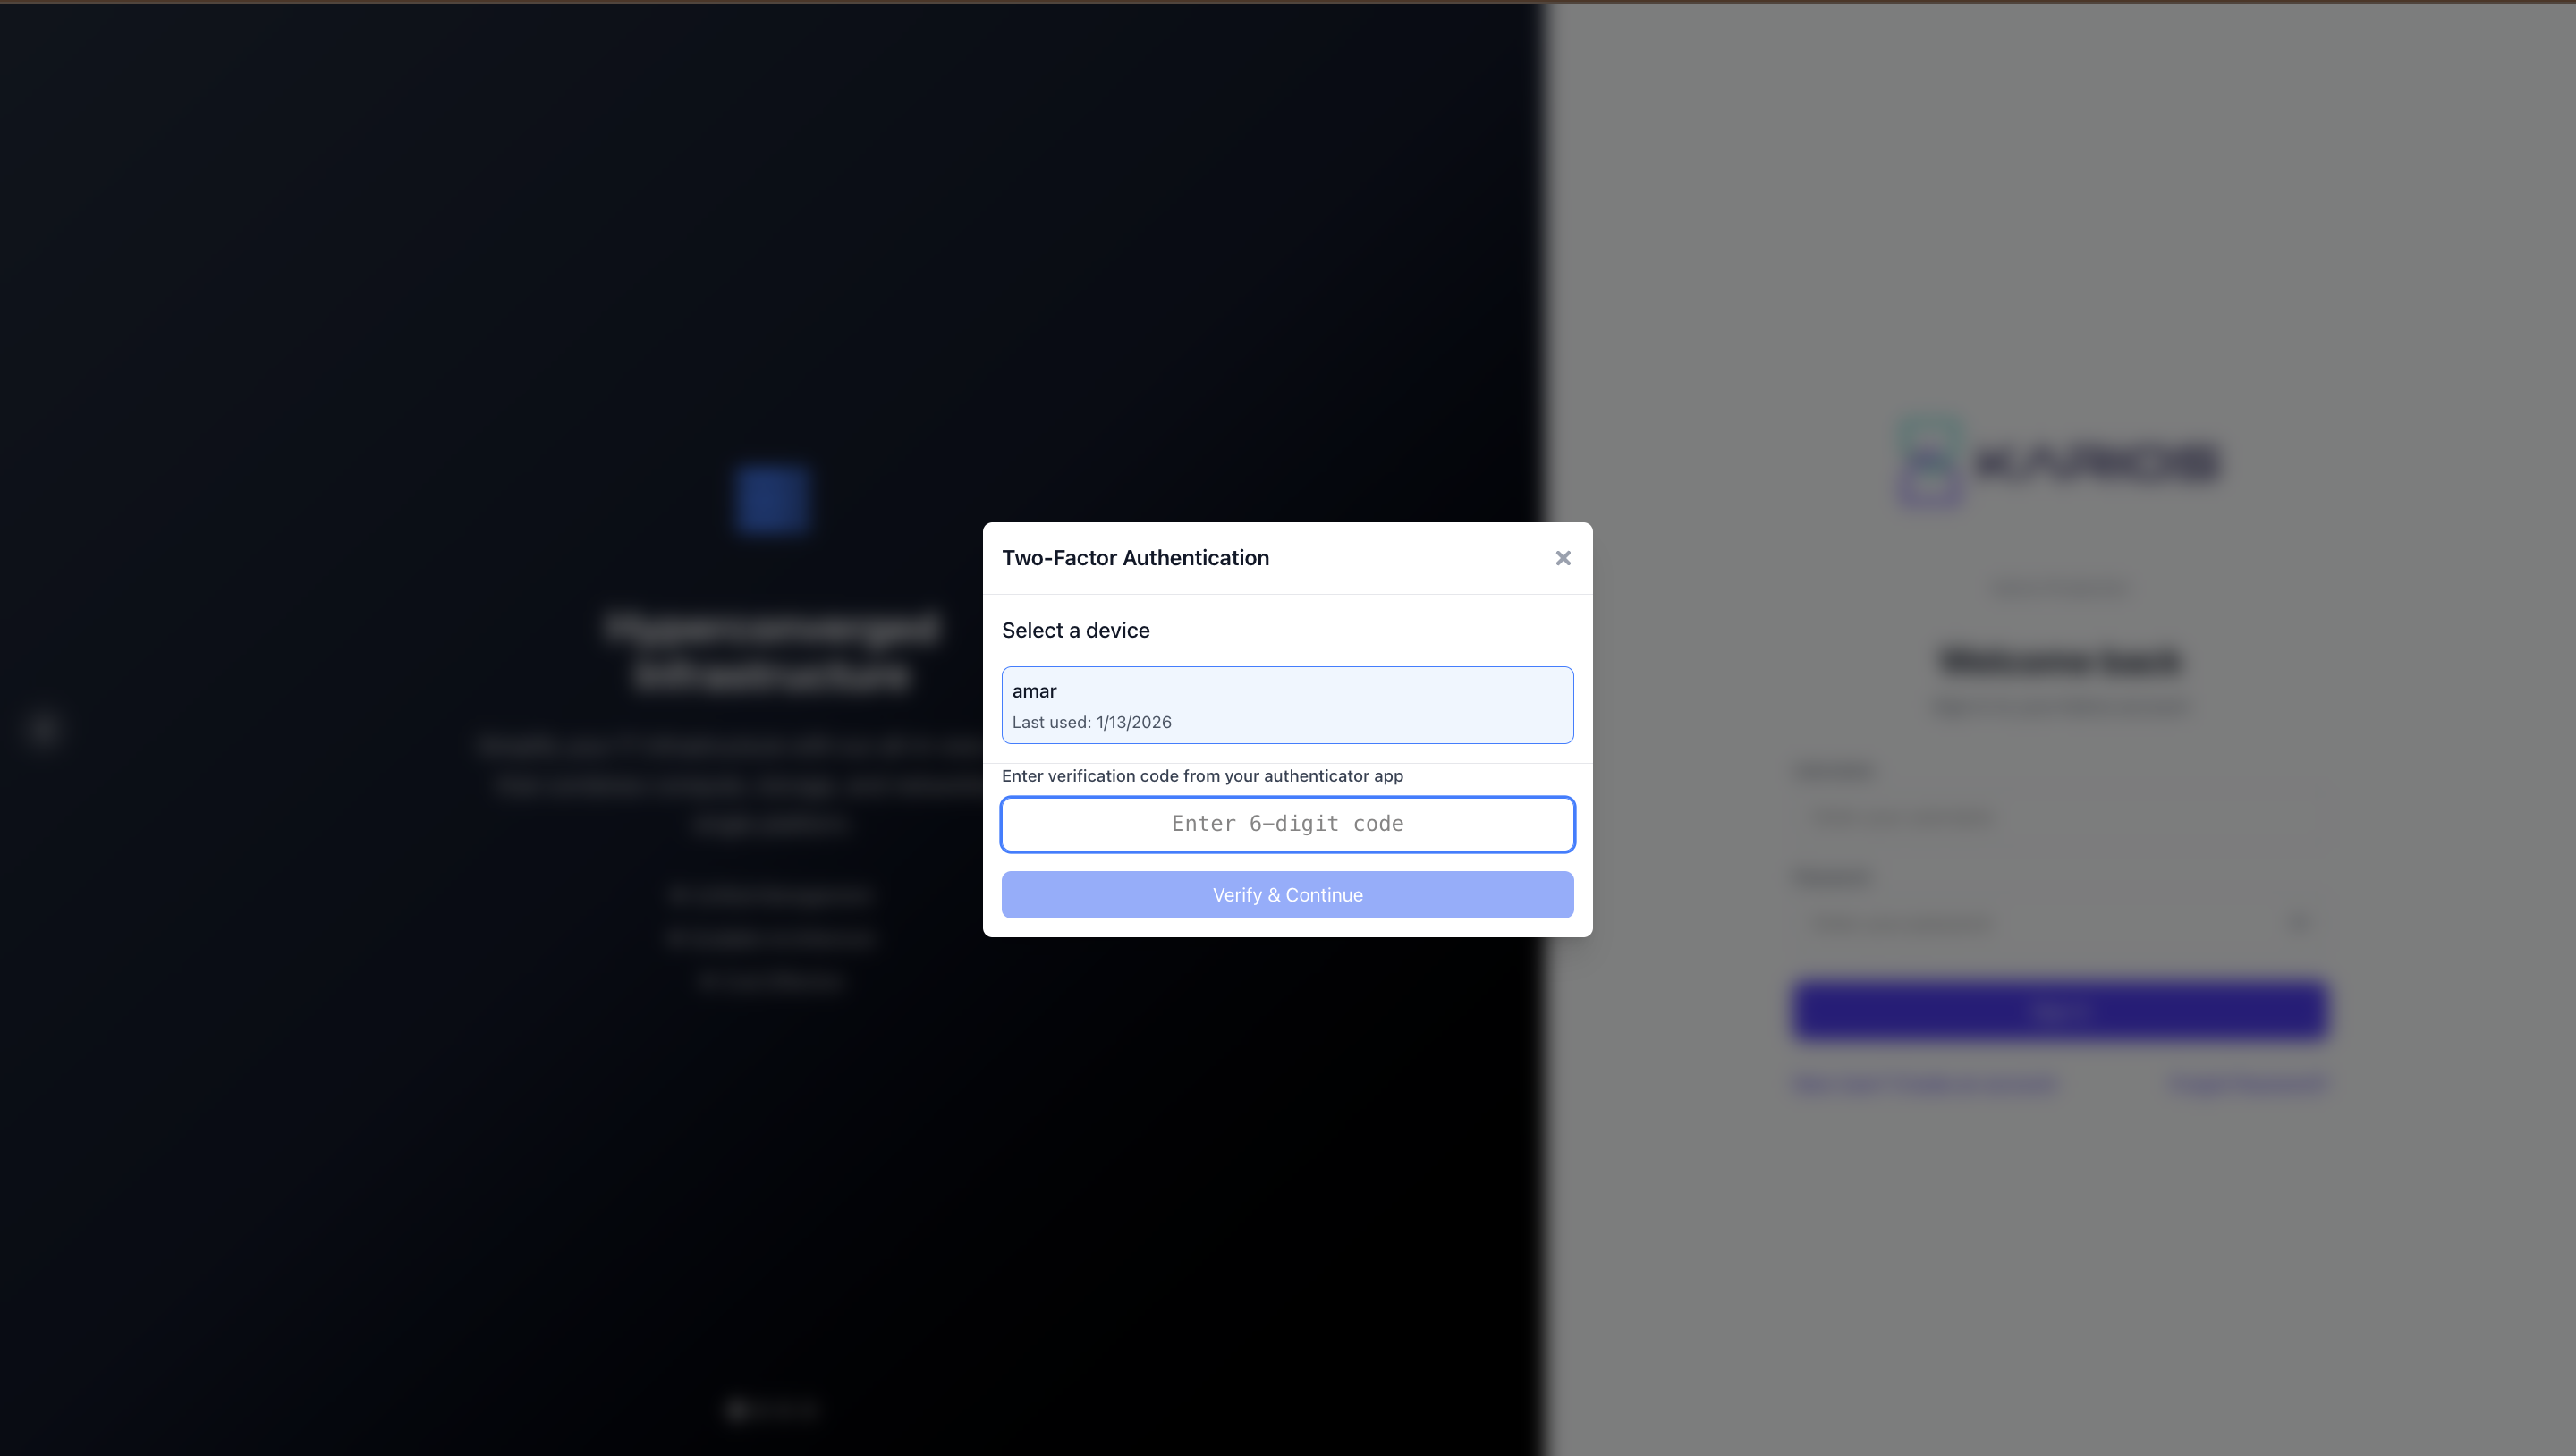
Figure : Forgot Password Enter 2FA
Once 2FA is verified, you will be able to reset your password. Give your new password and confirm it.
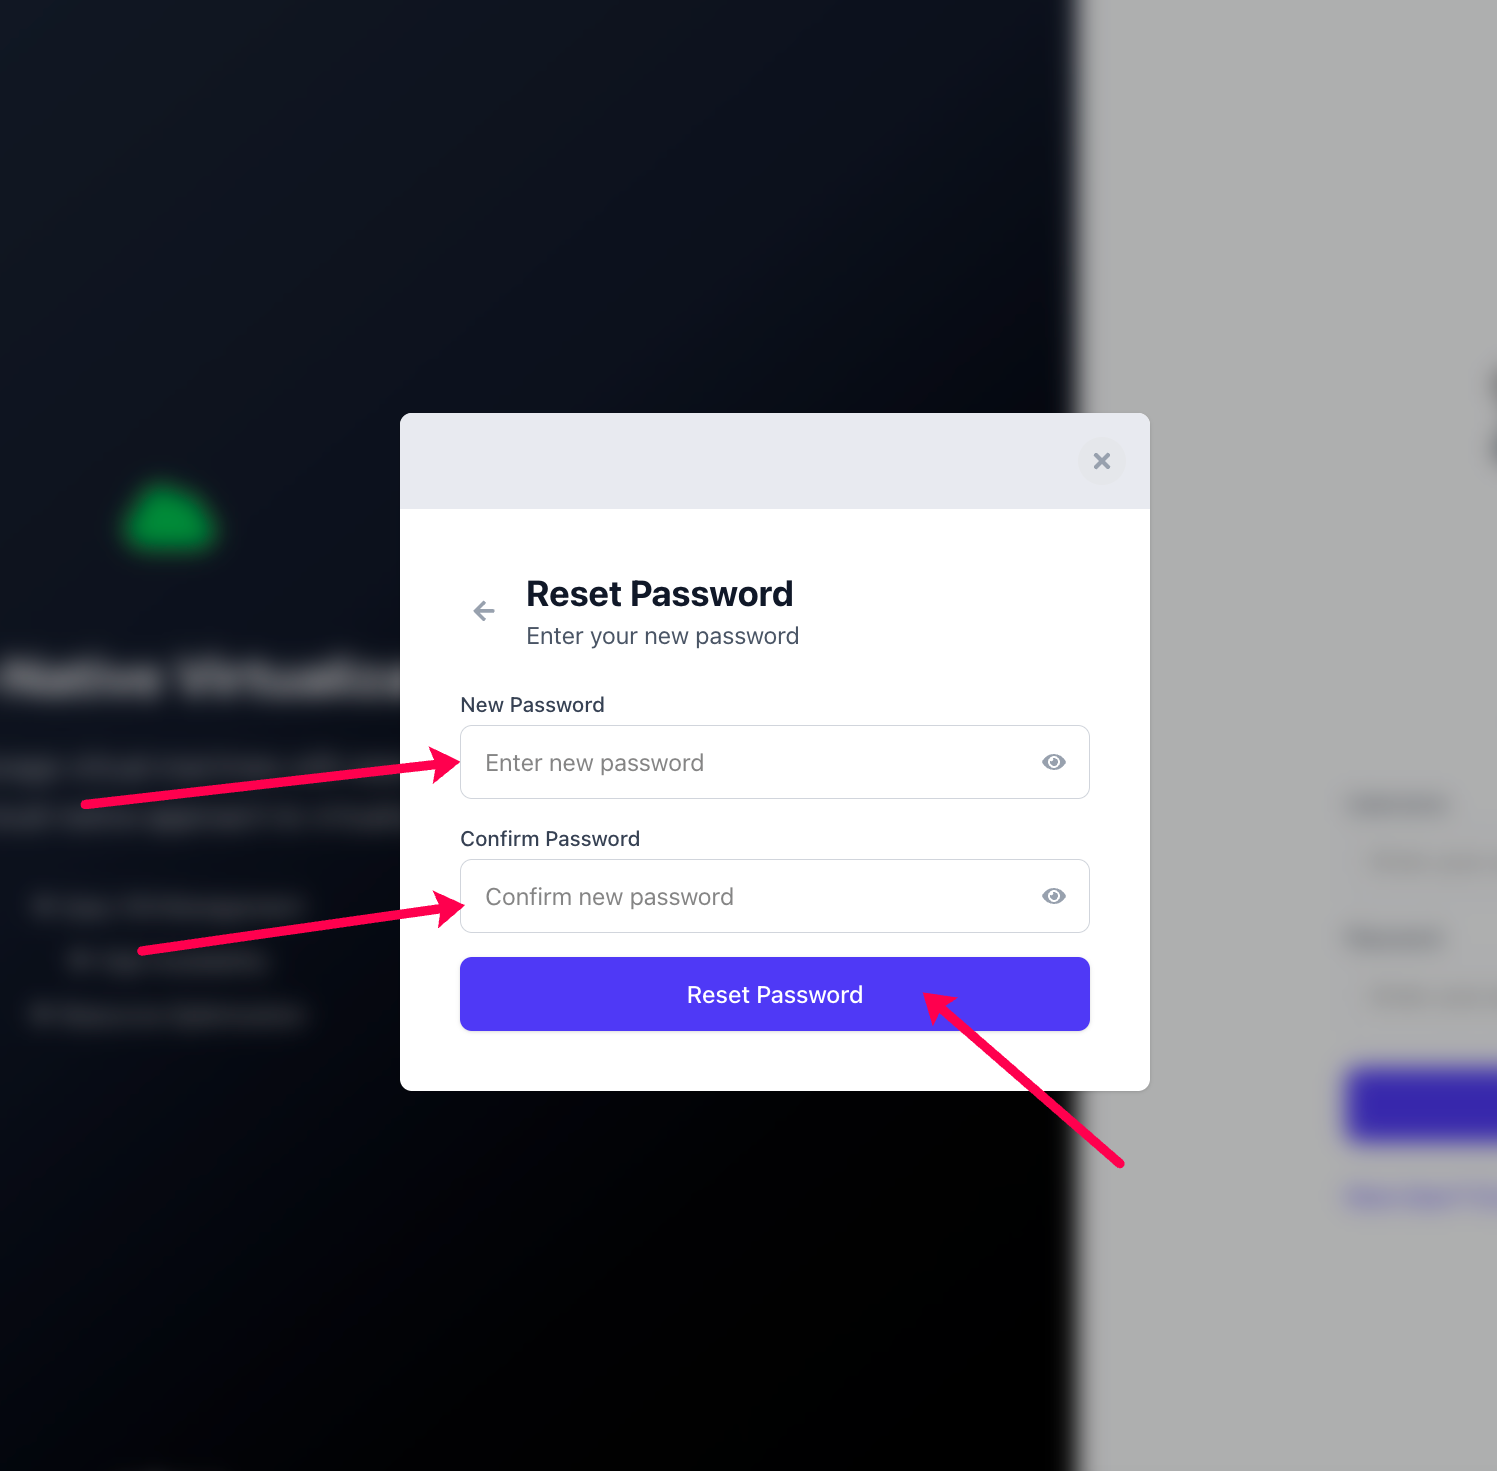
Figure : Forgot Password Reset To New Password
Your password has been reset successfully. You can now log in with your new password.
Administrative Account Usage: Use administrative accounts only when necessary and change the default admin credentials immediately after initial login.
Dashboard Overview
Control Center: Provides access to the main control center interface
Navigation Menu: Offers quick access to key system components (Provisioning Center, Storage, Seaweed, ISO, Network, Event logs, Stats)
License Status: Displays your license expiration date in the top banner
User Profile: Allows you to manage your user settings and profile information
System Statistics: Provides real-time system status and resource counters
Configure Prerequisites
Before using Karios, ensure your environment meets the following prerequisites:
Access Technitium Portal
Open a web browser and navigate to the Technitium portal:
$cat /root/karios_install_info.txt
Open the TECHNITIUM_WEB_URL in your browser.
Log in using the default credentials:
Note
Username: admin
Password: adminadmin
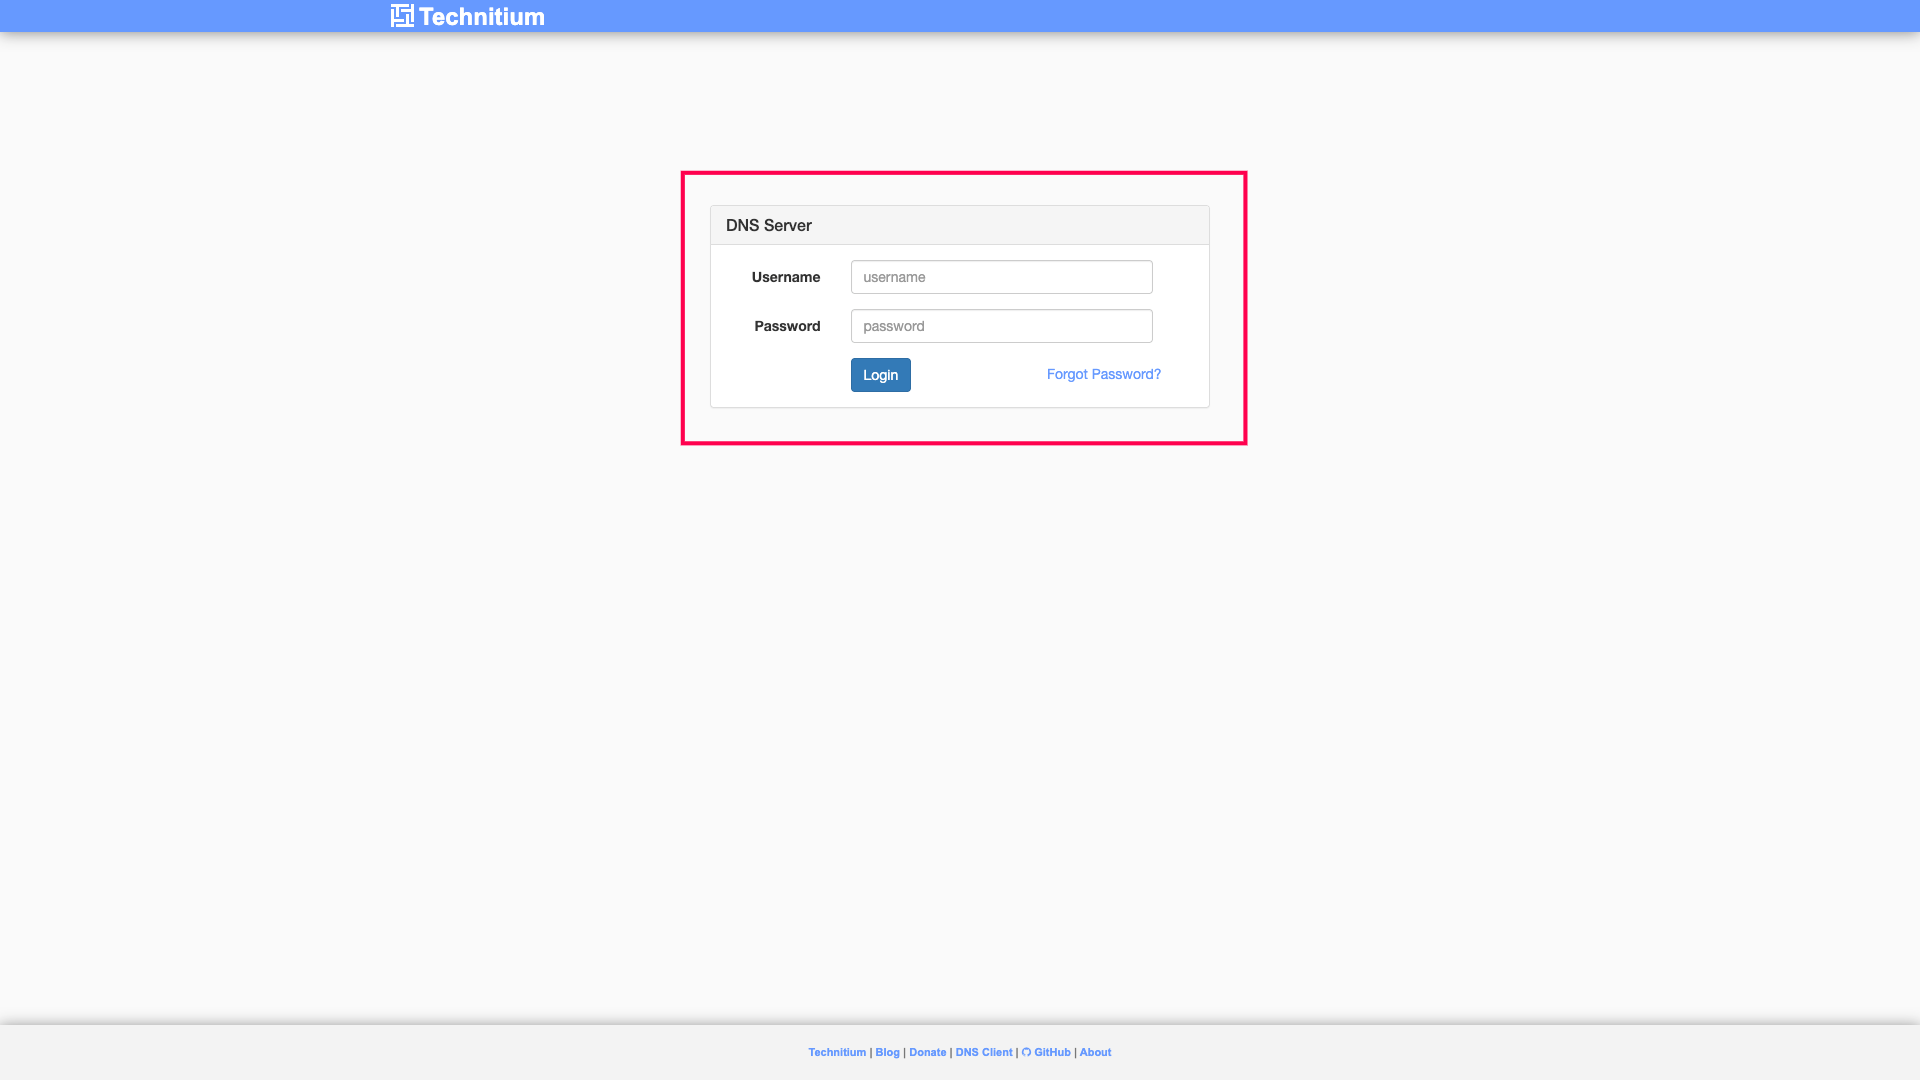
Figure : Technitium Login
Navigate to the “DHCP” section to configure network settings, DHCP scope is already set to match your network configuration.
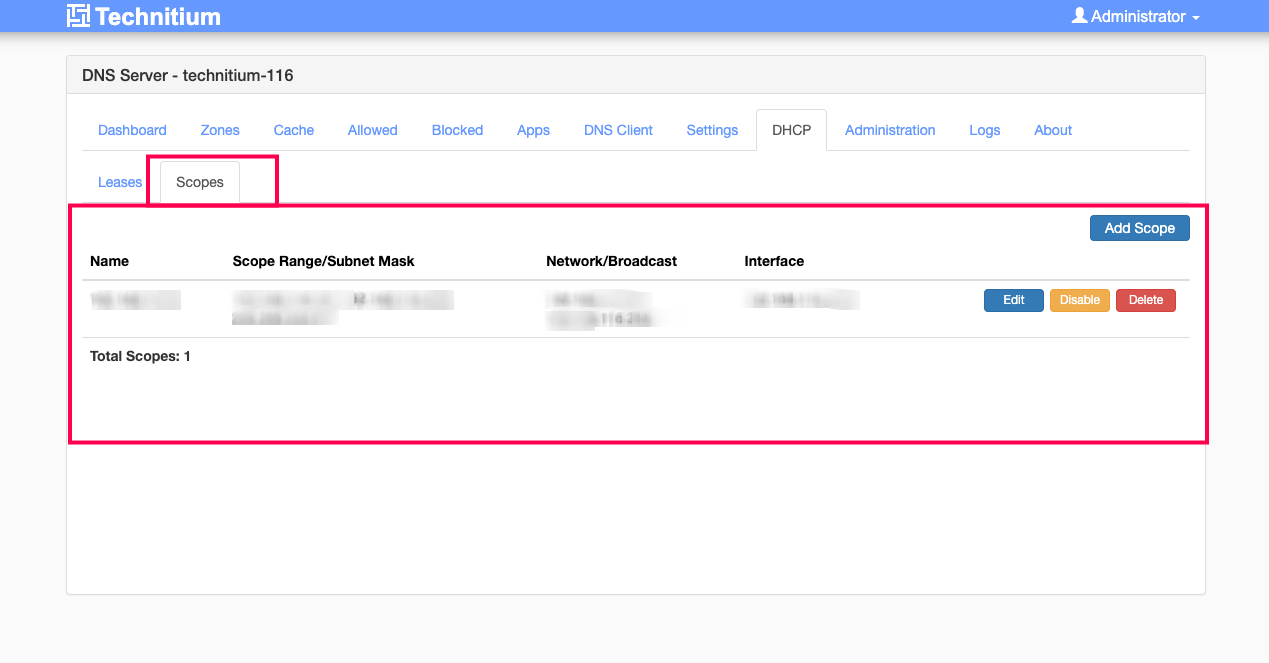
Figure : Technitium DHCP
Enable the DHCP scope before proceeding.
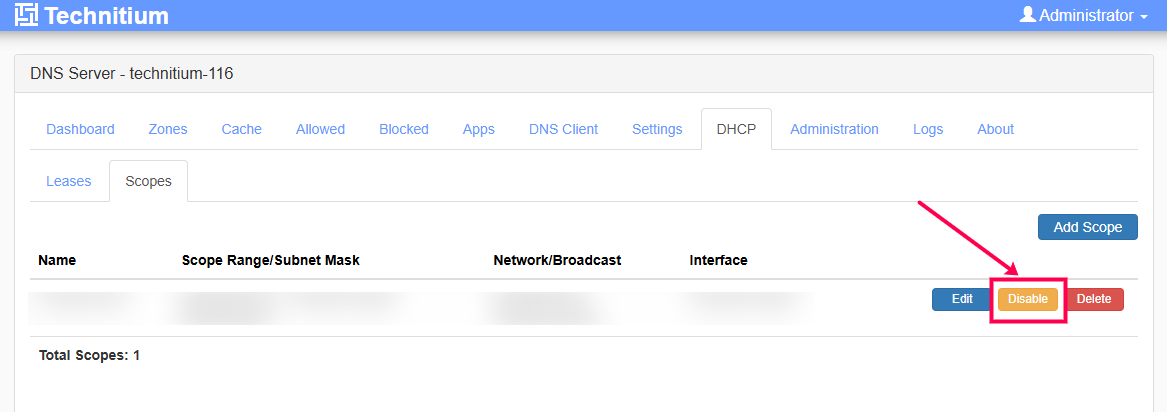
Figure : Technitium DHCP Scope Configuration
Navigate to Zones section to configure DNS settings. A DNS zone is already set to match your network configuration.
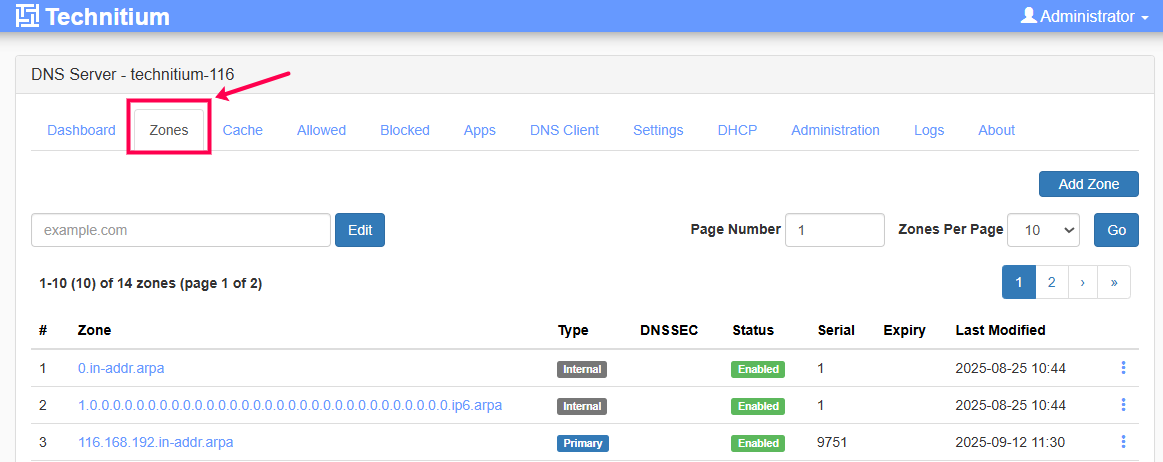
Figure : Technitium DNS
Warning
Critical Network Configuration Notice Disable any DHCP or DNS services running on your network to avoid conflicts.
Technitium information: Please wait for the Technitium information to populate in the karios_install_info.txt file located at /root/karios_install_info.txt on the control node. This will take approx 10 mins.
Refer to Technitium DHCP and DNS Setup documentation for detailed instructions.
Interface Overview
Main Dashboard Components
After license validation and resource allocation, users have access to the following interface elements:
Navigation Elements
Storage: Storage management and configuration
ISO: Operating system image management and virtual media mounting
Event Logs: System event monitoring, and log management
Stats: System statistics and performance metrics
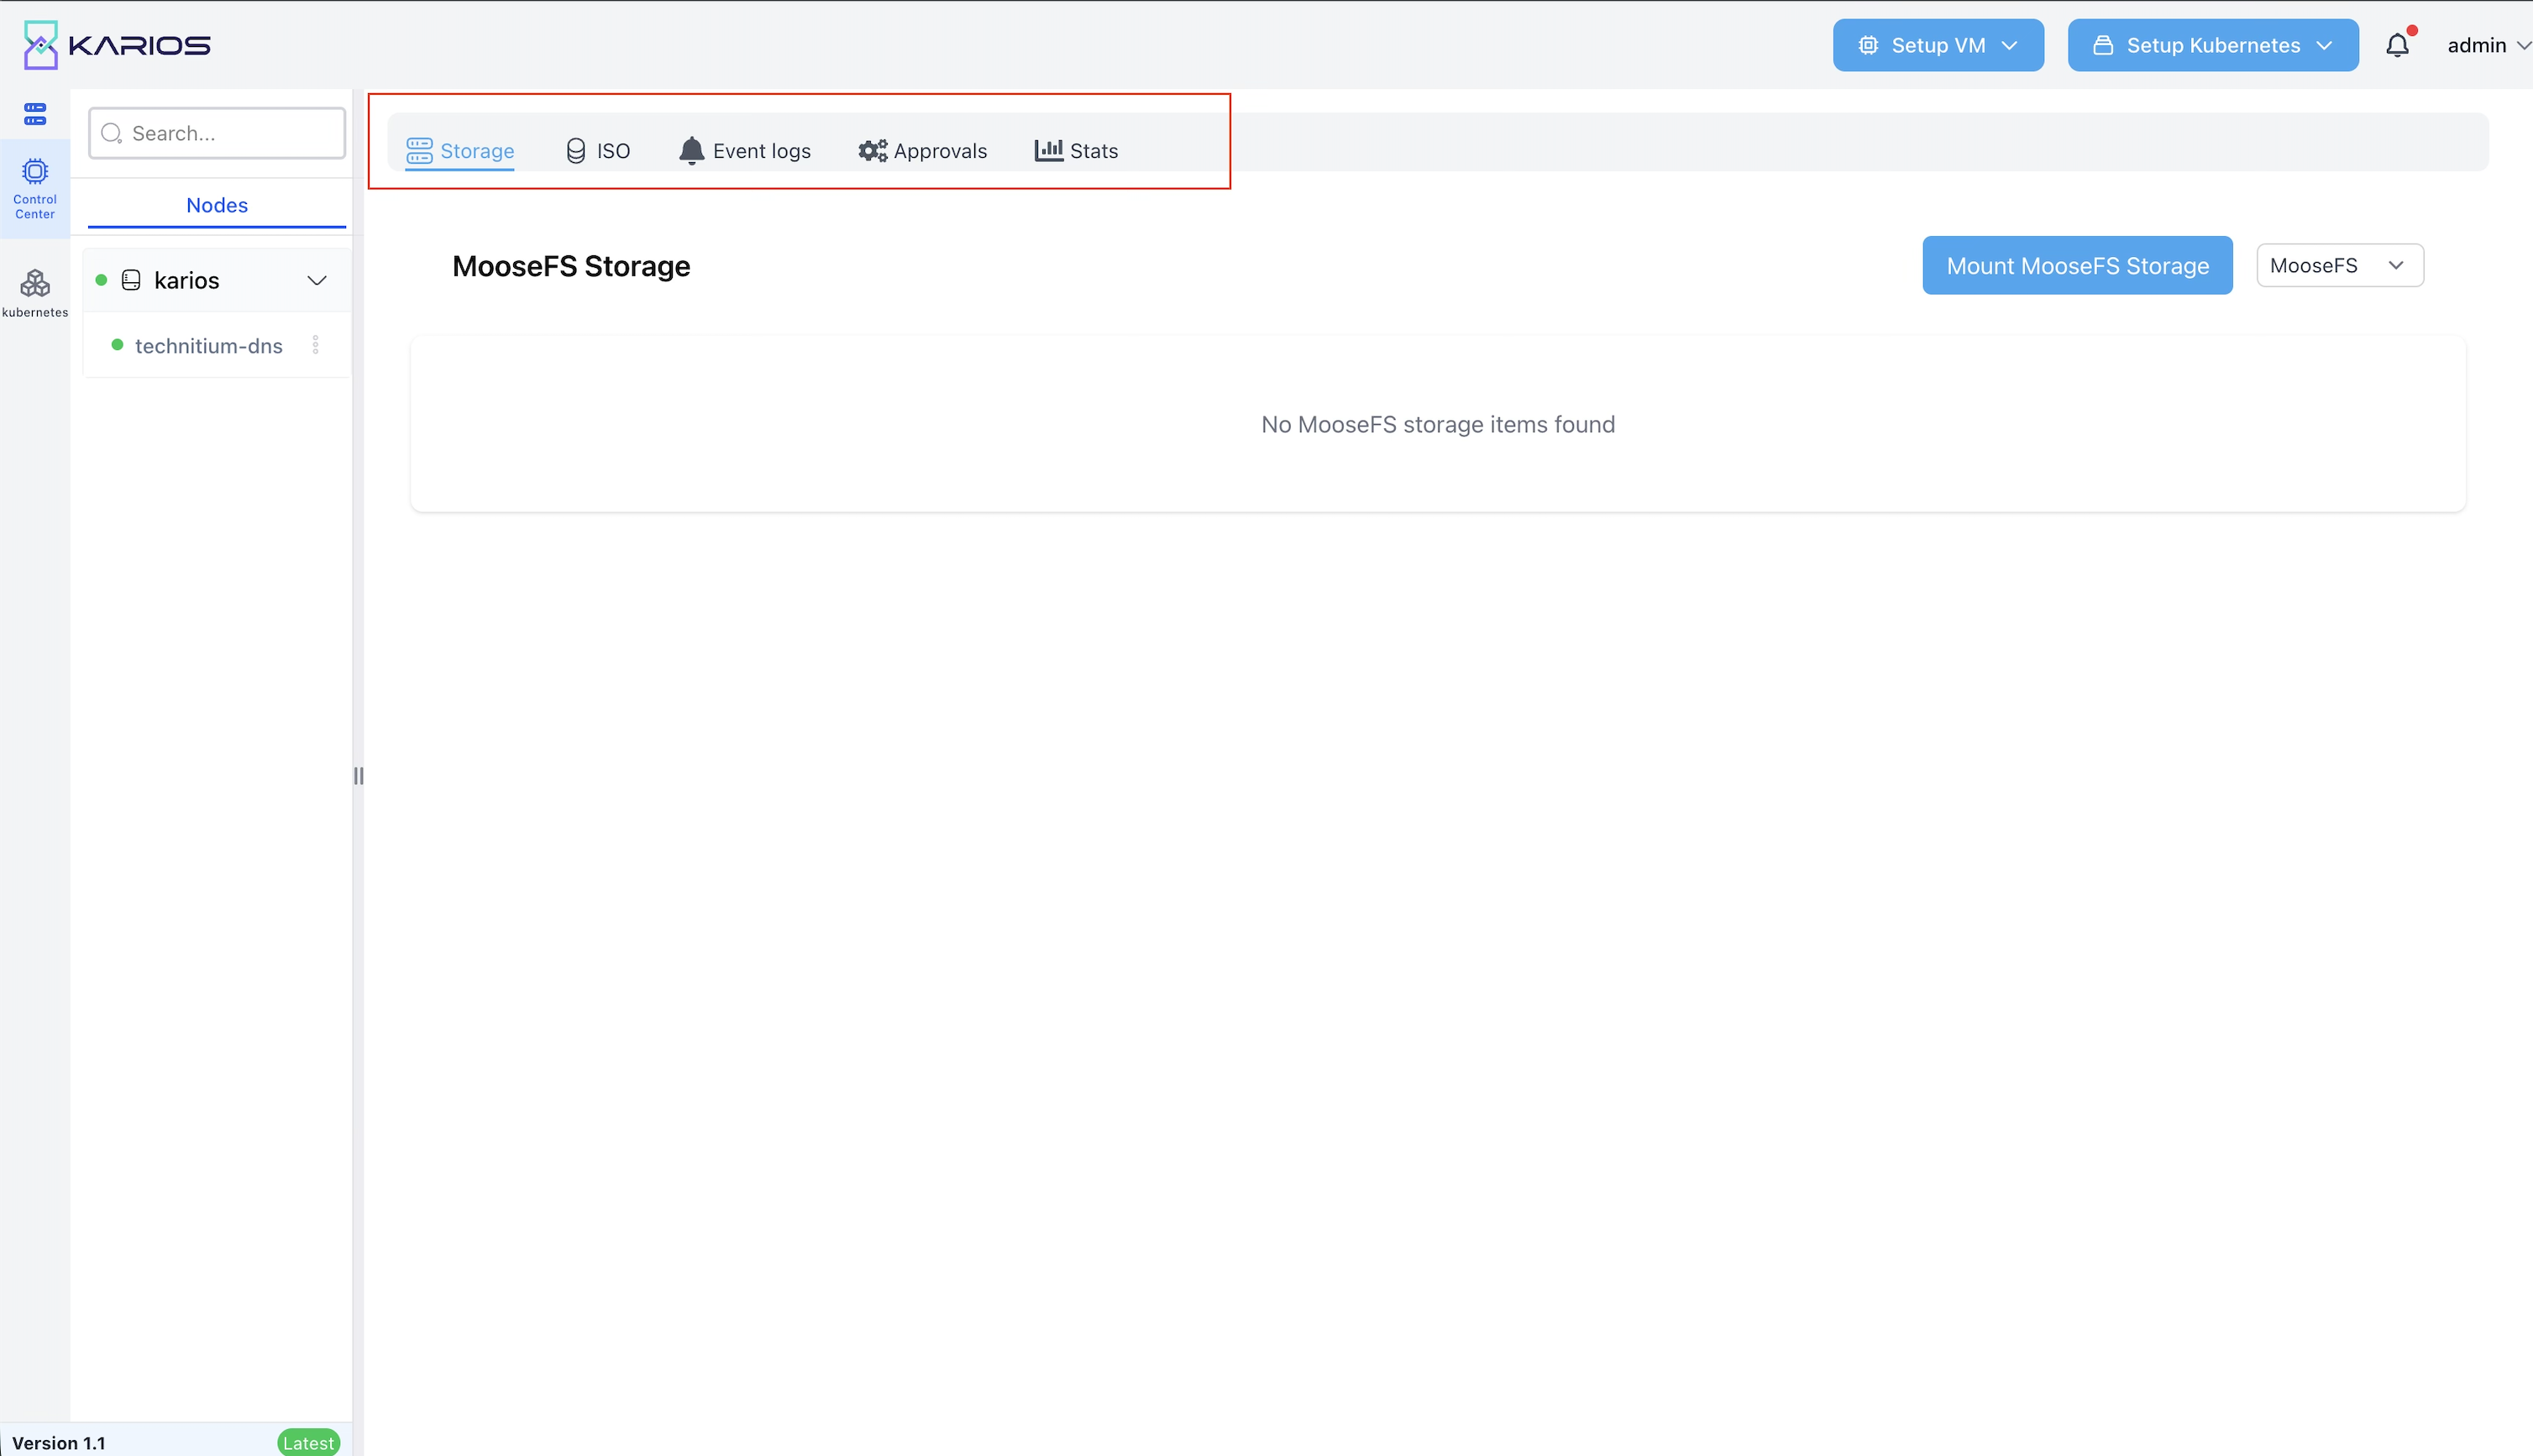
Node Management
Selected Server: Current server selection
Server Information: System details including make, model, and network configuration
Add-in Cards: PCIe device information and availability
Power Management: Power consumption and efficiency metrics
Network Interfaces: Physical and virtual interface management

User Management & Permissions
Karios employs a role-based access control (RBAC) model to manage user permissions. The following roles are available:
Admin: Full access to all system features and settings.
User: Limited access to specific features based on assigned permissions.
Viewer: Read-only access to system information and dashboards.
Managing User Accounts
Creating Users: Admins can create new user accounts through the user management interface.
Editing Users: User details, including roles and permissions, can be modified by admins.
Deleting Users: Inactive or unnecessary user accounts can be deleted by admins.
RBAC Architecture and Design Philosophy
Hierarchical Permission Model
Permission-Based Authorization: The RBAC system implements a granular permission model where access is controlled through specific permissions rather than broad administrative categories. This provides:
Principle of Least Privilege: Users are granted only the minimum permissions necessary to perform their required tasks, preventing accidental system modifications.
Separation of Duties: Different administrative functions are separated into distinct roles, preventing any single user from having unlimited system access and creating accountability trails.
Scalable Authorization: The permission system can accommodate complex organizational structures with varying levels of access requirements across different operational domains.
Predefined Role Definitions
Administrative Roles:
System Admin Role
Scope: Complete system administration with full access to all subsystems
Permissions: All available permissions including user management
Node Admin Role
Scope: Comprehensive node management with extensive system access
Key Capabilities: VM management, network configuration, storage administration, power management
Specialized Administrative Roles:
VM Admin Role
Focus: Virtual machine lifecycle management and operations
Operational Scope: VM creation, configuration, backup, and monitoring
Storage Access: Read-only storage visibility for capacity planning
Network Access: Read-only network visibility for VM network configuration
Network Admin Role
Specialization: Network infrastructure configuration and management
Scope: Network device configuration, VLAN management, routing policies
Integration: Limited node visibility for network-related hardware management
Storage Admin Role
Domain: Storage system configuration and management
Responsibilities: ZFS pool management, filesystem creation
Integration: Node visibility for storage hardware monitoring
Scope: Storage client protocol configuration and management
End-User Roles:
ReadOnly User Role
Purpose: Monitoring and reporting access without modification capabilities
Scope: Comprehensive visibility across all system components
Role Assignment and Management Procedures
User Provisioning Process
The user provisioning process follows these key steps:
Role Determination: Select appropriate role based on job responsibilities
Account Creation: Create user account with assigned role
Initial Setup: Configure user preferences and access credentials
Training: Provide role-specific system training
Monitoring: Initial monitoring period for new users
Role Modification Procedures Users may require role changes due to evolving job functions or organizational changes. The role modification process includes:
Role Upgrade: Process for granting additional permissions
Role Downgrade: Process for removing unnecessary permissions
Temporary Access: Procedures for temporary permission elevation
Emergency Access: Emergency procedures for critical system access
RBAC Implementation Through Web Interface
Accessing RBAC Management: The RBAC system is accessible through the admin dropdown menu in the top-right corner of the Karios interface, providing three main management sections:
Role Management: Create, edit, and delete custom roles
User Management: Register, manage, and assign roles to users
2FA Management: Configure two-factor authentication settings
Note
Administrative Access Requirements: RBAC management requires System Admin privileges or USER_MANAGE permissions to access role and user management functions.
Role Creation Process
Step 1: Access Role Management
Navigate to admin dropdown → “Role Management”
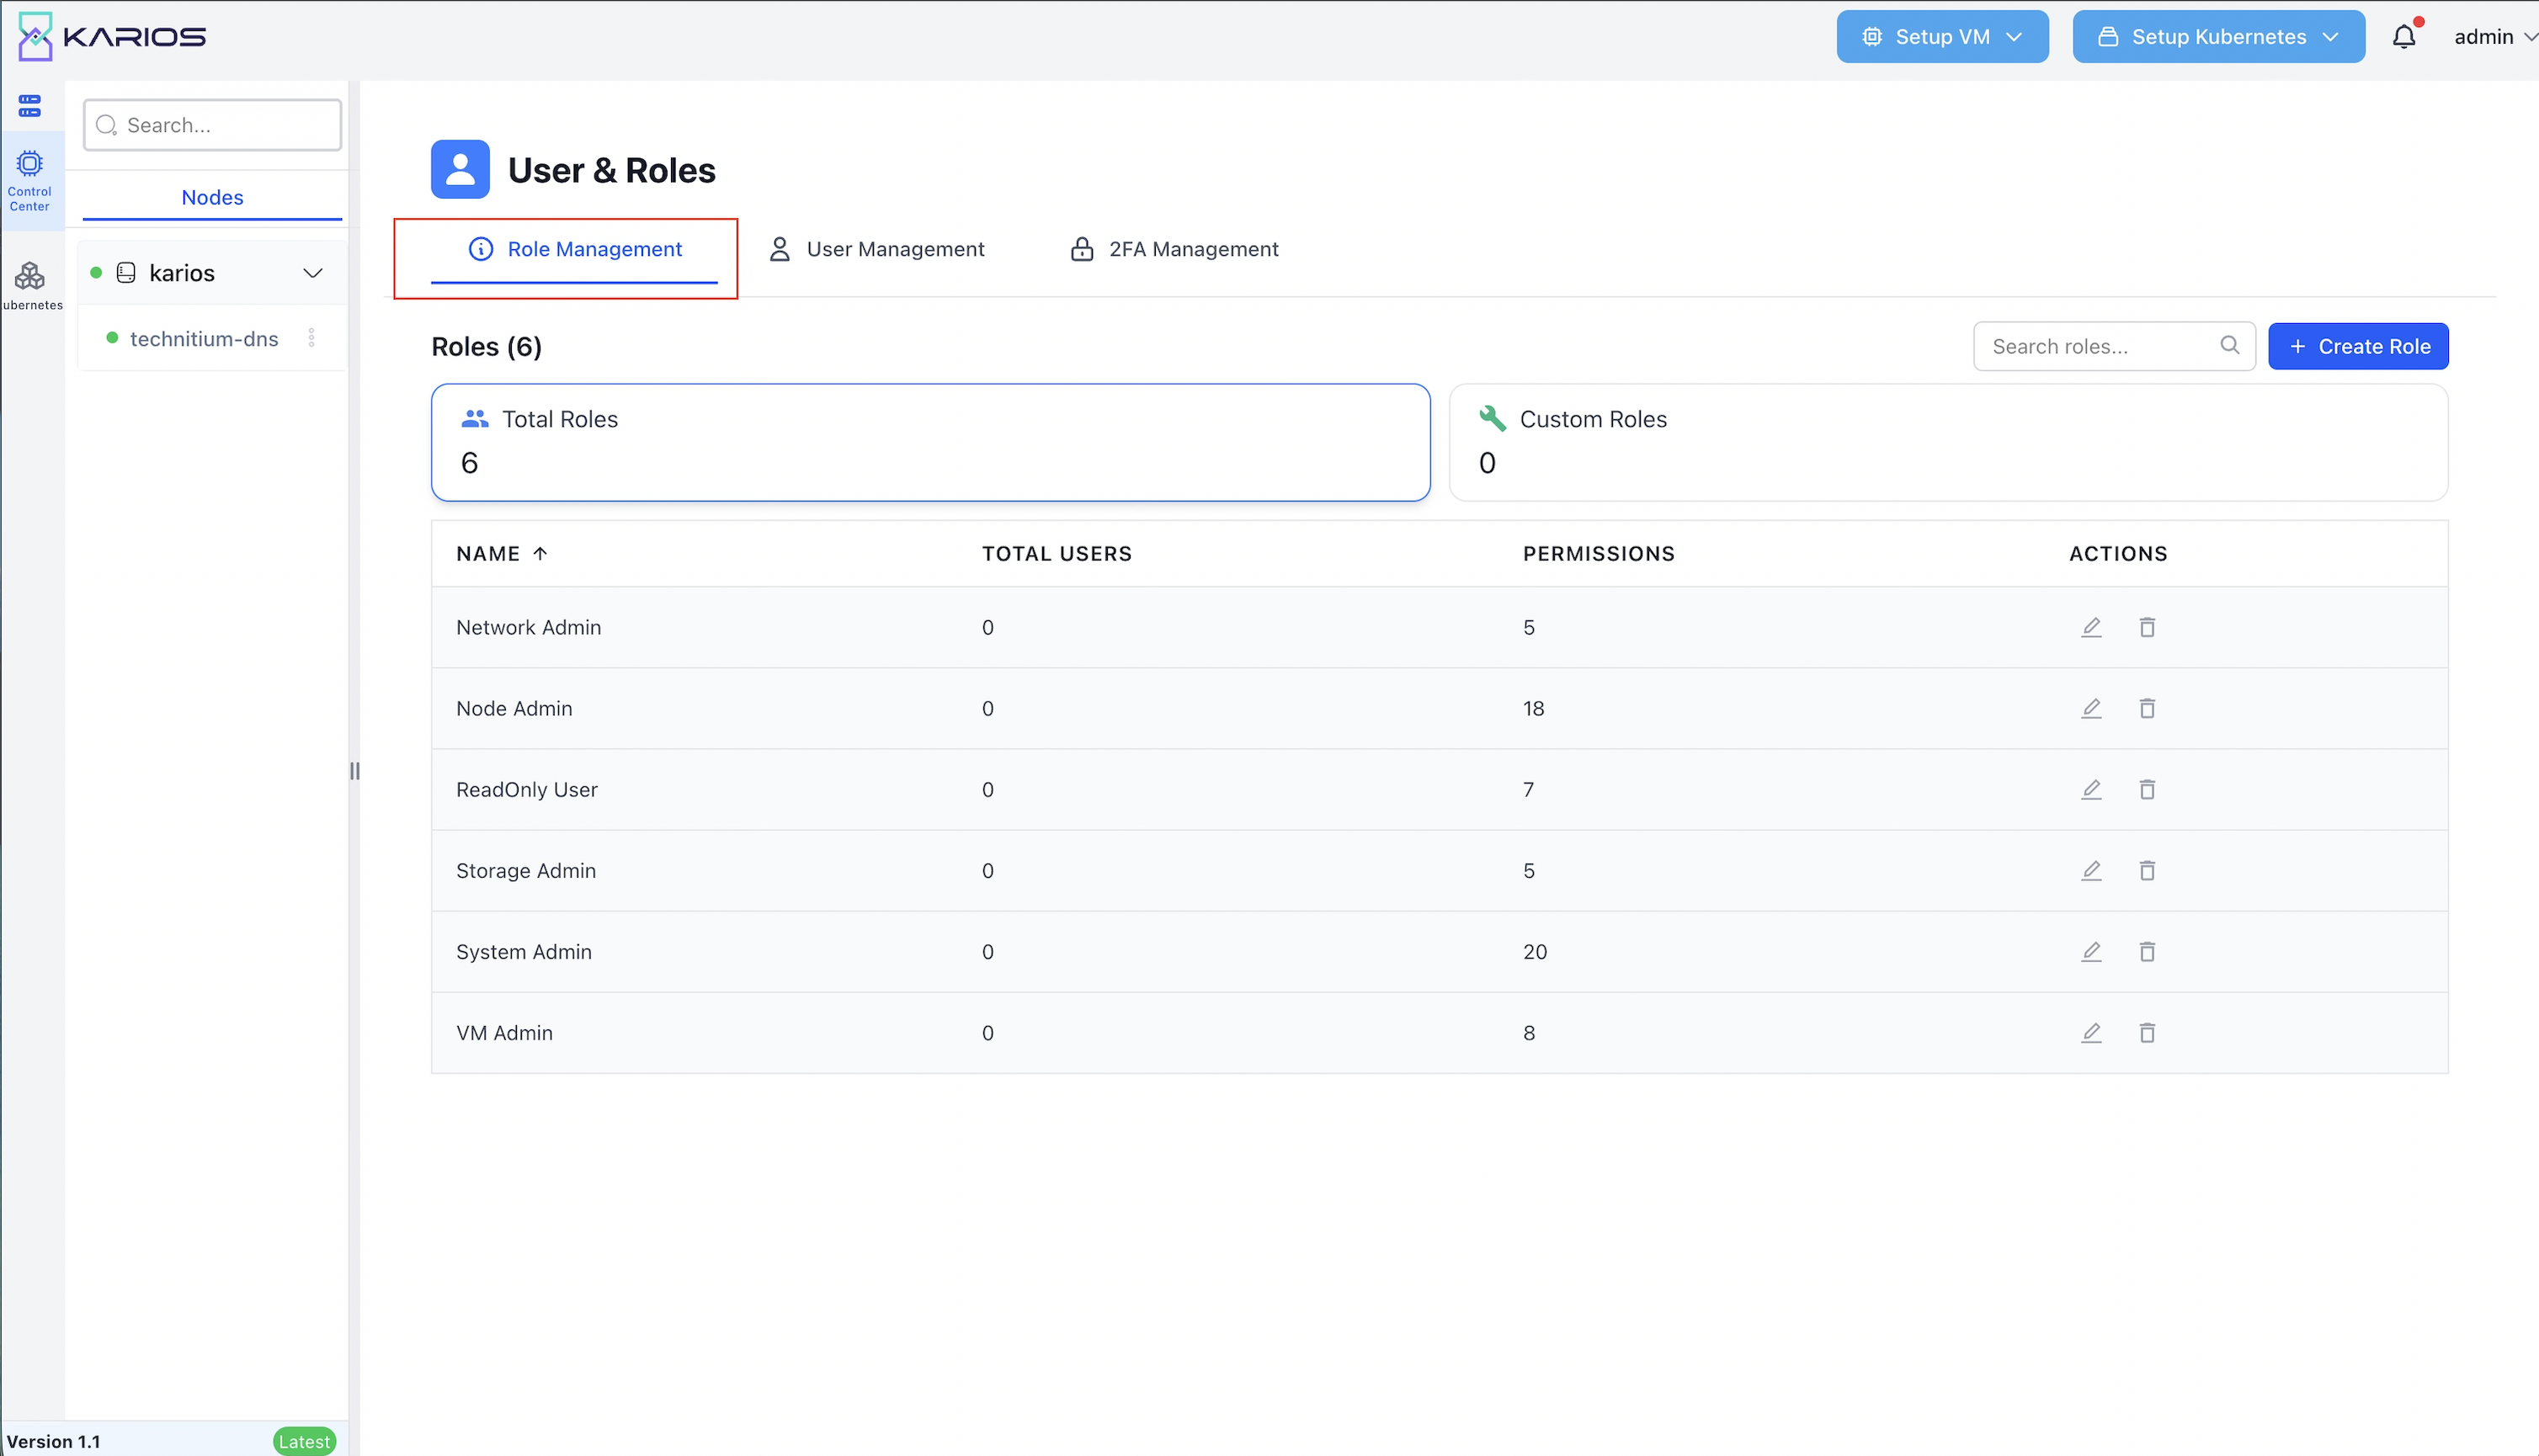
Figure : Navigate to Role Management
The interface displays existing roles on the right side
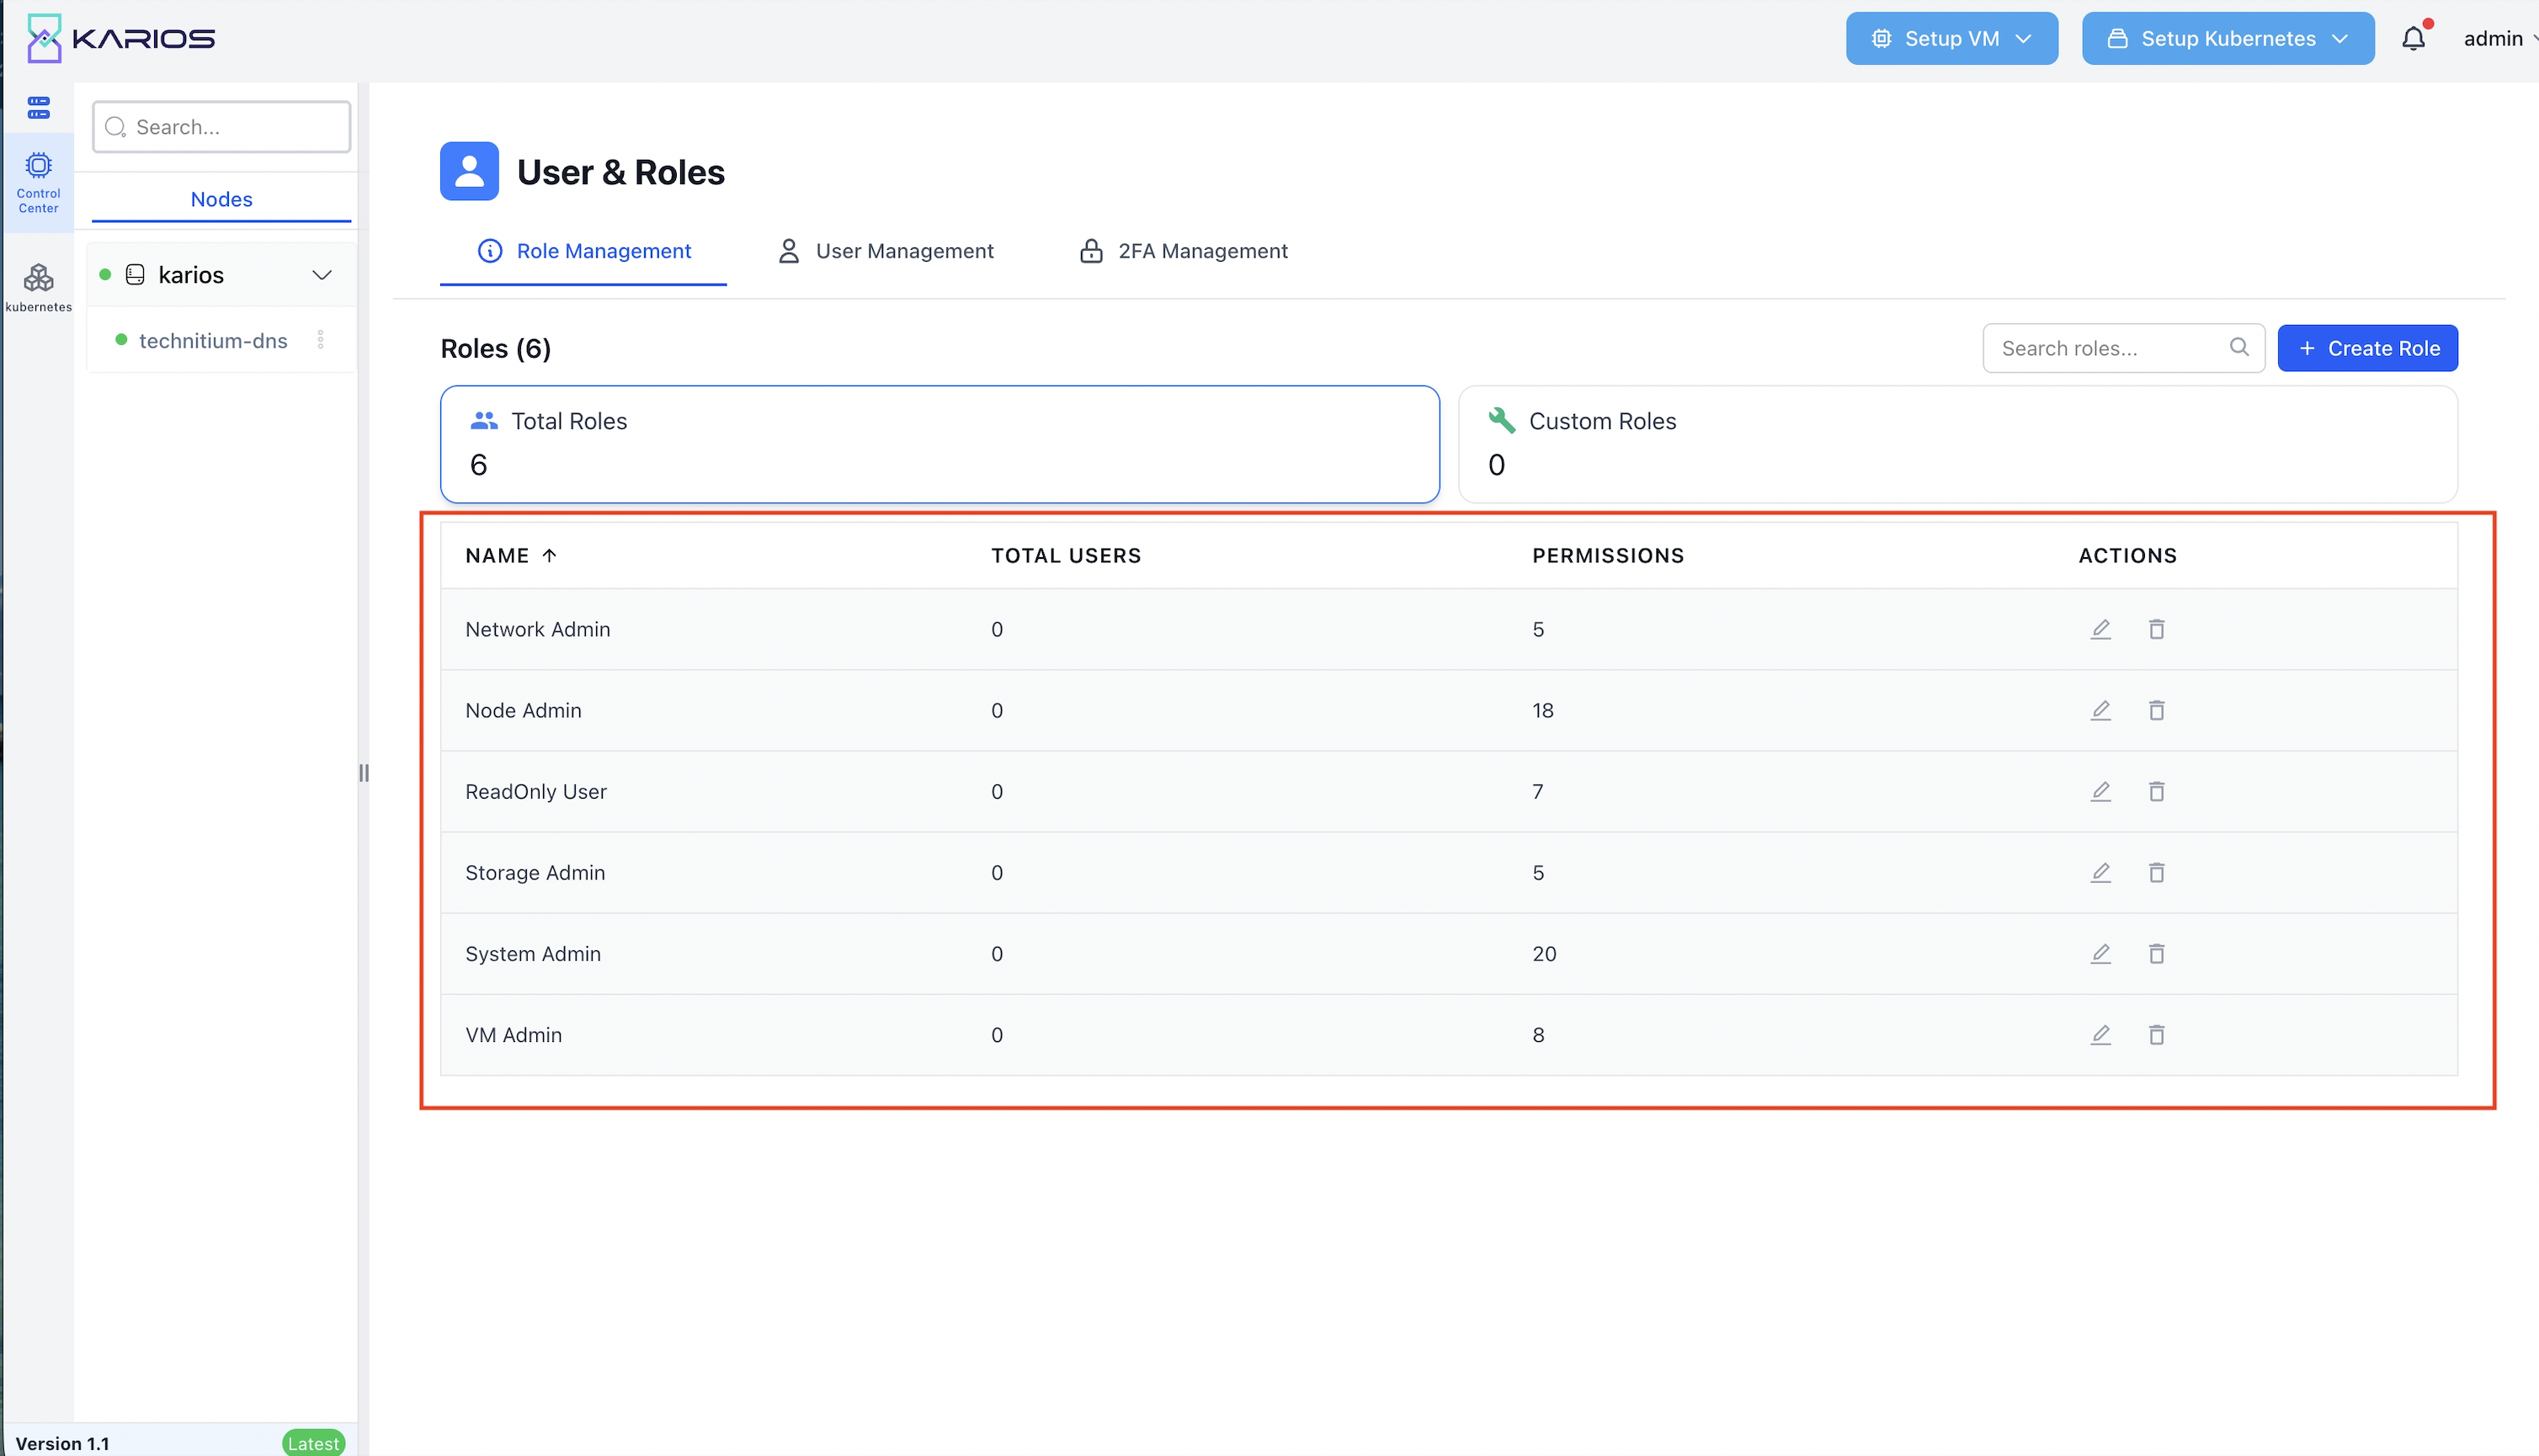
Figure : Role List
Use the “Create Role” section on the right to define new roles
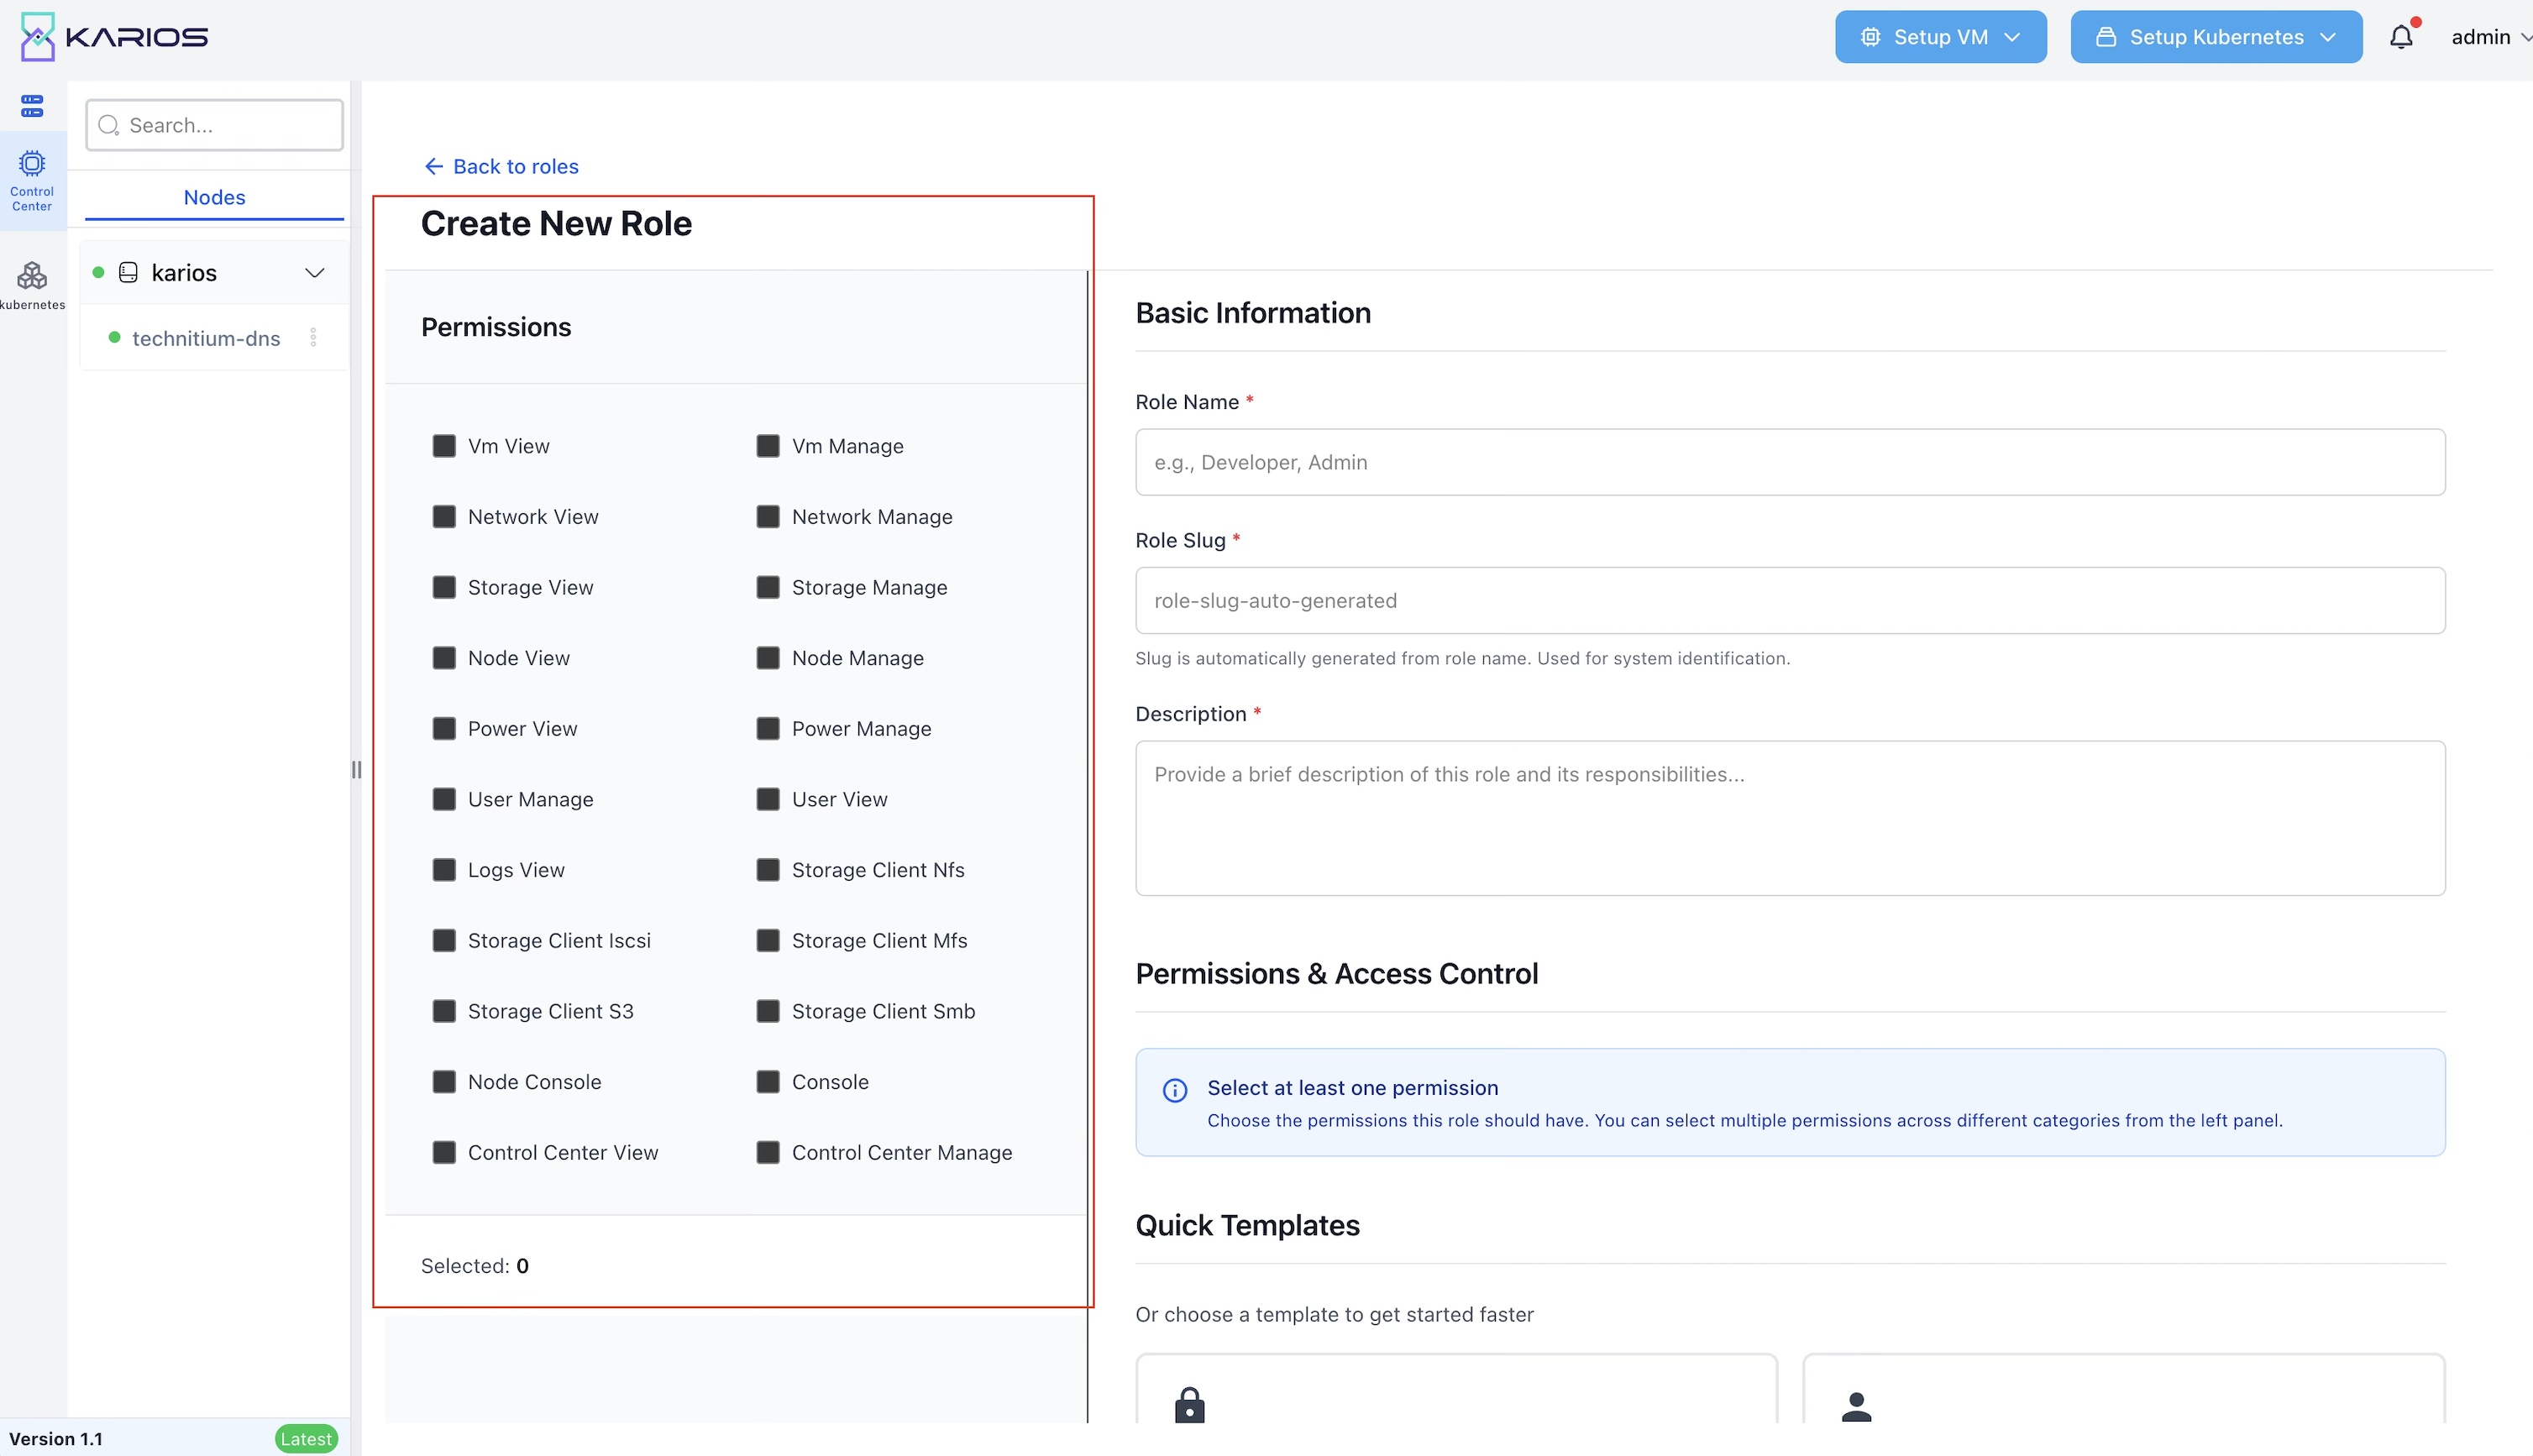
Figure : Create Role Interface
Step 2: Define Role Properties
Name: Human-readable role name (e.g., “Storage Admin”, “Network Admin”) Role Slug: System identifier for the role (auto-generated or custom) Description: Detailed explanation of role purpose and responsibilities
Step 3: Permission Assignment
The interface provides a comprehensive checkbox grid with all available permissions:
Infrastructure Permissions
VM_VIEW / VM_MANAGE: Virtual machine visibility and control
NETWORK_VIEW / NETWORK_MANAGE: Network infrastructure access
STORAGE_VIEW / STORAGE_MANAGE: Storage system administration
NODE_VIEW / NODE_MANAGE: Physical node management
Specialized System Permissions
NETBOX_VIEW / NETBOX_MANAGE: Network documentation system
POWER_VIEW / POWER_MANAGE: Power management system
USER_MANAGE / USER_VIEW: User account administration
LOGS_VIEW: System logging access
Storage Client Permissions
STORAGE_CLIENT_ISCSI: iSCSI protocol access
STORAGE_CLIENT_MFS: MooseFS distributed storage
STORAGE_CLIENT_S3: S3-compatible object storage
STORAGE_CLIENT_SEAWEED: SeaweedFS storage system
STORAGE_CLIENT_SMB: SMB/CIFS file sharing
System Access Permissions
NODE_CONSOLE: Physical node console access
CONSOLE: System console access
CONTROL_CENTER_VIEW / CONTROL_CENTER_MANAGE: Management interface access
COOLING_VIEW / COOLING_MANAGE: Cooling system management
Select the appropriate permissions and click “create” to finalize the role.
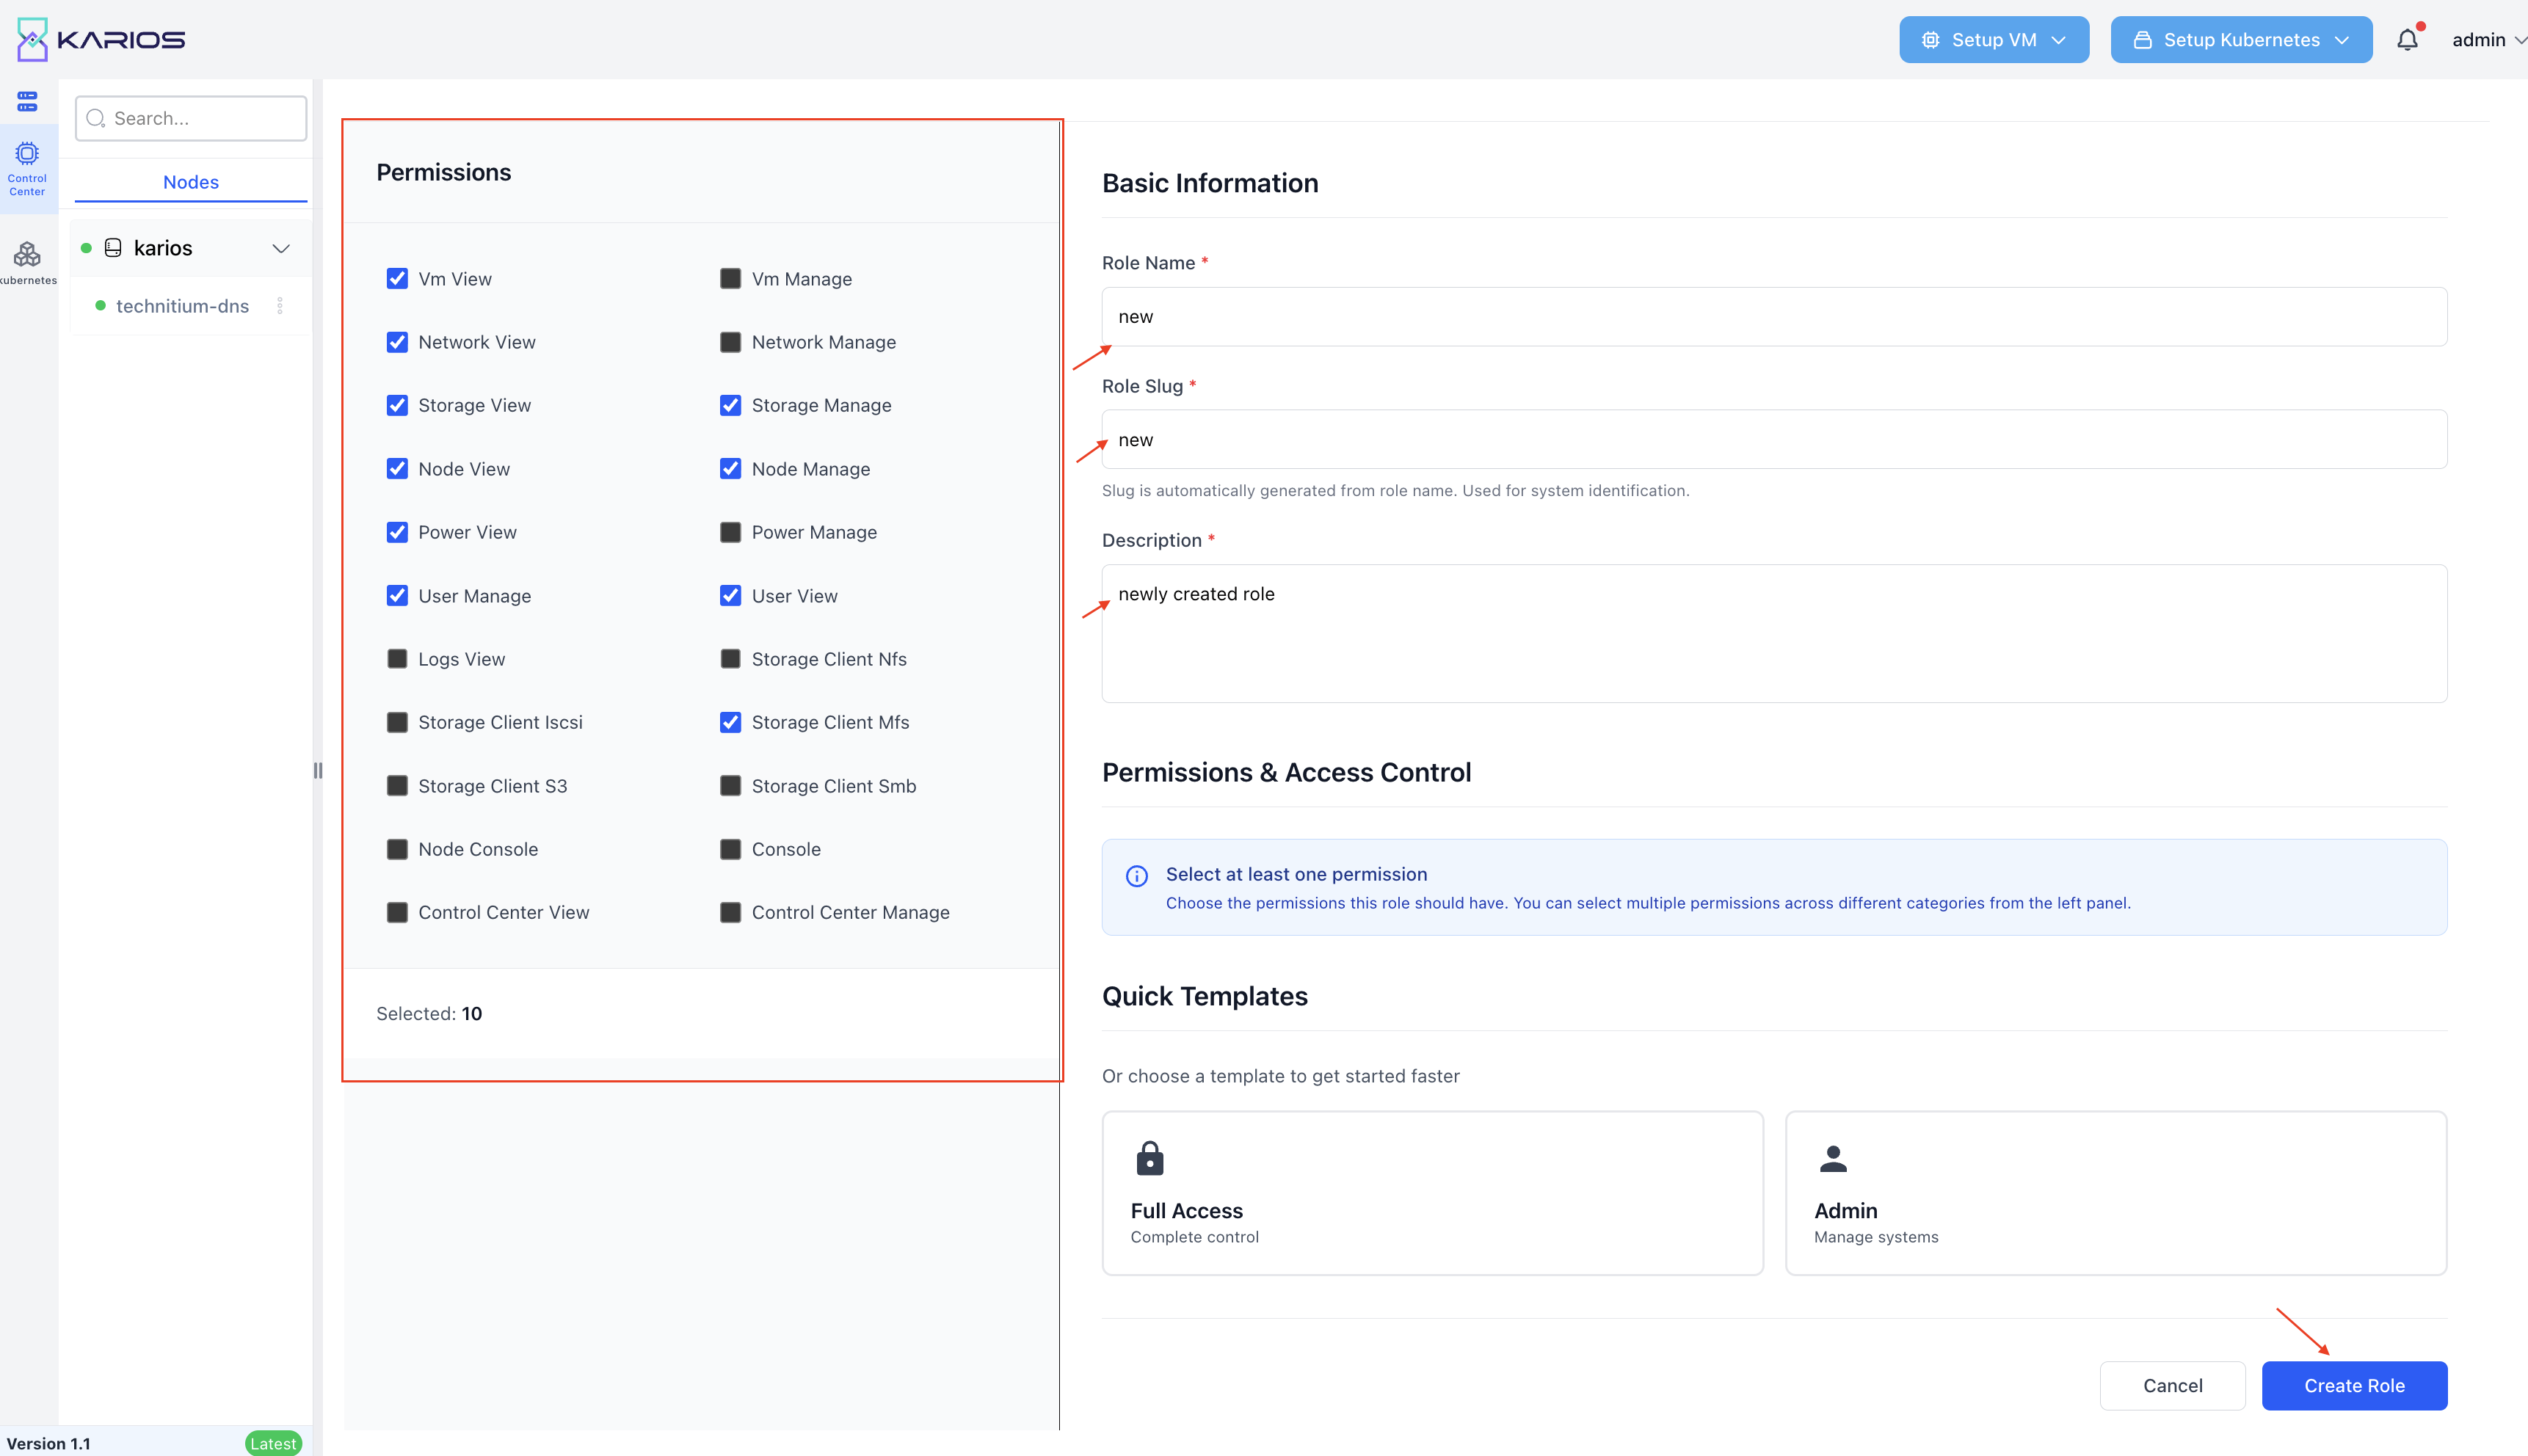
Figure : Permission Grid
Predefined Roles Display
The interface shows all existing roles with their current configuration:
System Roles
System Admin: Complete administrative access
VM Admin: Virtual machine management focus
Network Admin: Network infrastructure specialization
Storage Admin: Storage system administration
Node Admin: Physical infrastructure management
Power Admin: Power system management
Cooling Admin: Thermal management system
Netbox Admin: Network documentation management
ReadOnly User: Comprehensive read-only access
Custom Roles
Additional custom roles created for specific organizational needs.
Role Actions
Edit: Modify existing role permissions and properties
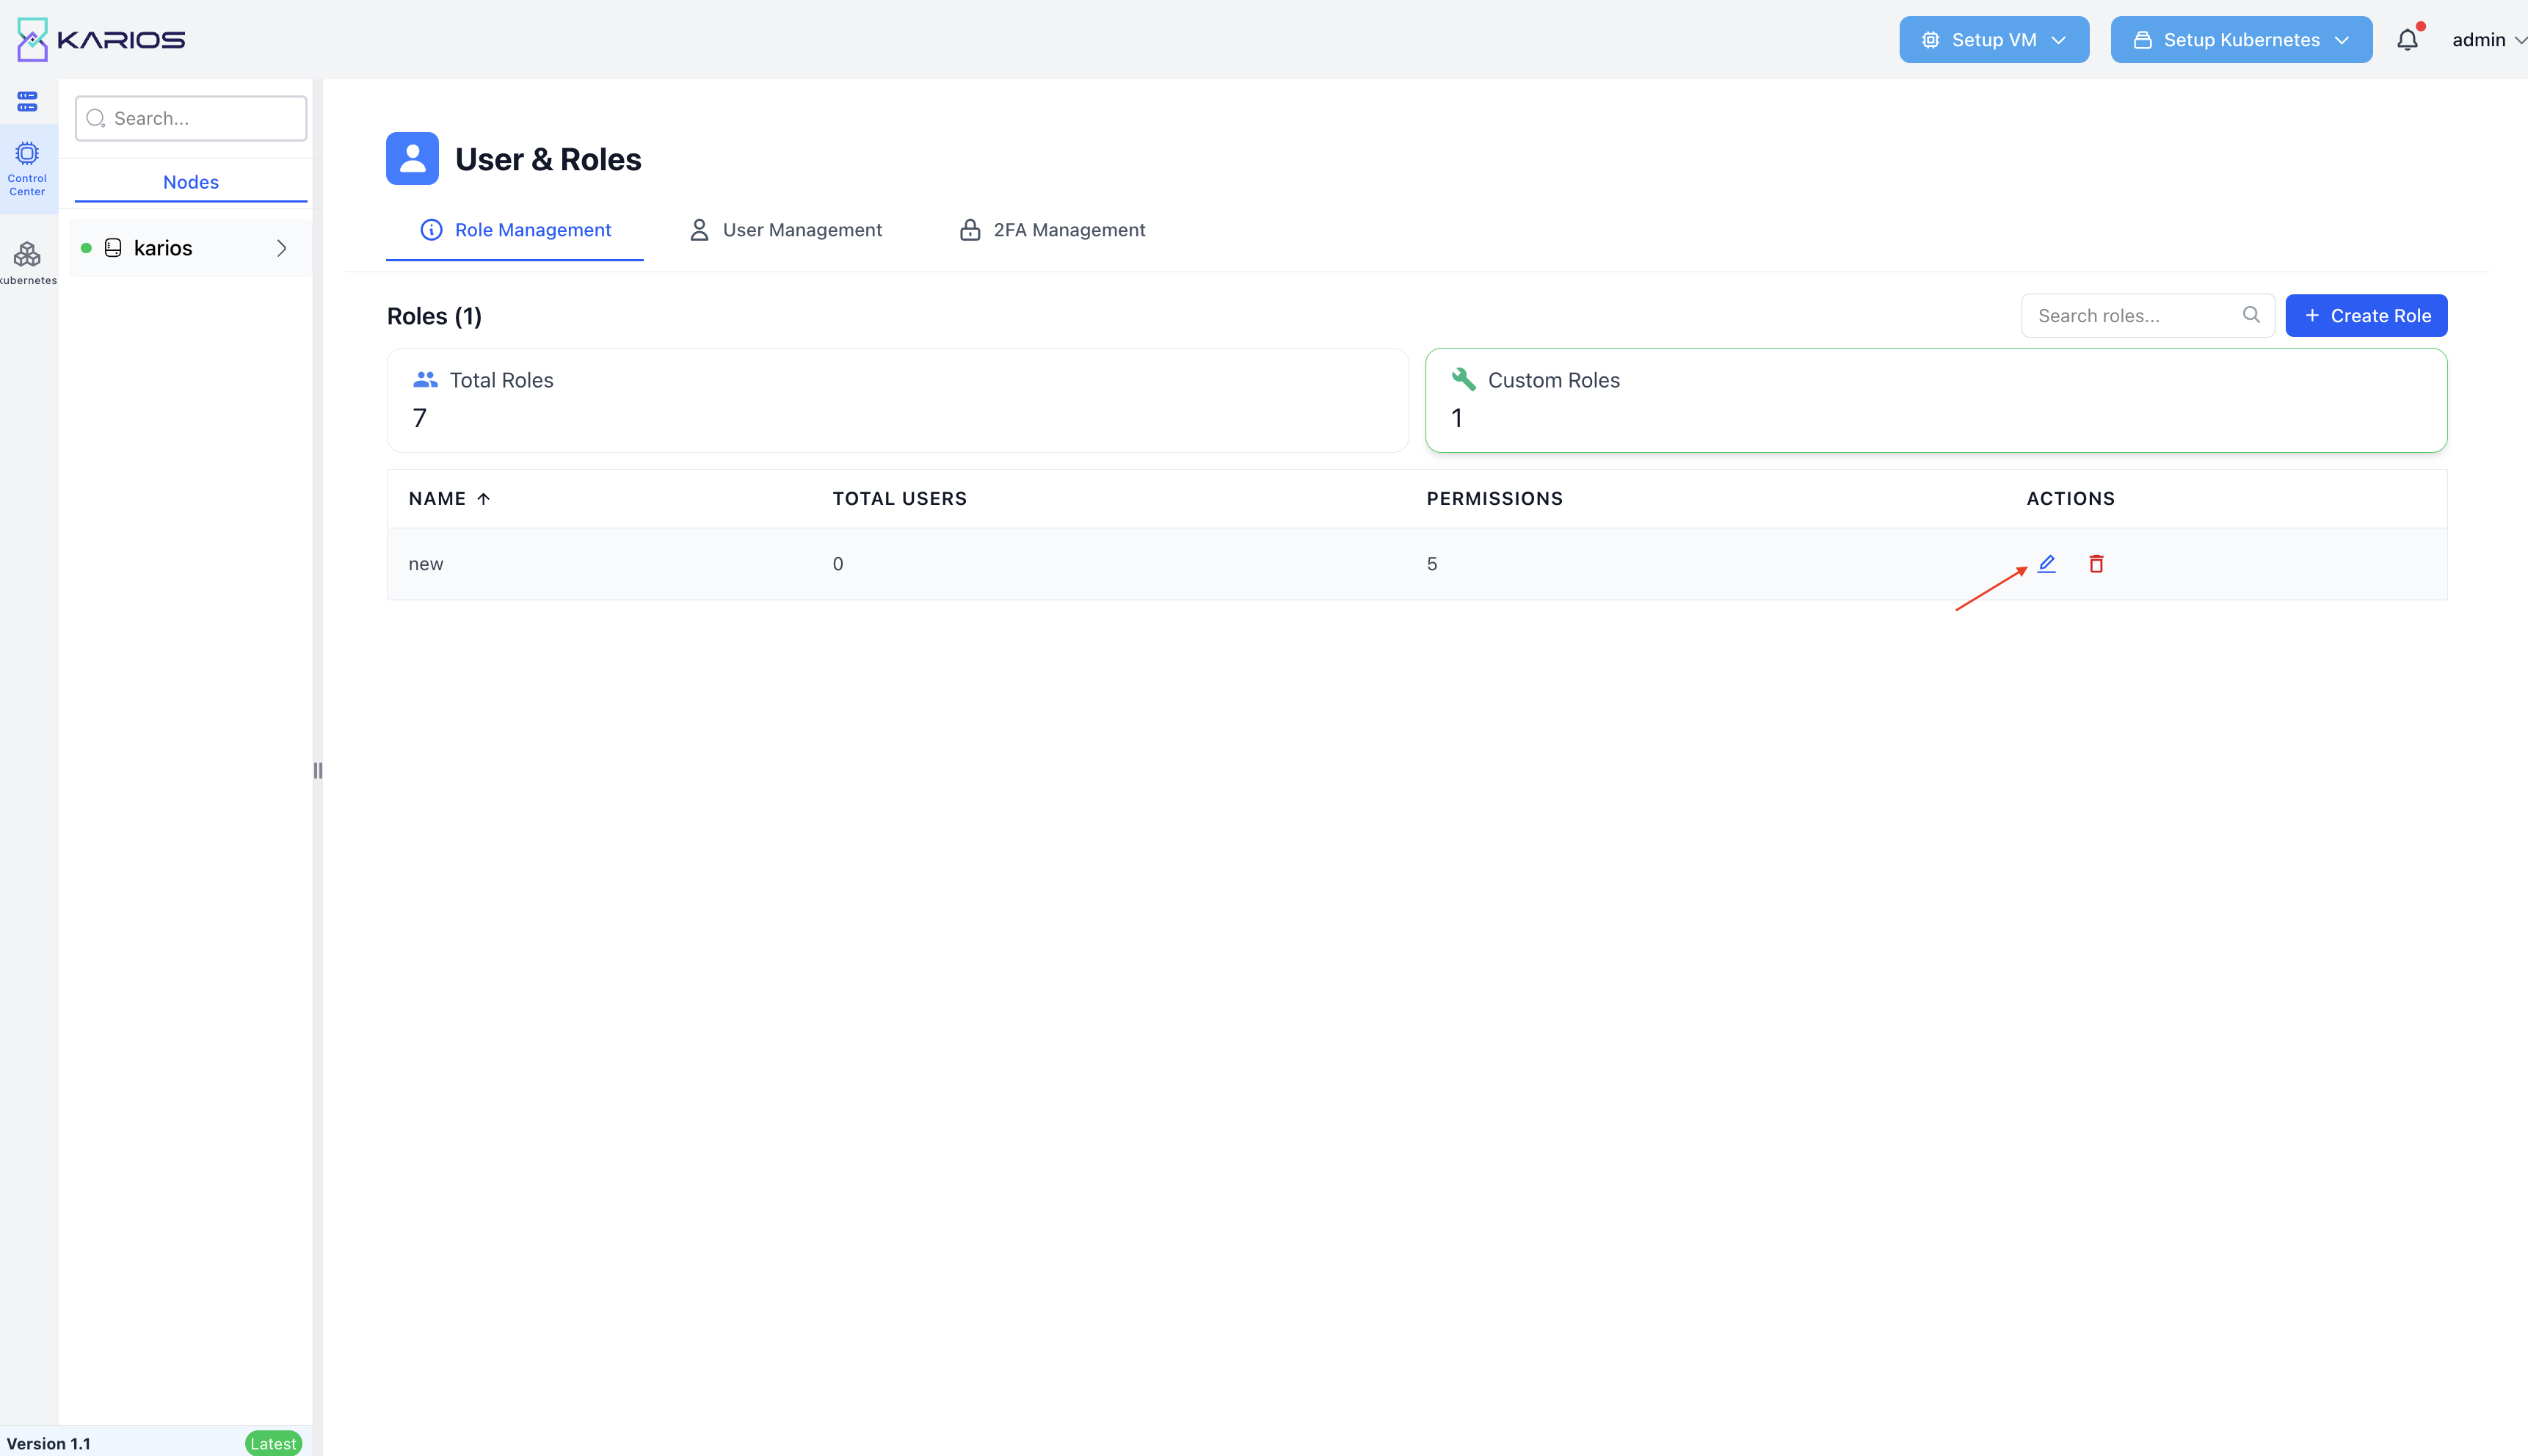
Figure : Edit Role Interface
Delete: Remove custom roles (predefined roles cannot be deleted)
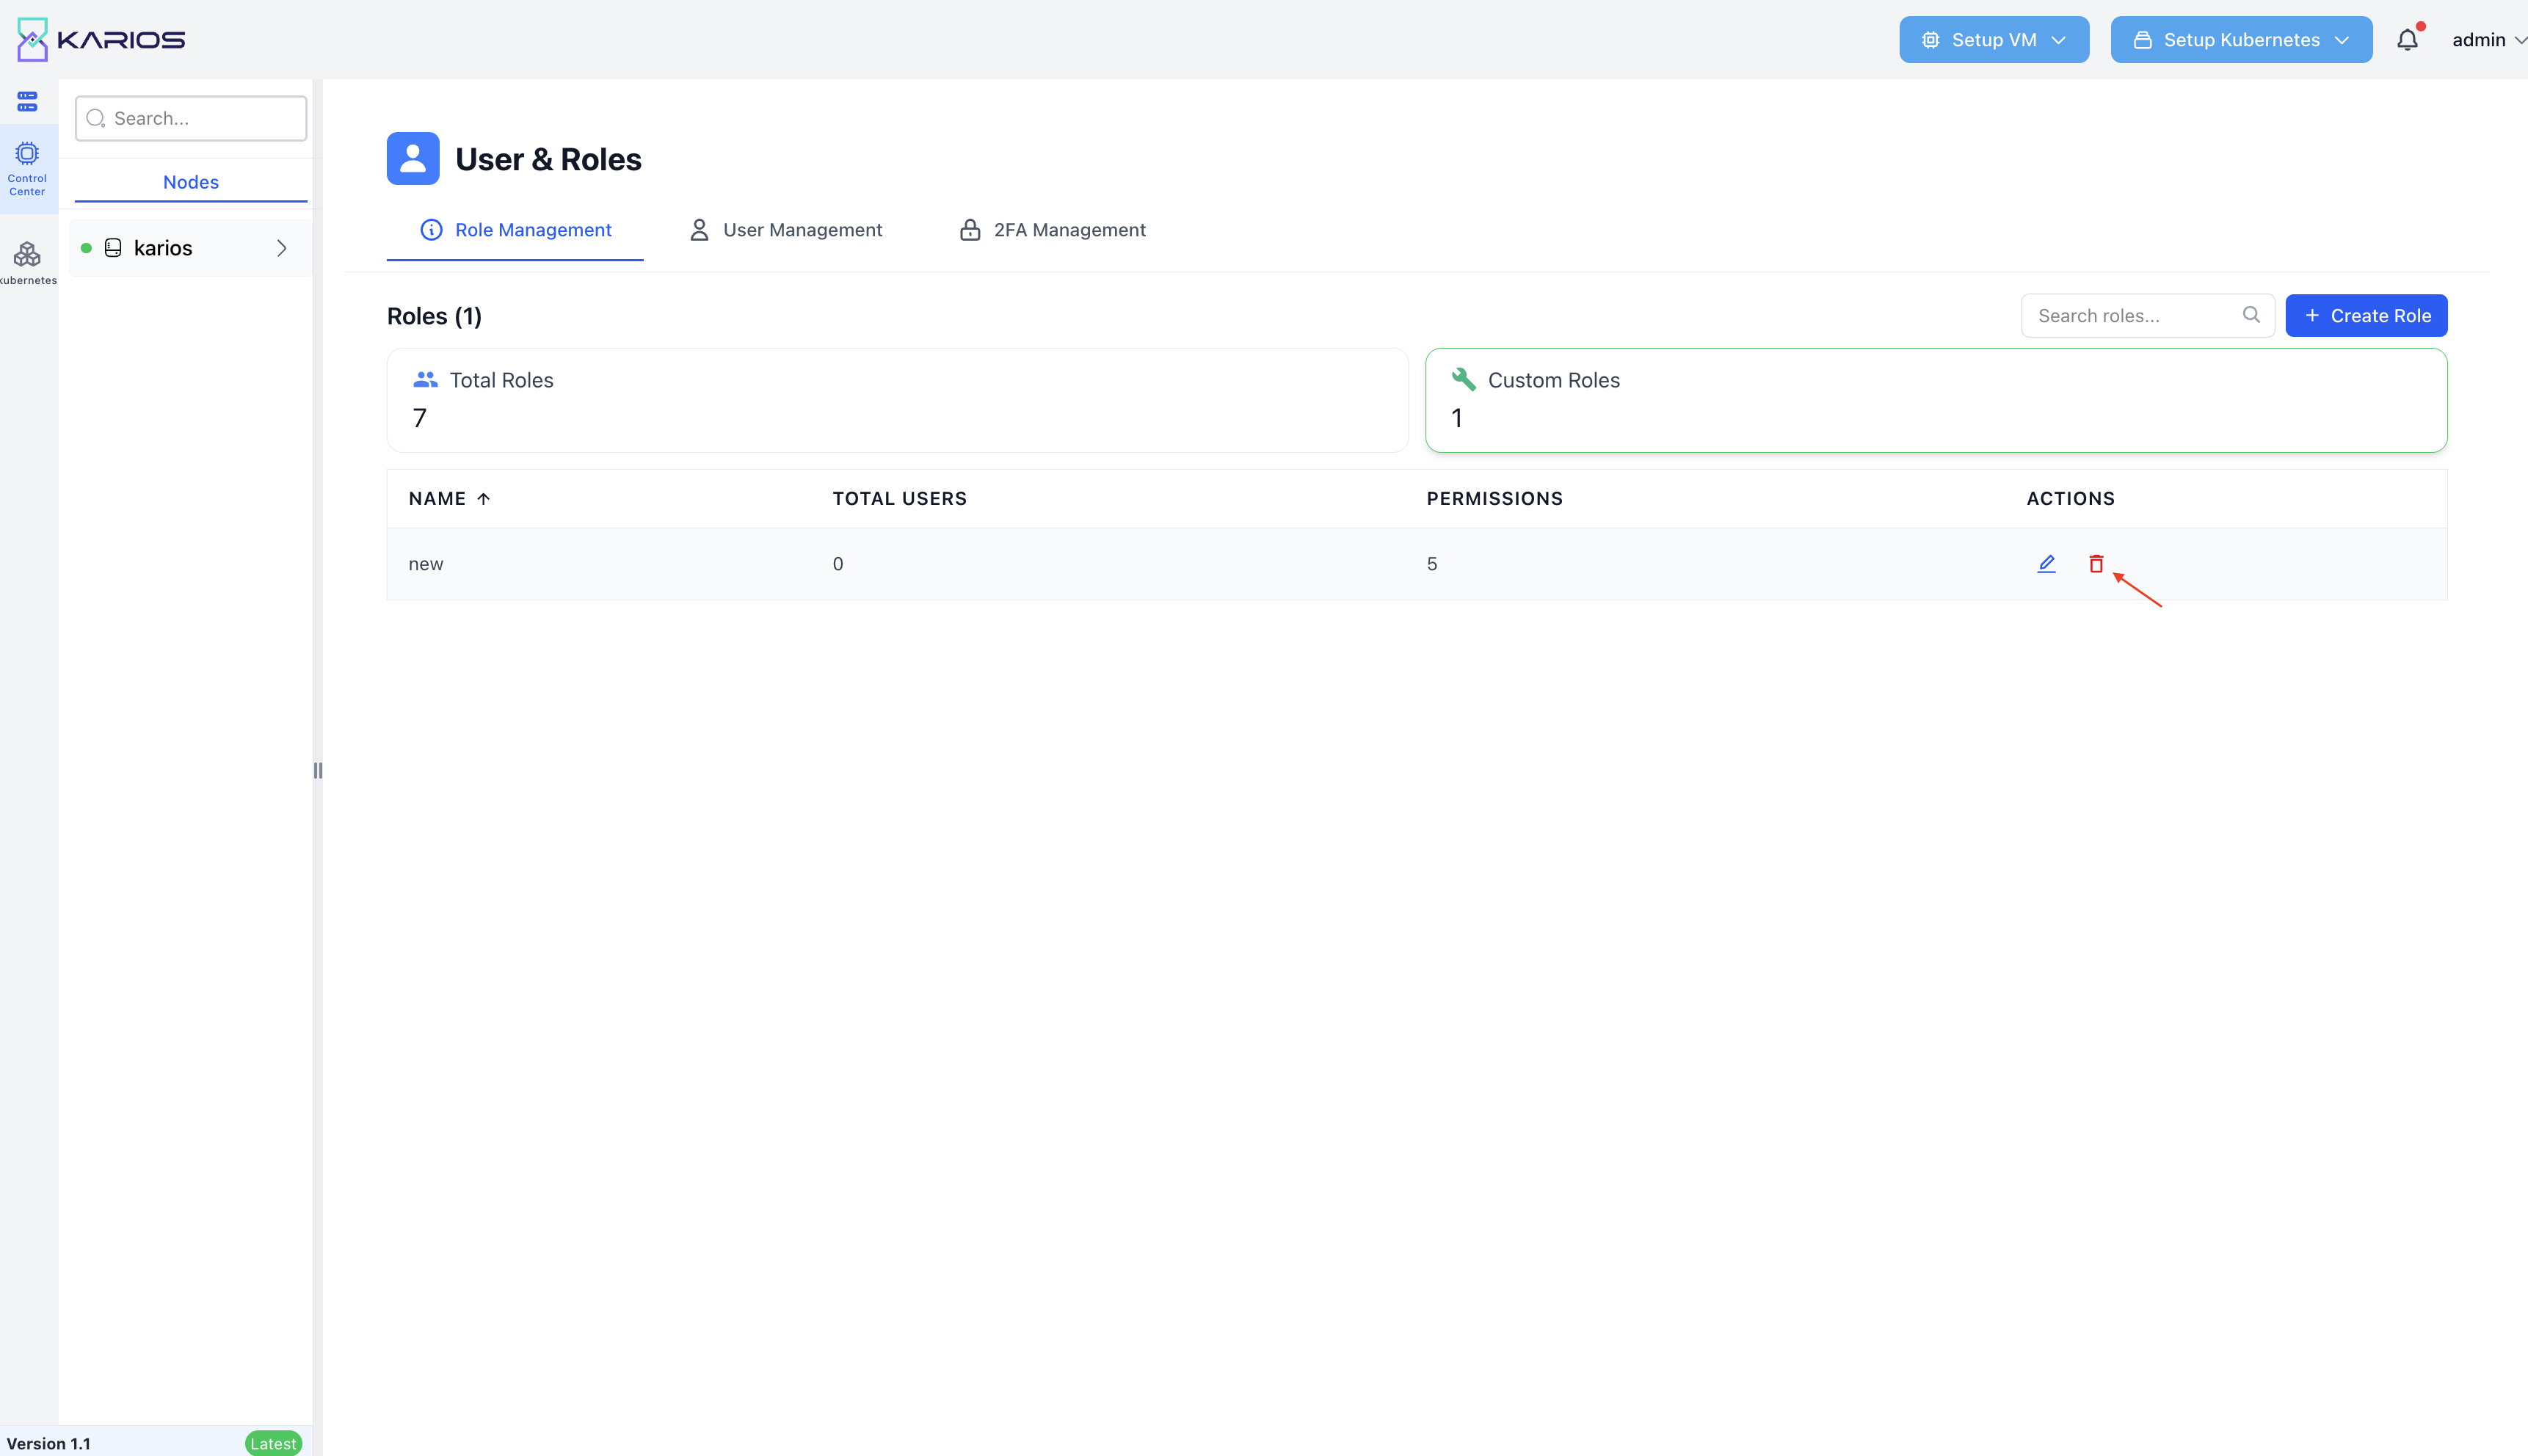
Figure : Delete Role Confirmation
User Registration Process
Step 1: Access User Management
Navigate to admin dropdown → “User Management”
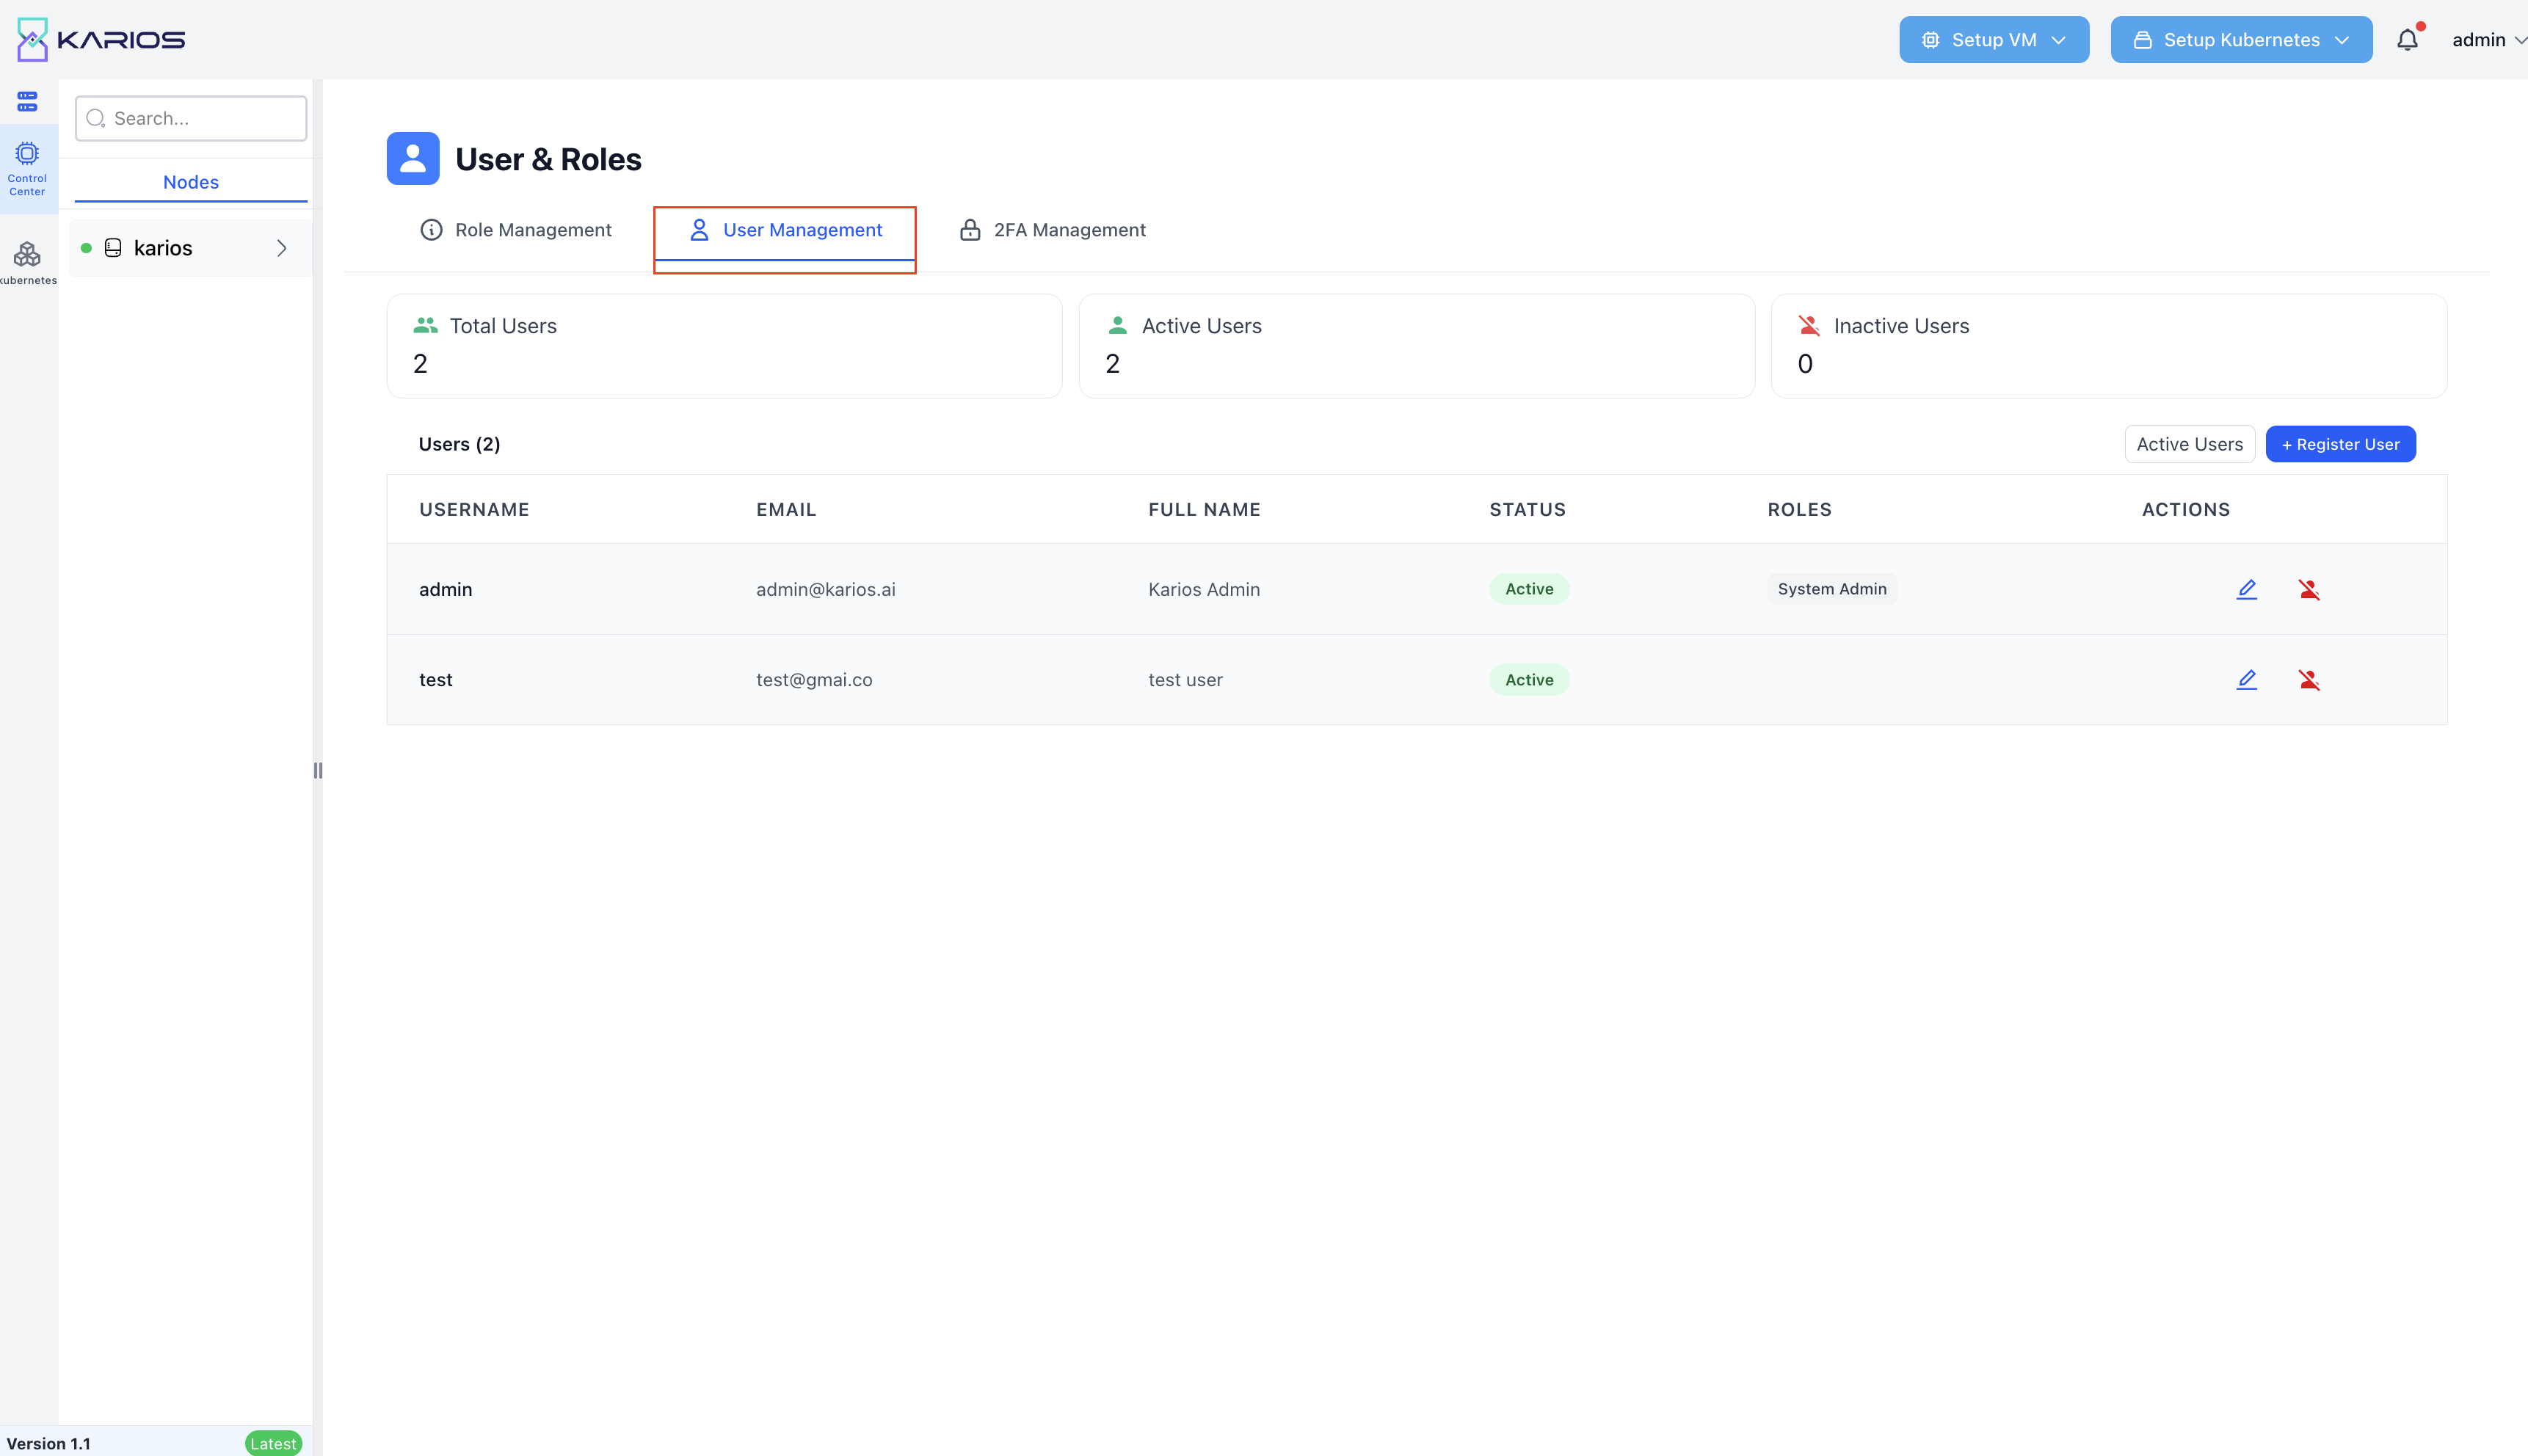
Figure : Navigate to User Management
Click “Register User” button to create new user accounts
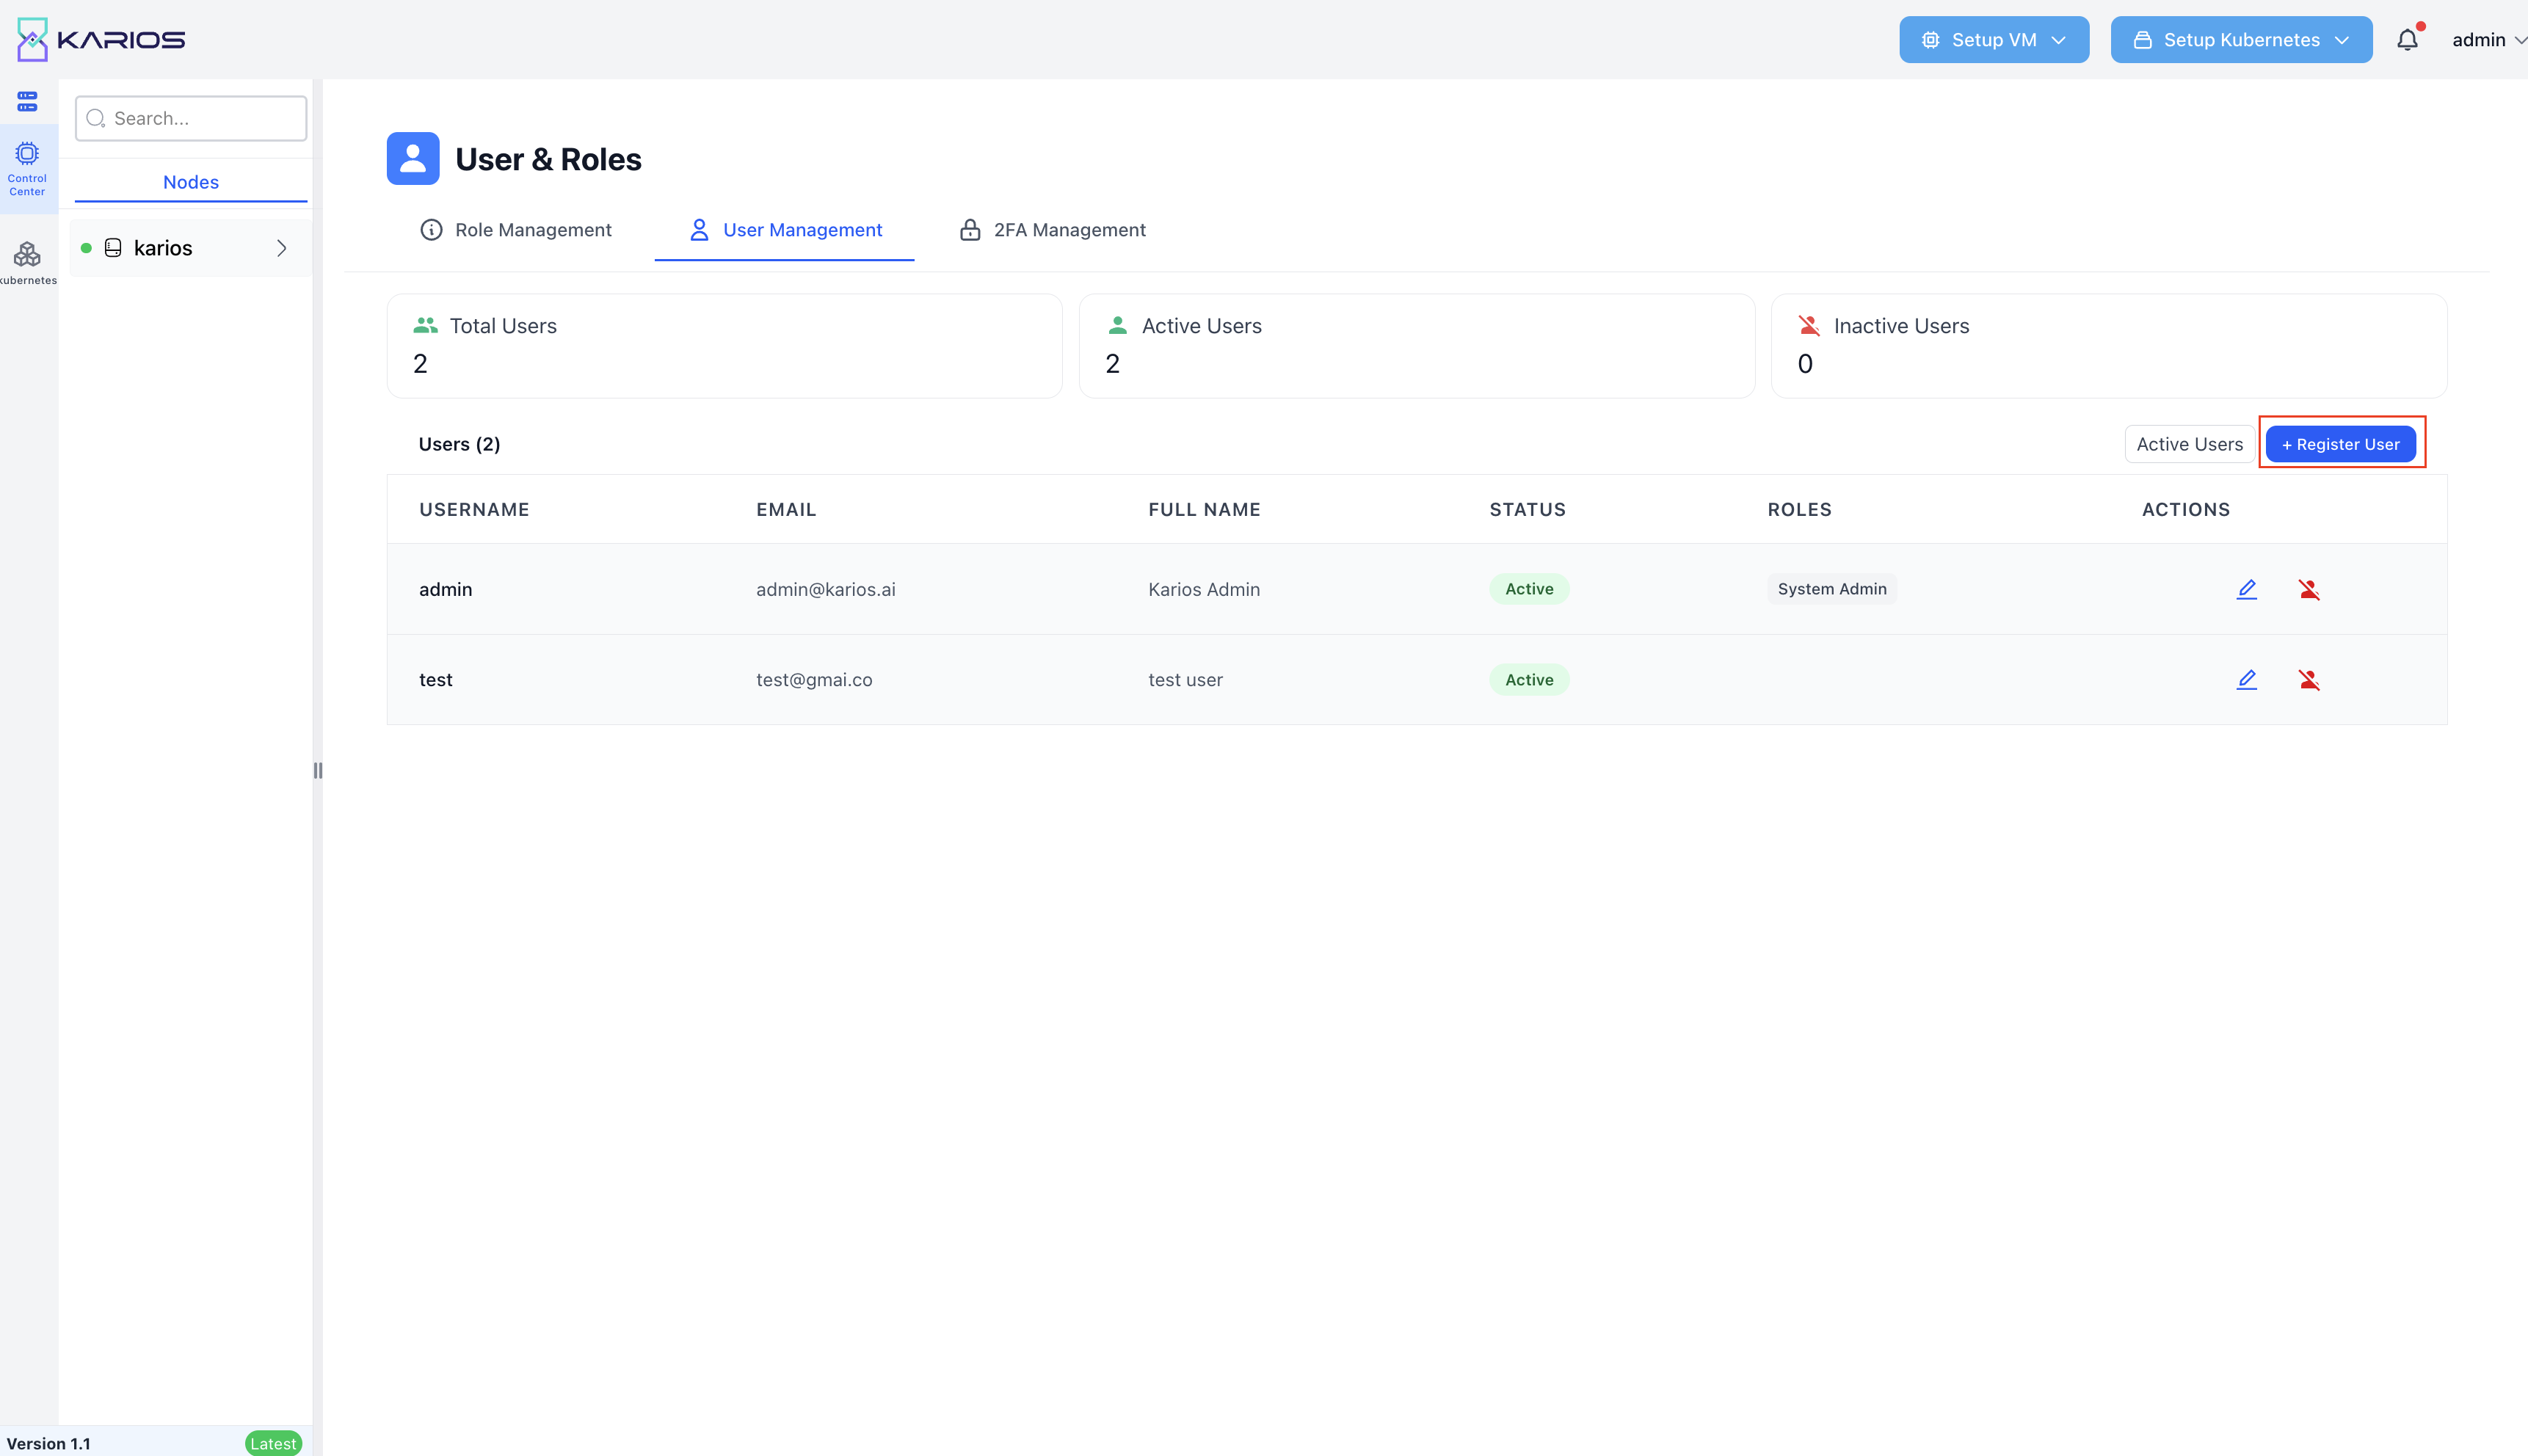
Figure : Register User Interface
Step 2: User Information Entry
The registration dialog requires comprehensive user information:
Username: Unique system identifier for the user
Email: Primary email address for notifications and communications
First Name: User’s given name for identification
Last Name: User’s last name for complete identification
Password: Secure password meeting complexity requirements (8+ characters, 1 number, 1 uppercase, 1 special character)
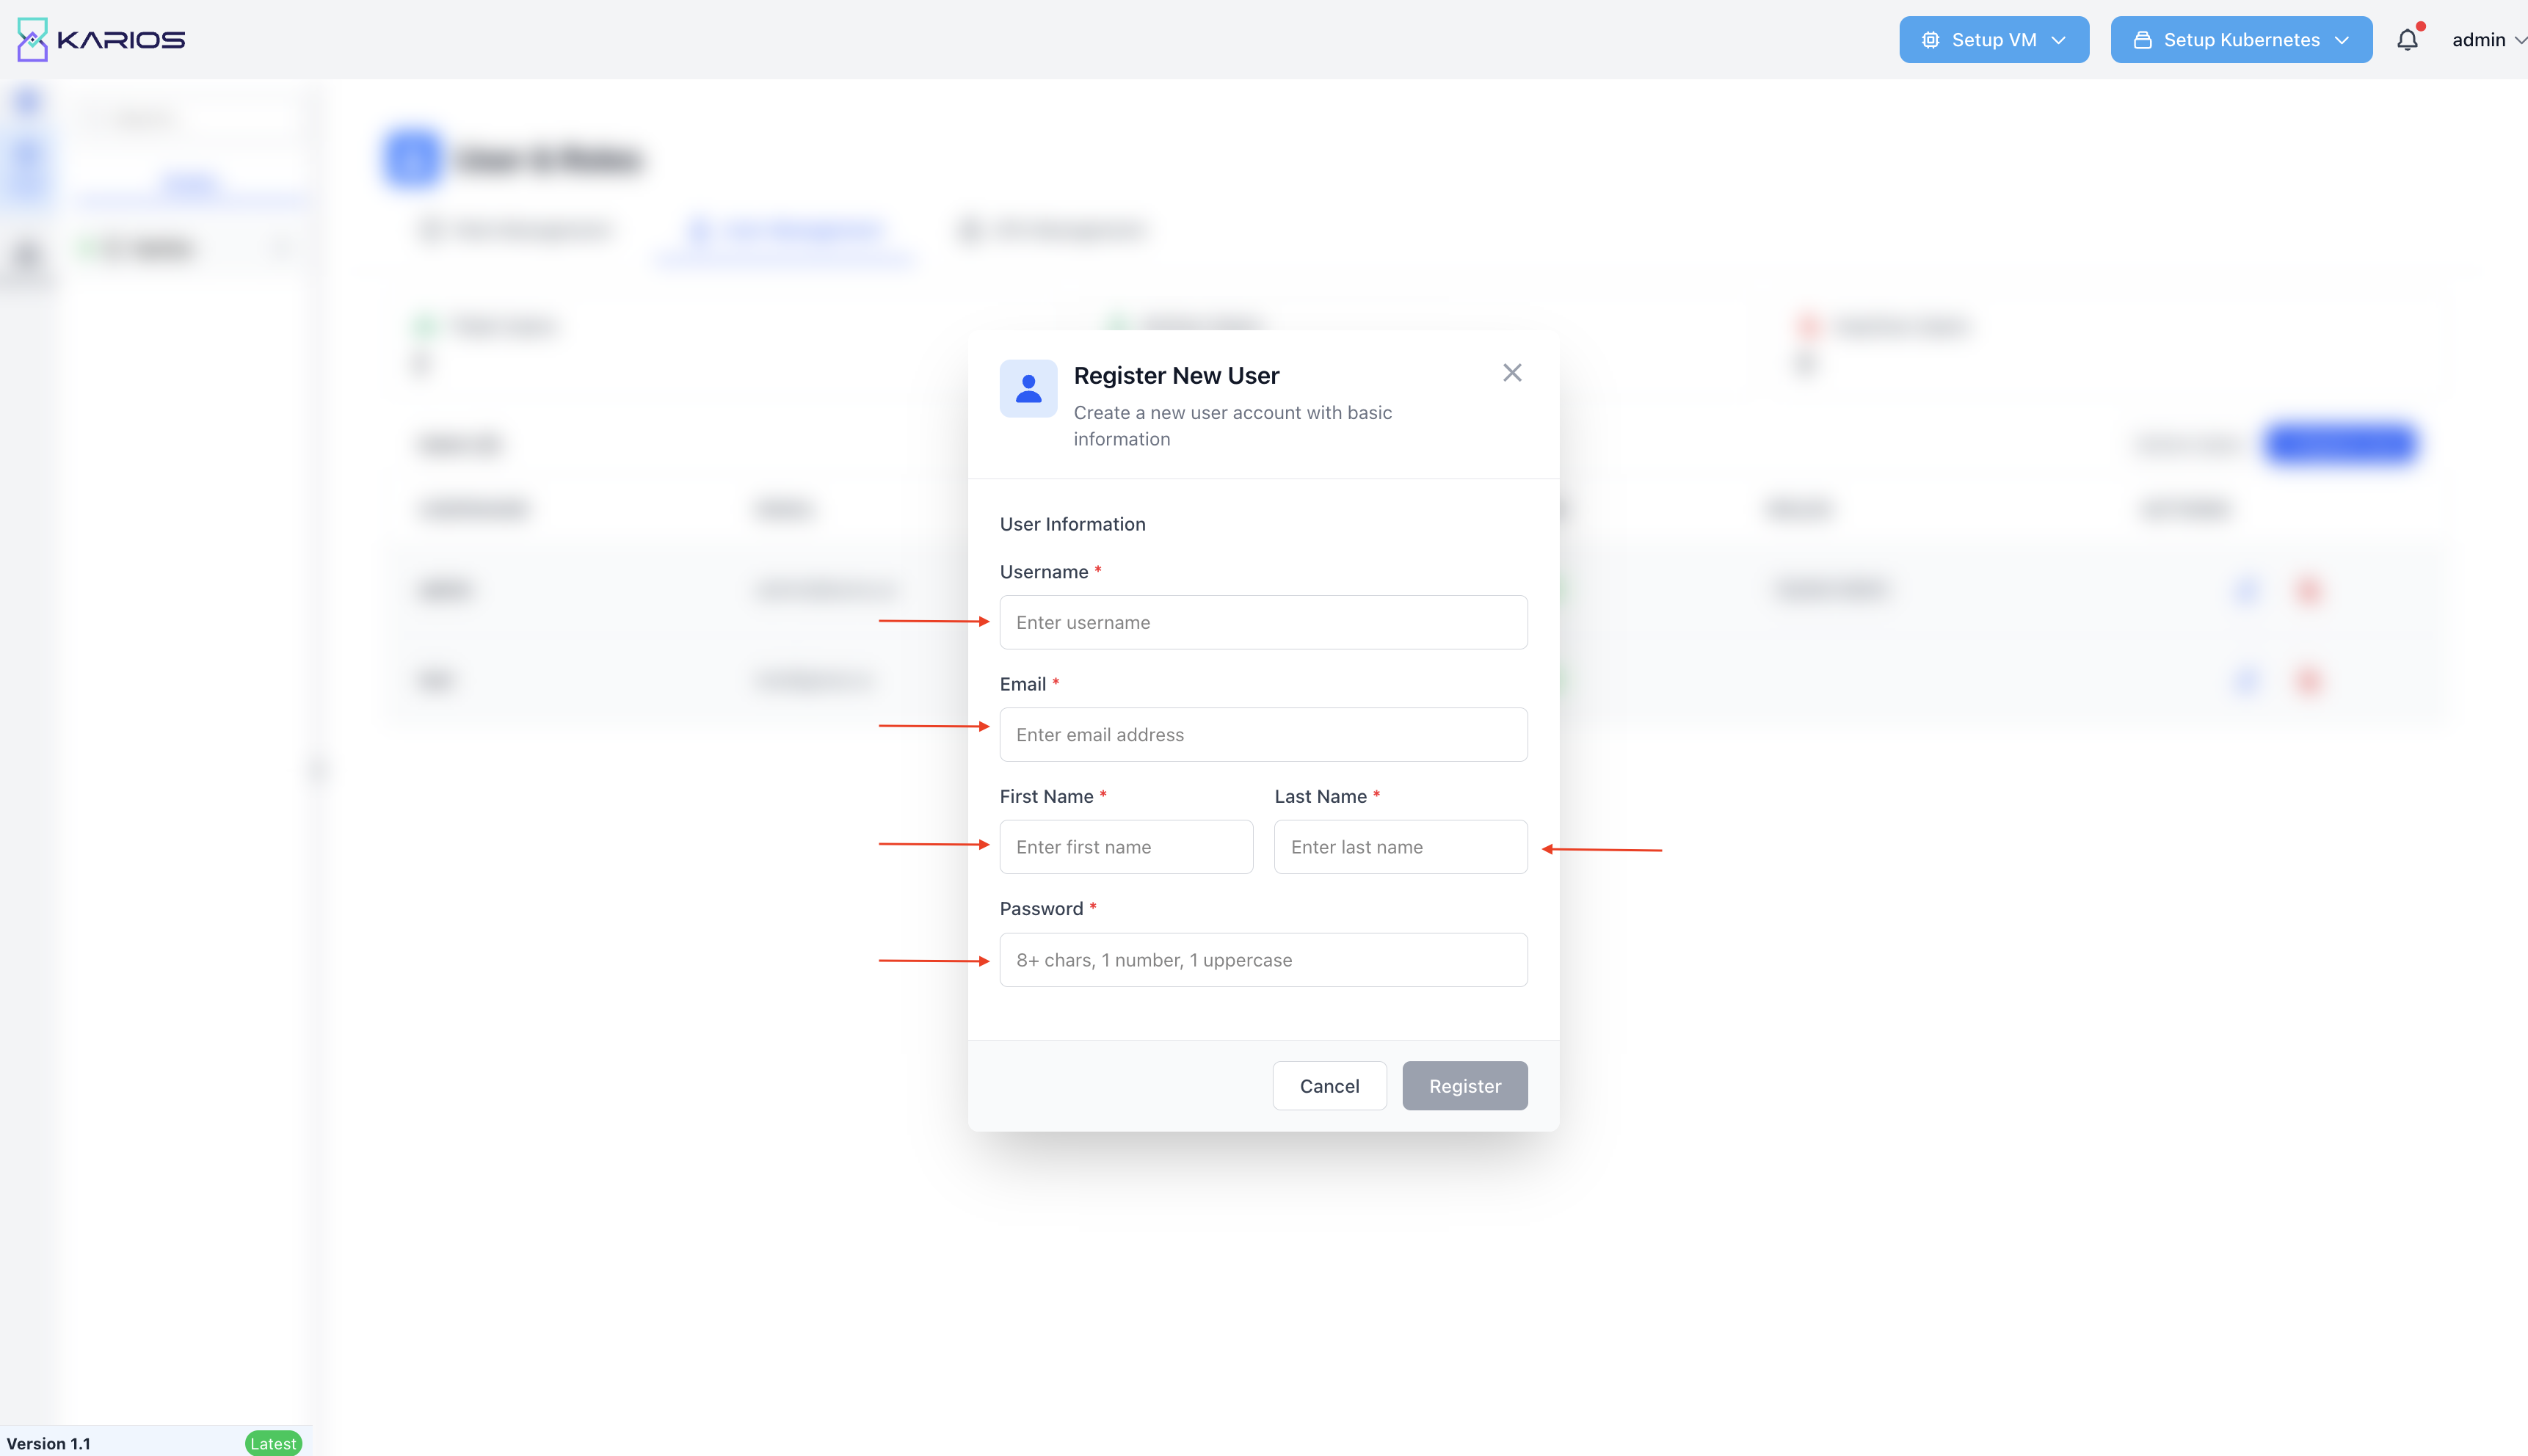
Figure : User Registration Form
User Account Management
User Status Management
The interface provides comprehensive user account oversight:
Account Status Types
Active: User account is functional and can access the system
Inactive: User account is disabled and cannot authenticate
Role Assignment Display
Each user shows their currently assigned role:
System Admin: Complete administrative privileges
ReadOnly User: View-only access across all systems
Custom Roles: Specialized roles created for specific requirements
Approval Workflow Management
Approval Required: Some users require administrative approval before activation
Approvers: Designated users who can approve account activation
No approval required: Users who can be immediately activated
Role Assignment Strategies
Full Access Implementation
Method 1: System Admin Role Assignment
Navigate to User Management interface
Locate the target user account
Click “Edit” on the user’s row
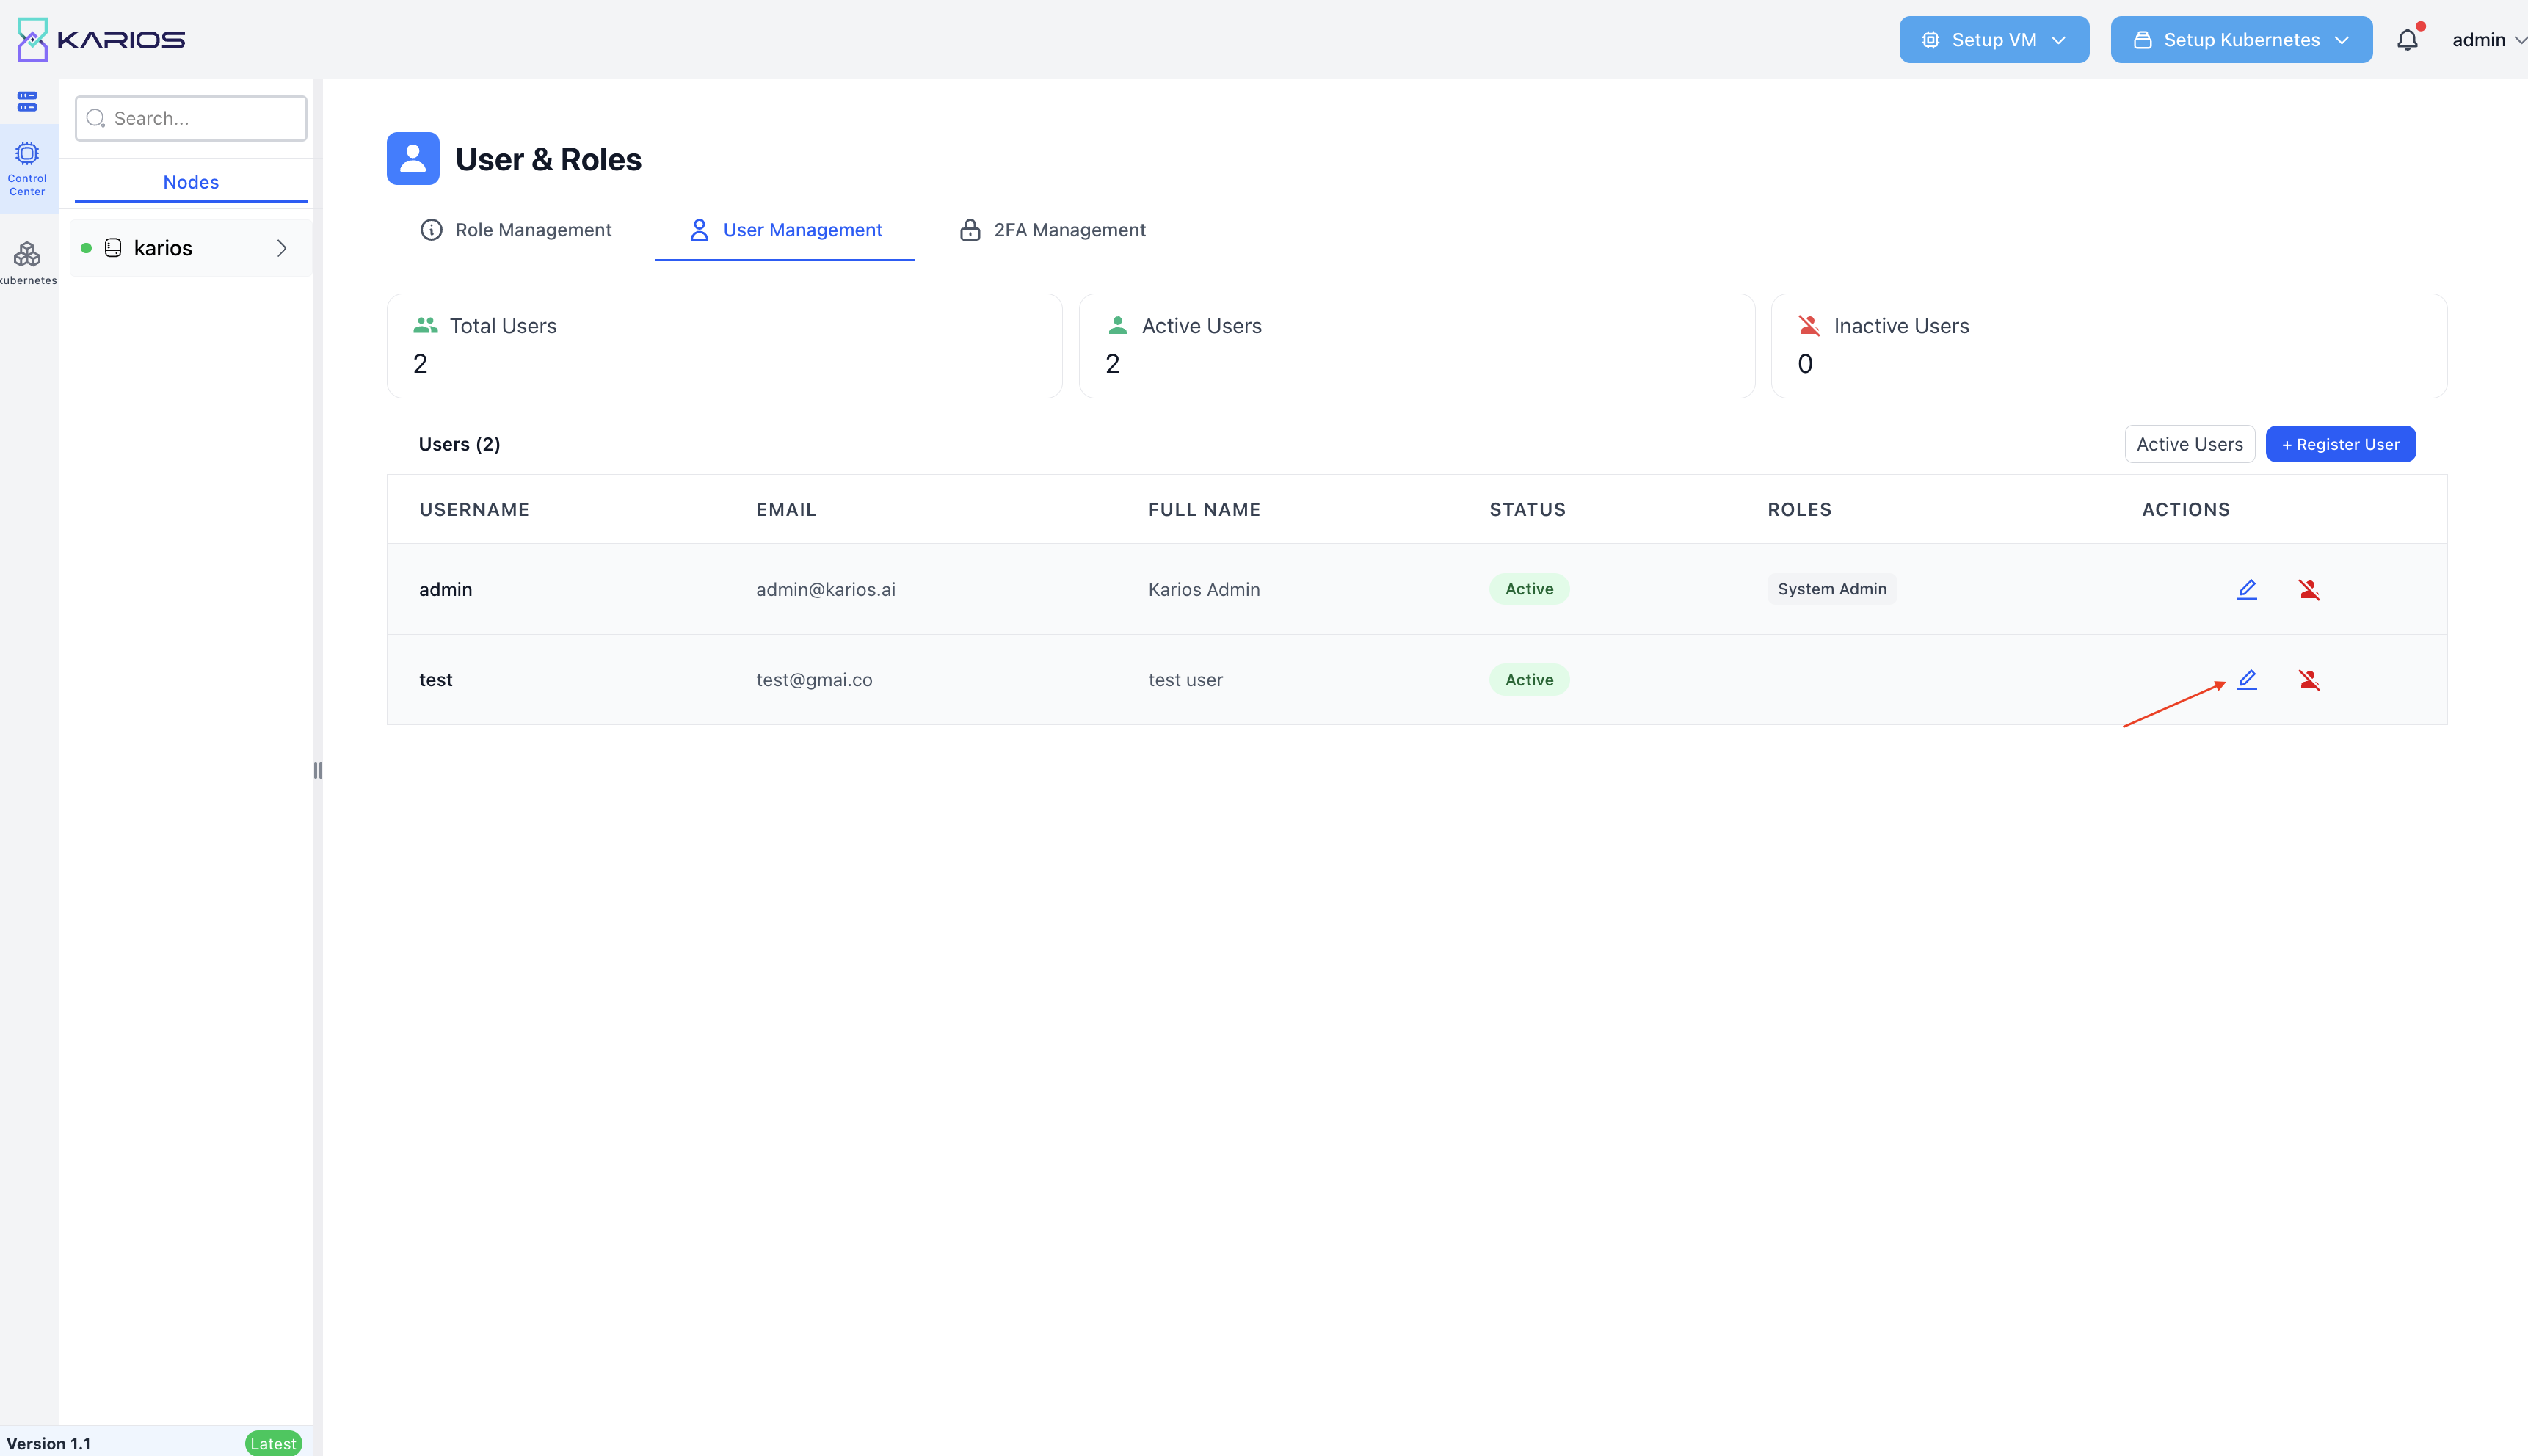
Figure : Edit User Interface
Click assign role button.
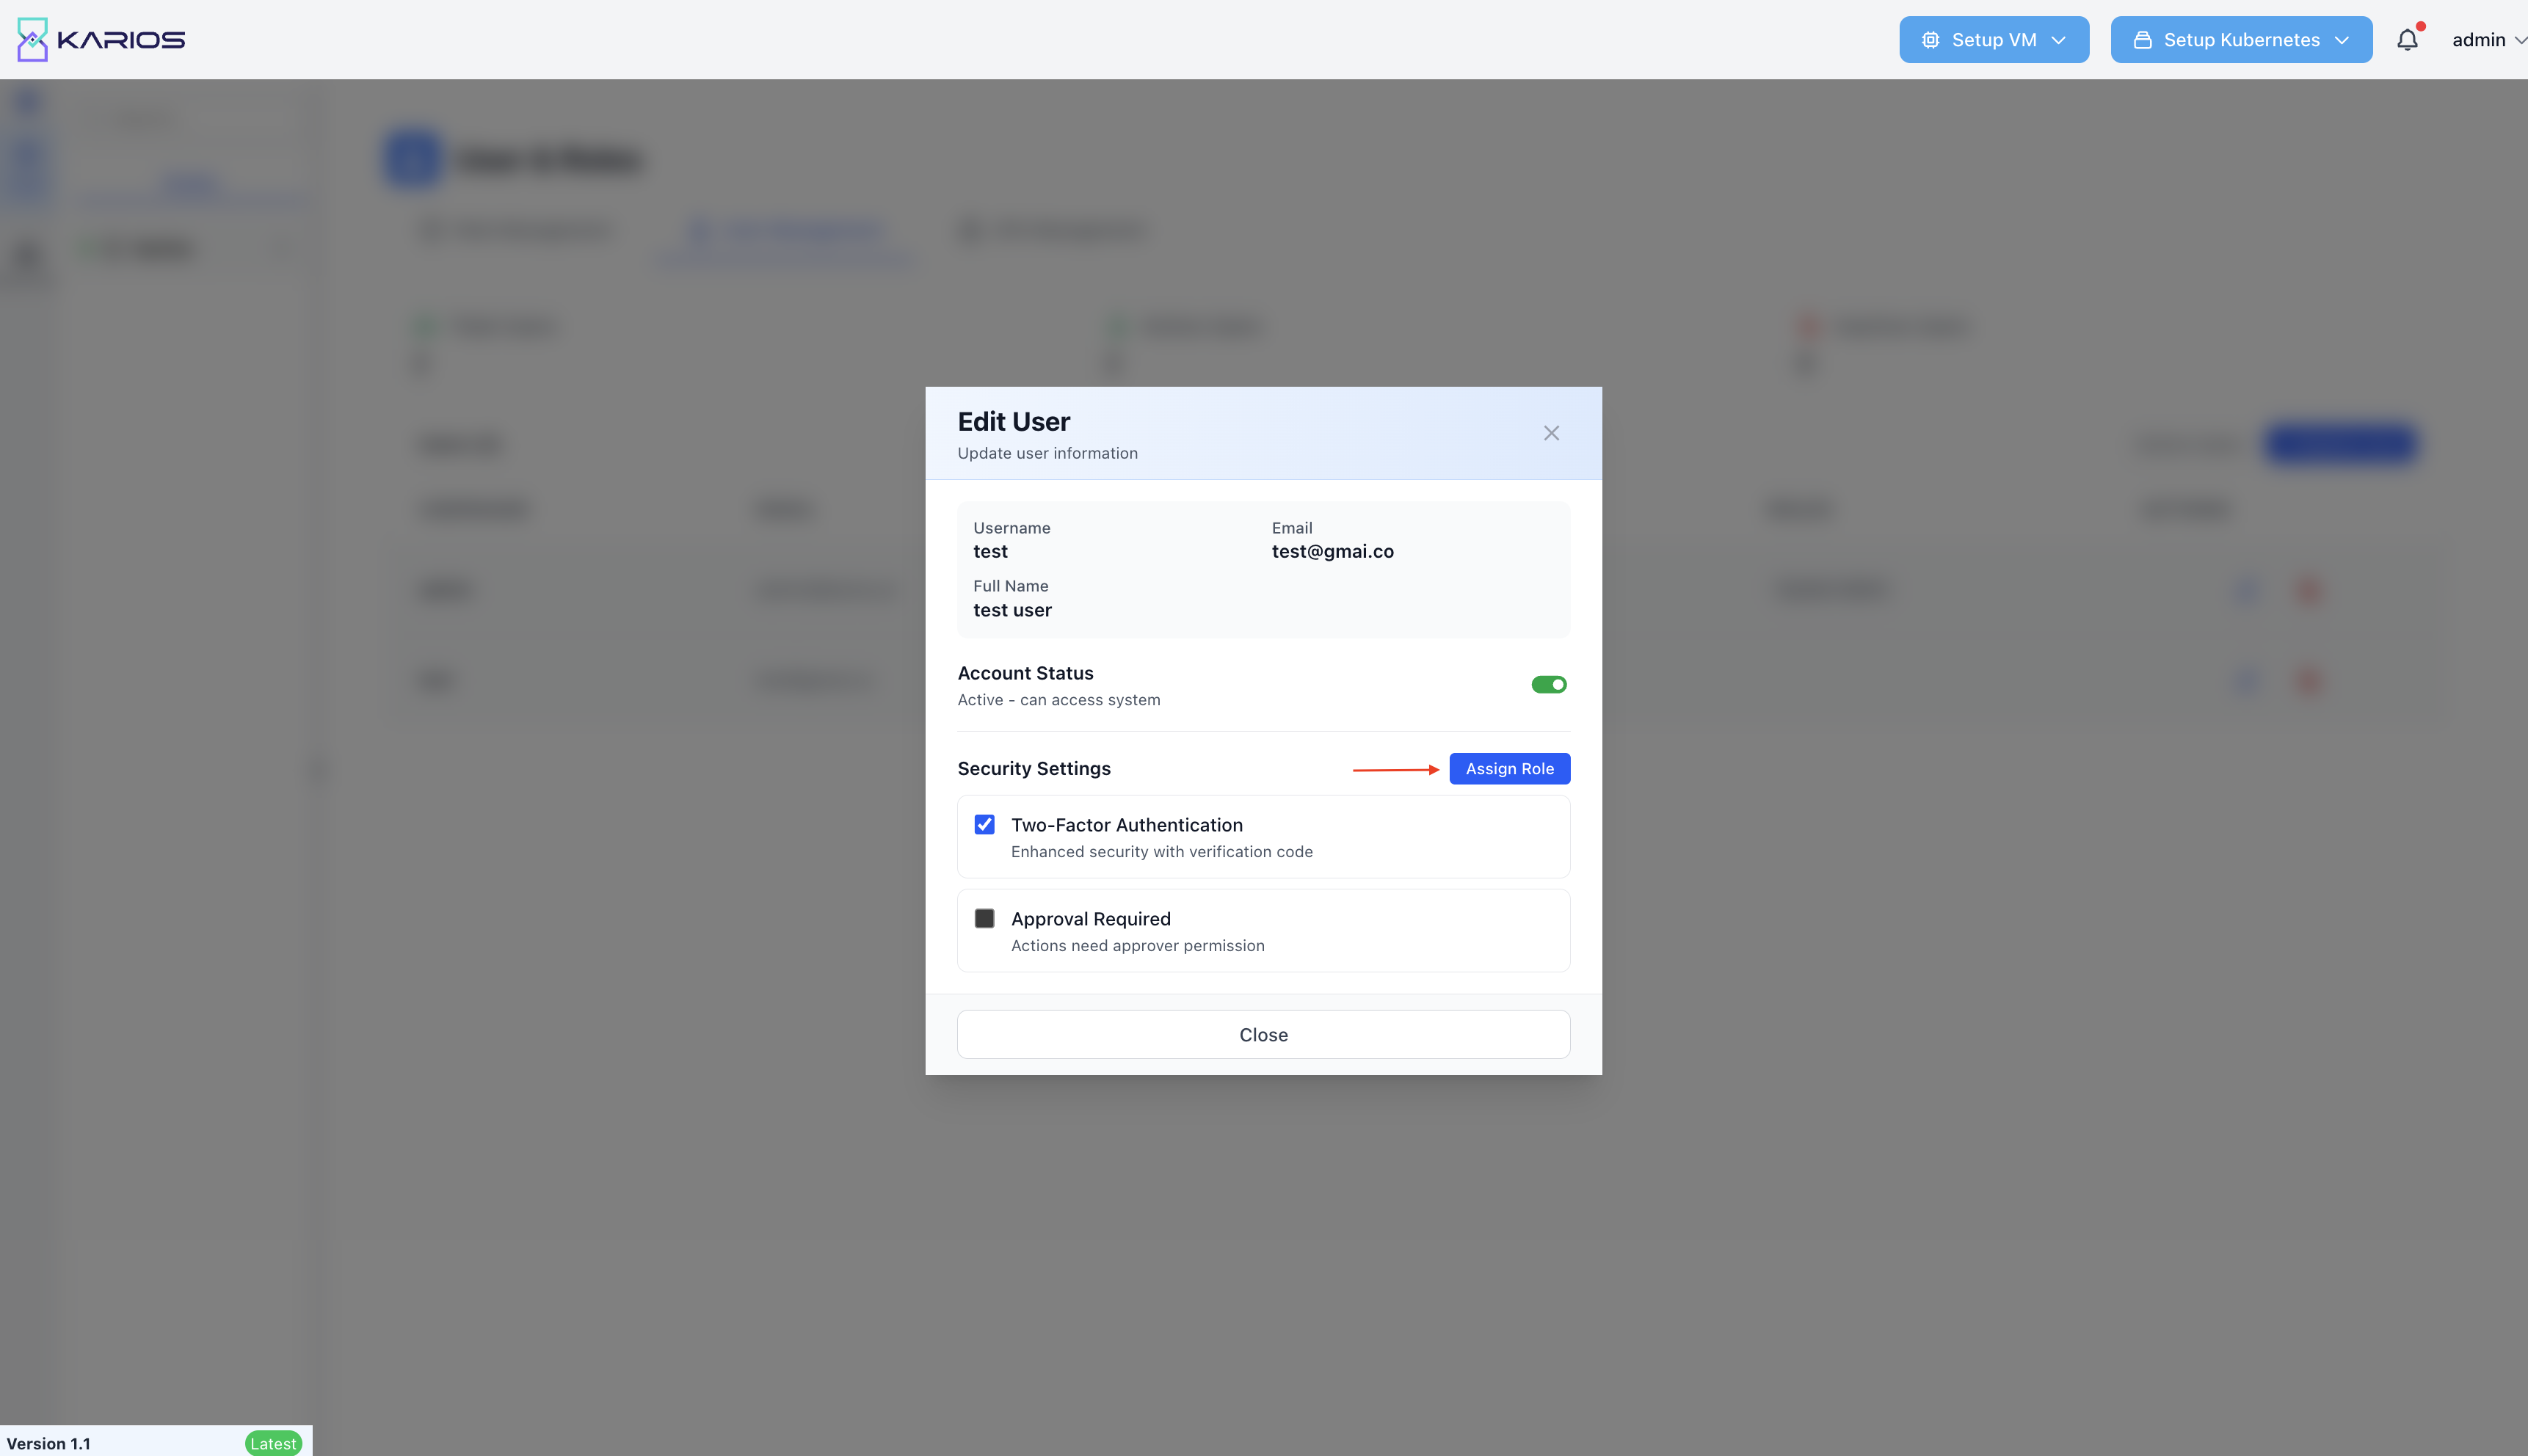
Figure : Assign System Admin Role
Change role assignment to “System Admin” and save changes to grant complete system access
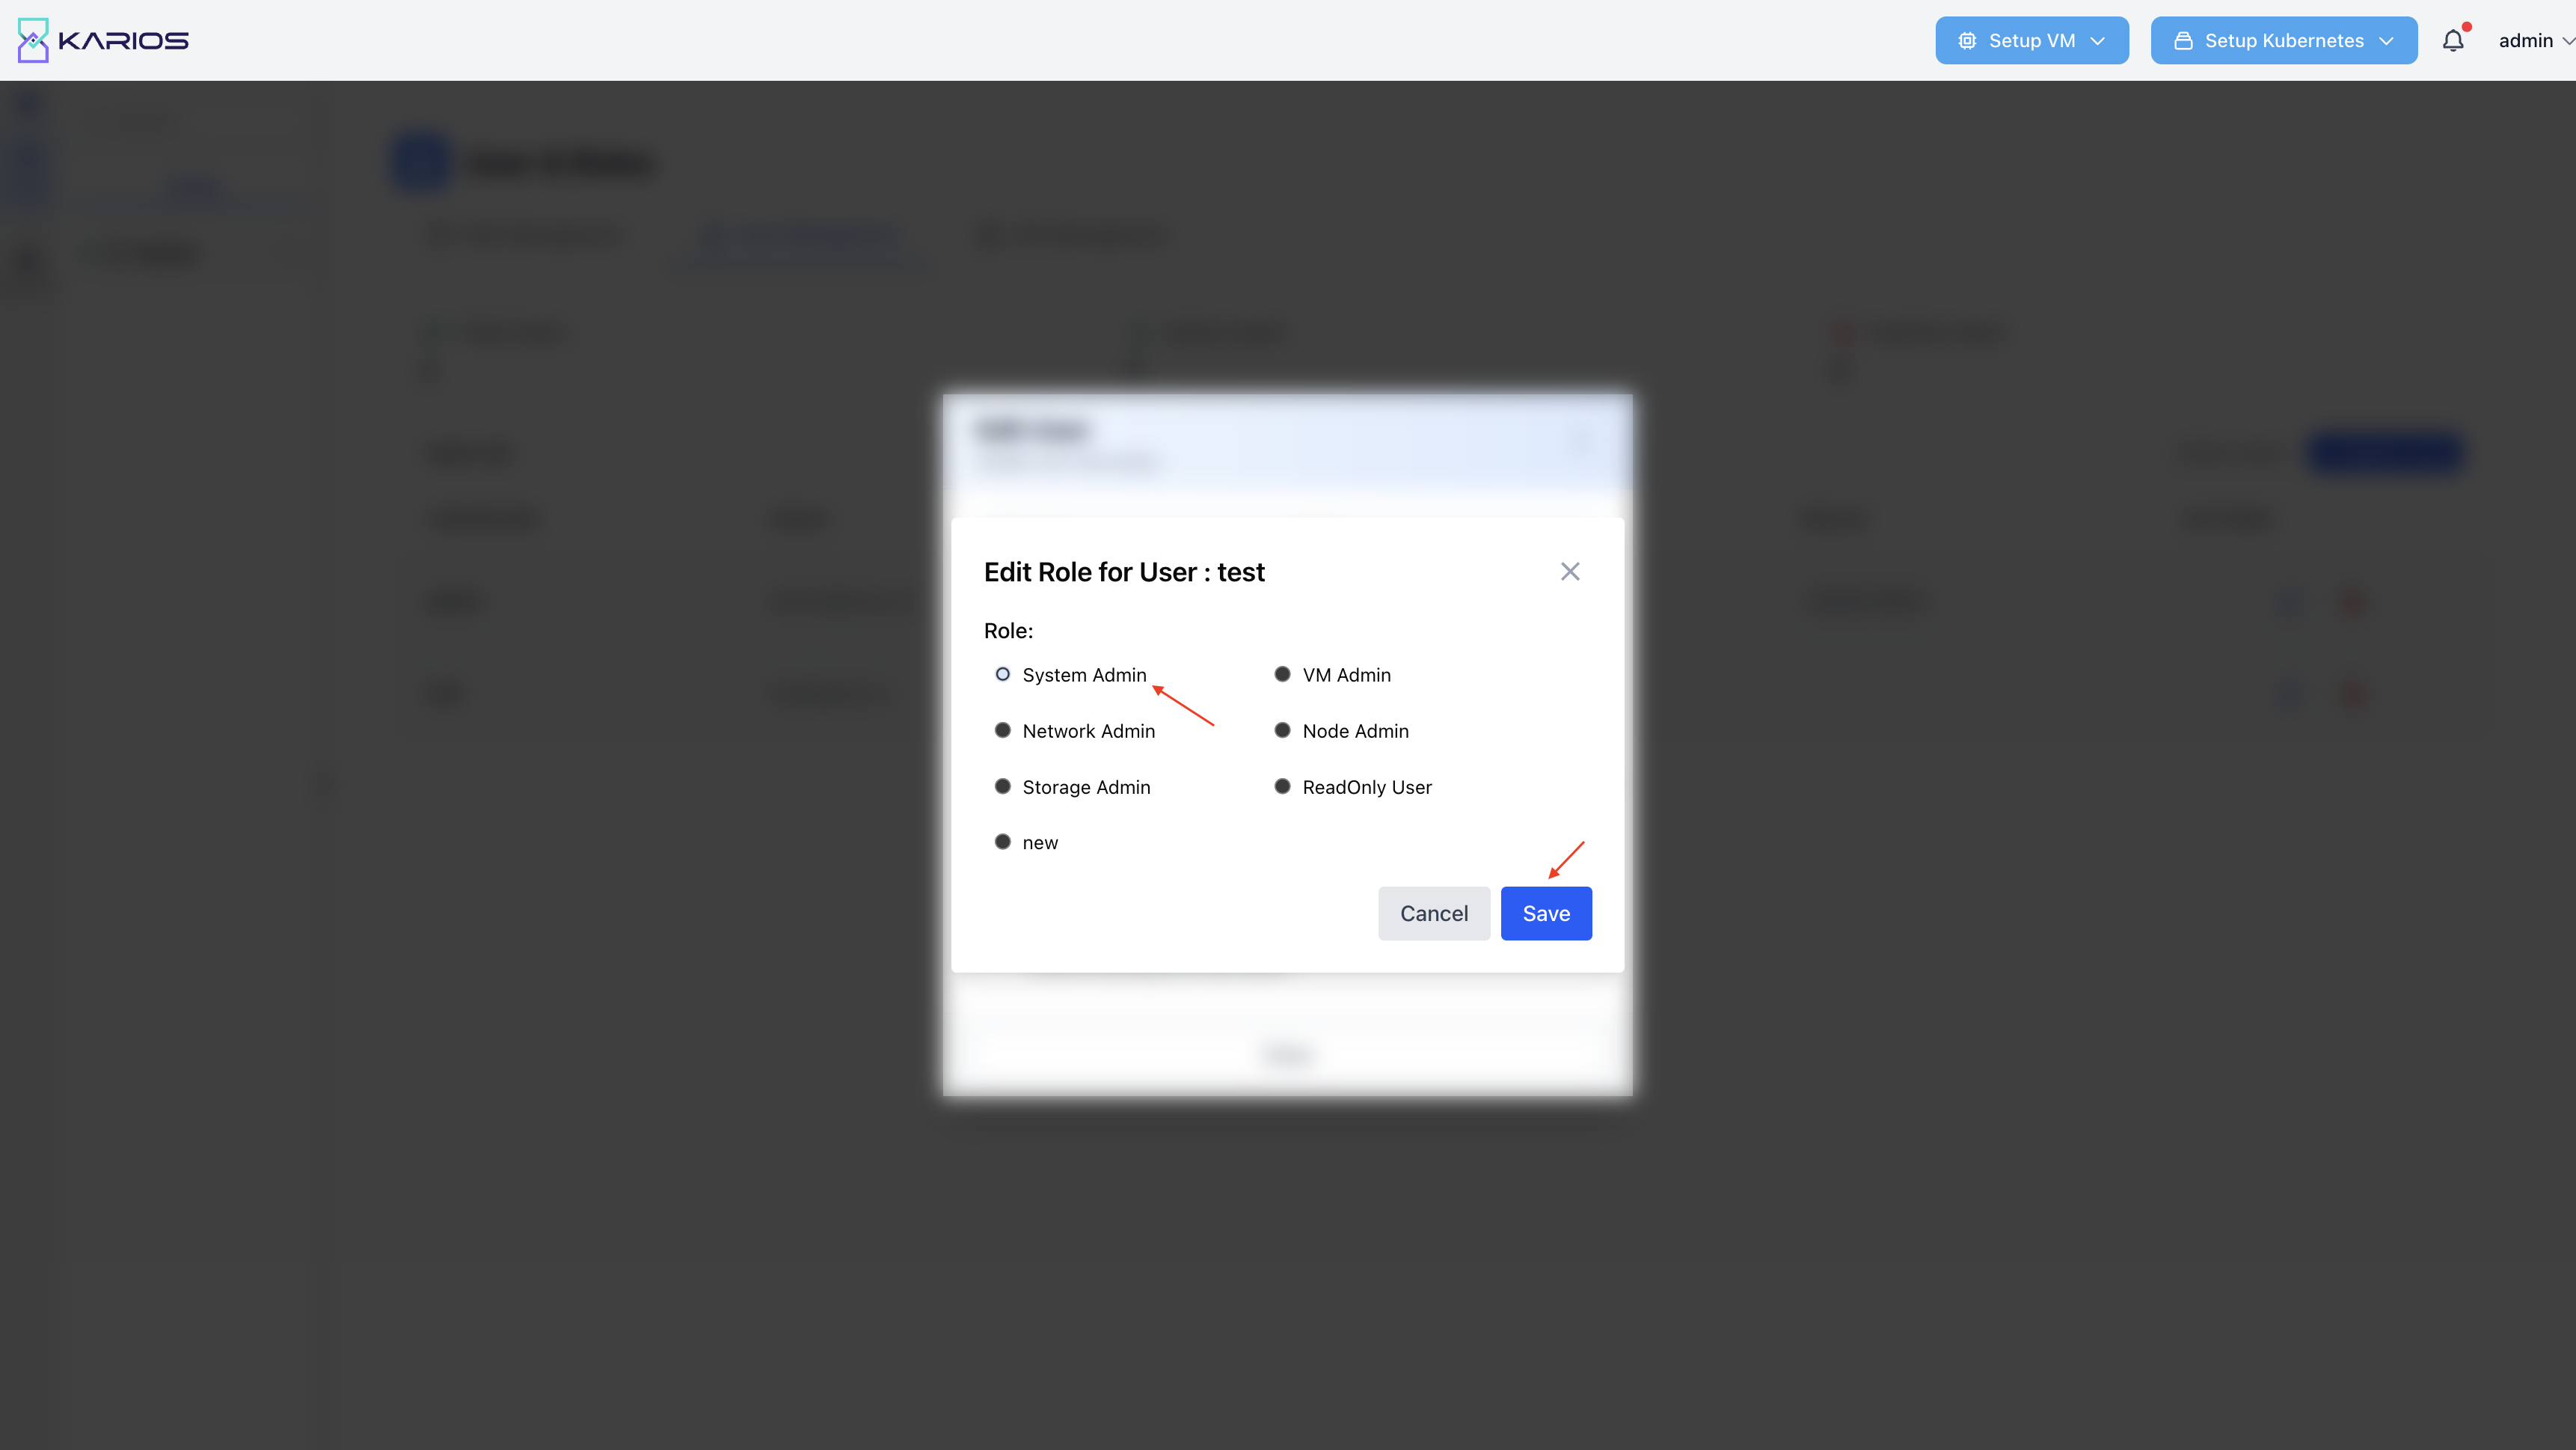
Figure : Assign System Admin Role
Method 2: Custom Full Access Role
Access Role Management interface
Create new role with comprehensive name (e.g., “Full Administrator”)
Select ALL available permissions in the permission grid
Save the custom role
Assign the new role to target users
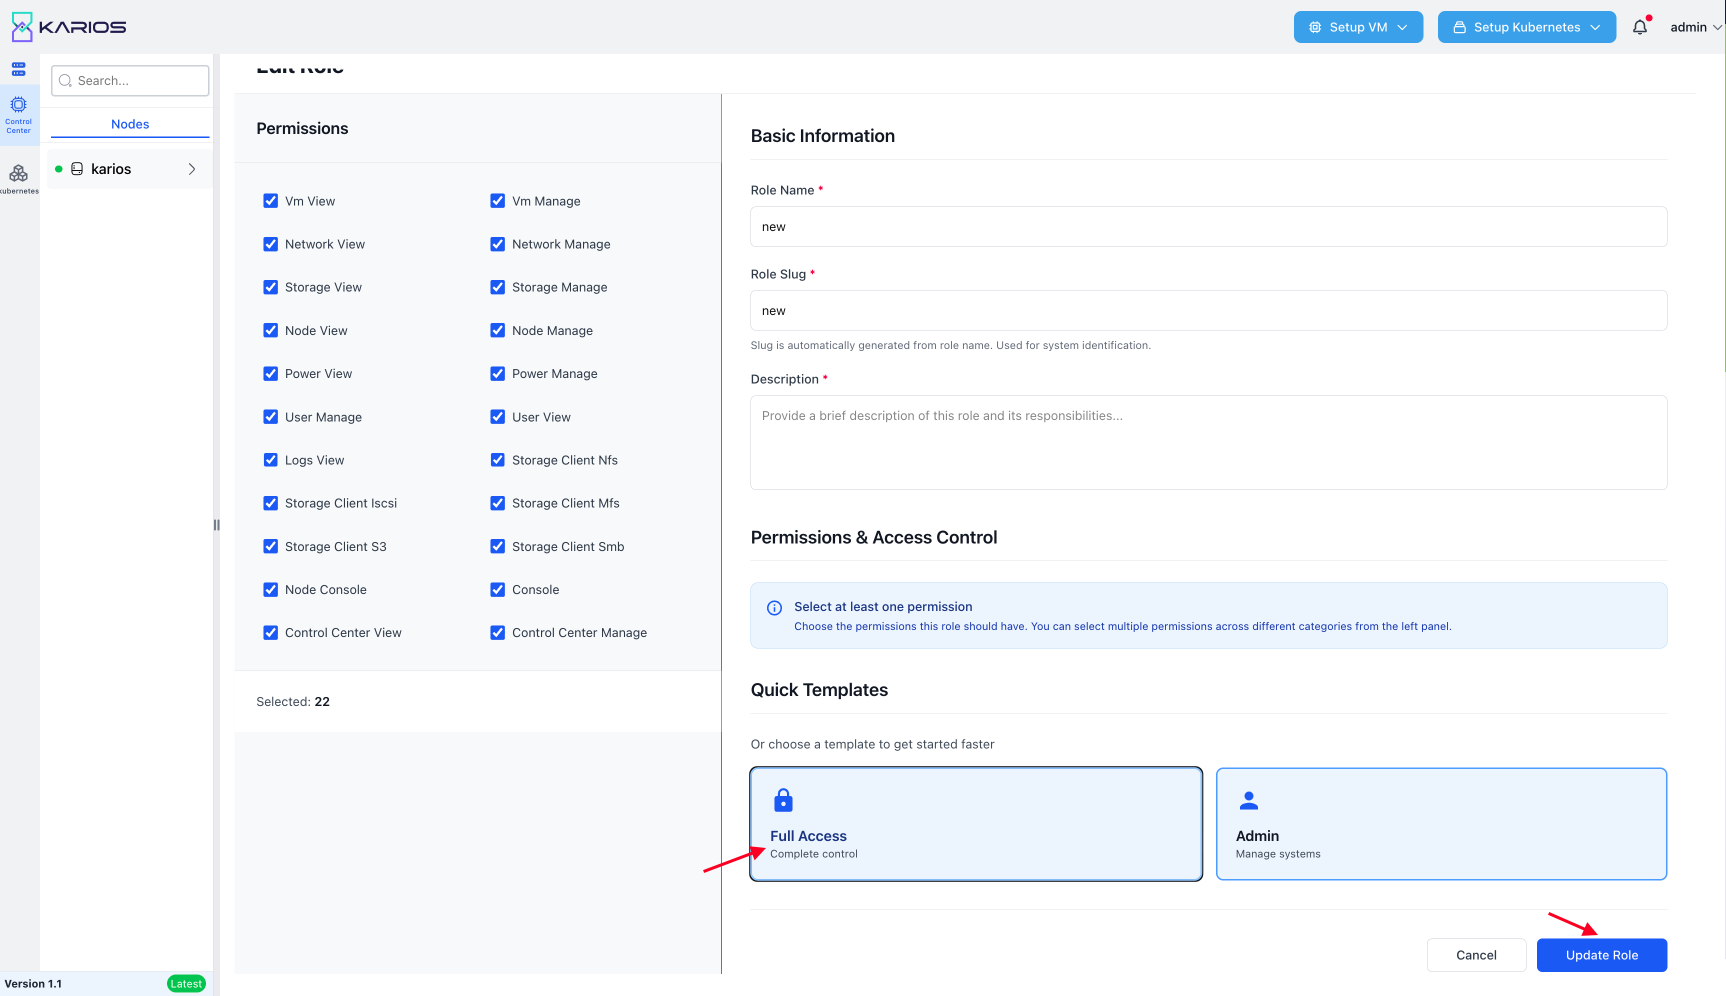
Figure : Assign Custom Role
Approval Role Assignment
After Creating the User , if you wish to give them the restricted eligibility, select the dropdown “Approvals Required” to assign permission
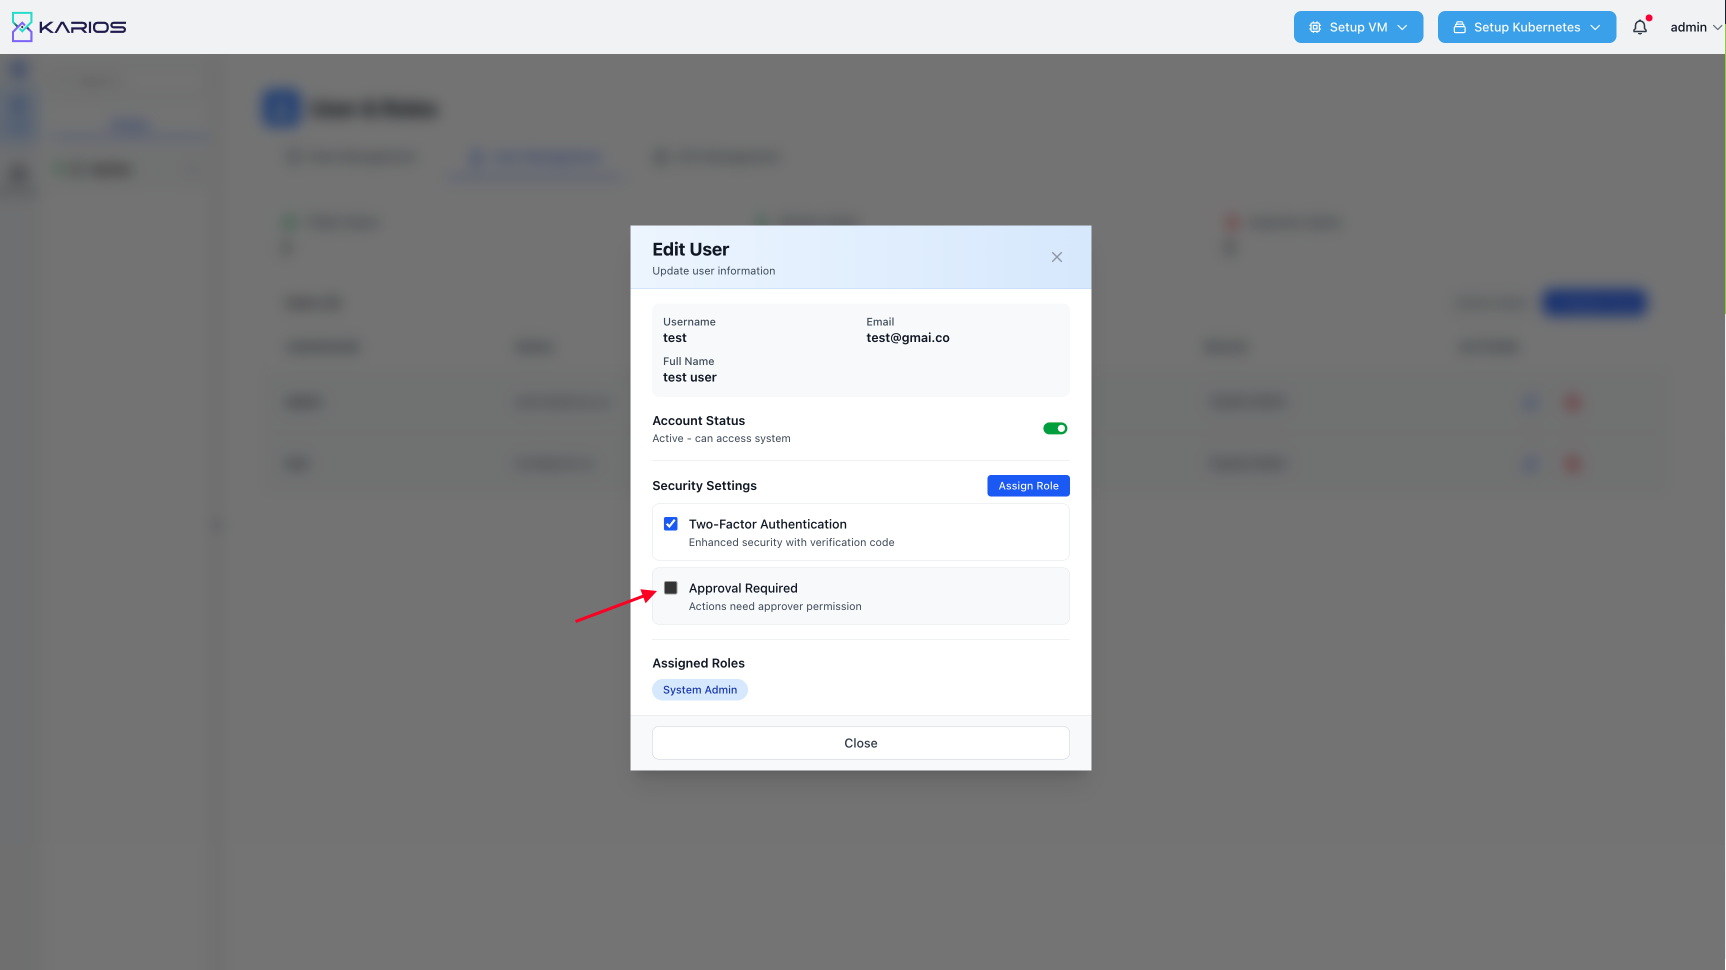
Figure : Assign Approval Role
To assign approvers, select eligible approvers from the popup
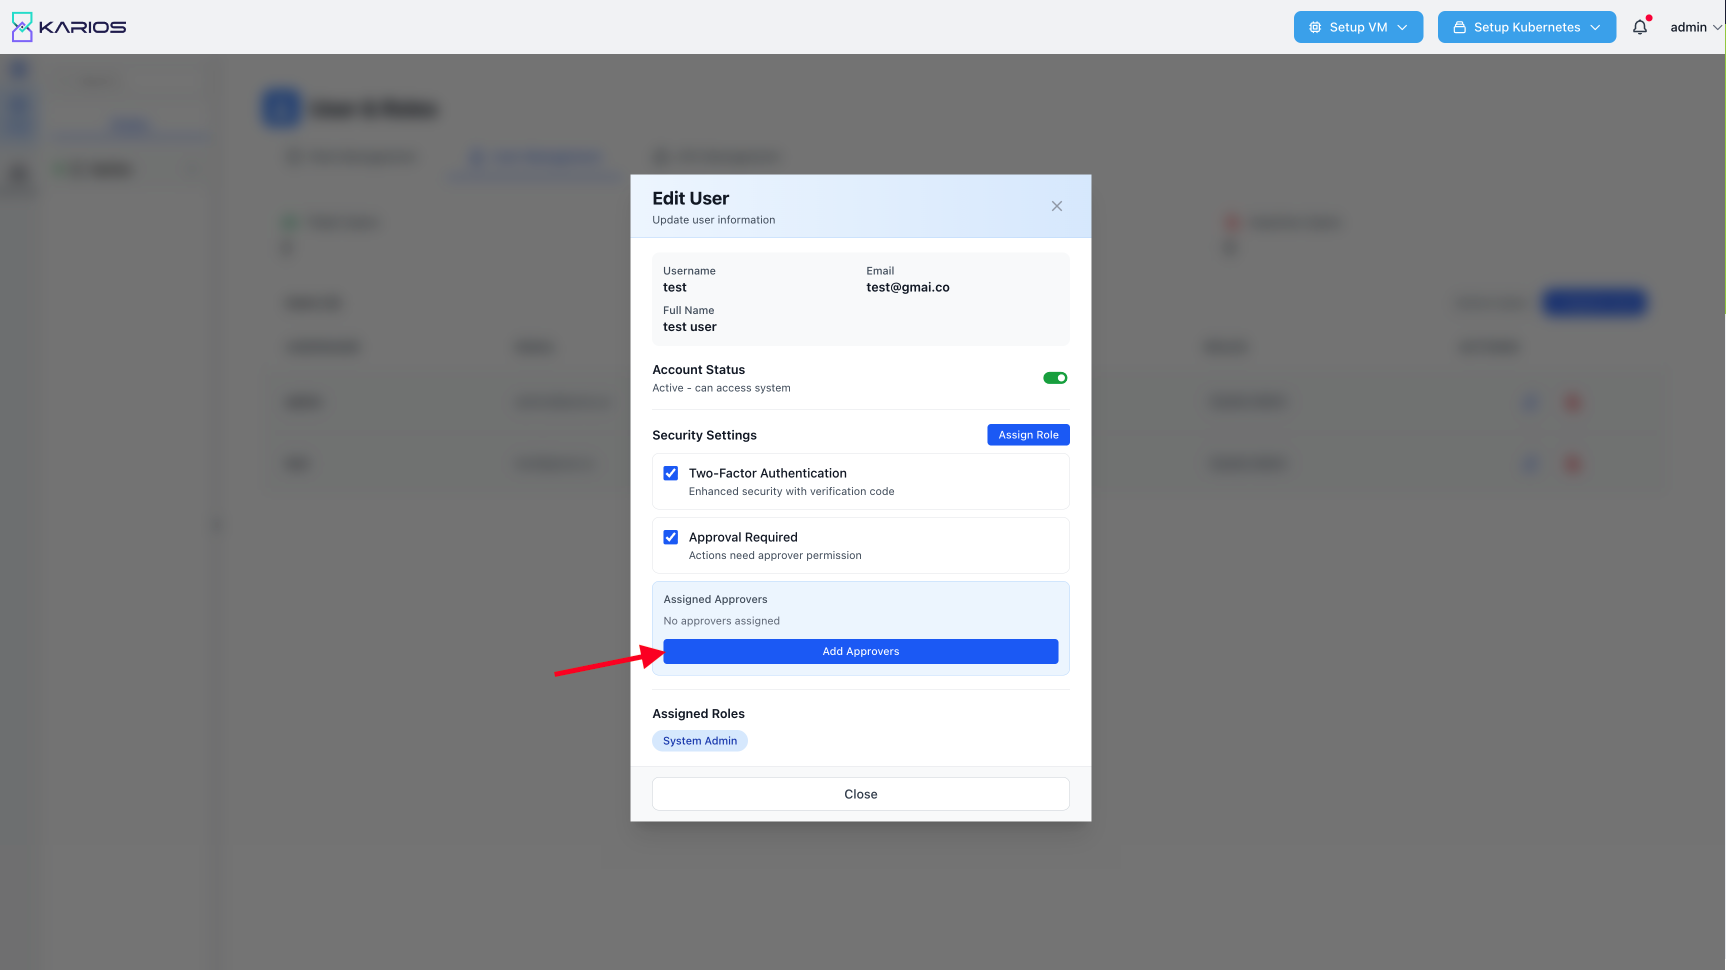
Figure : Selected Approvers
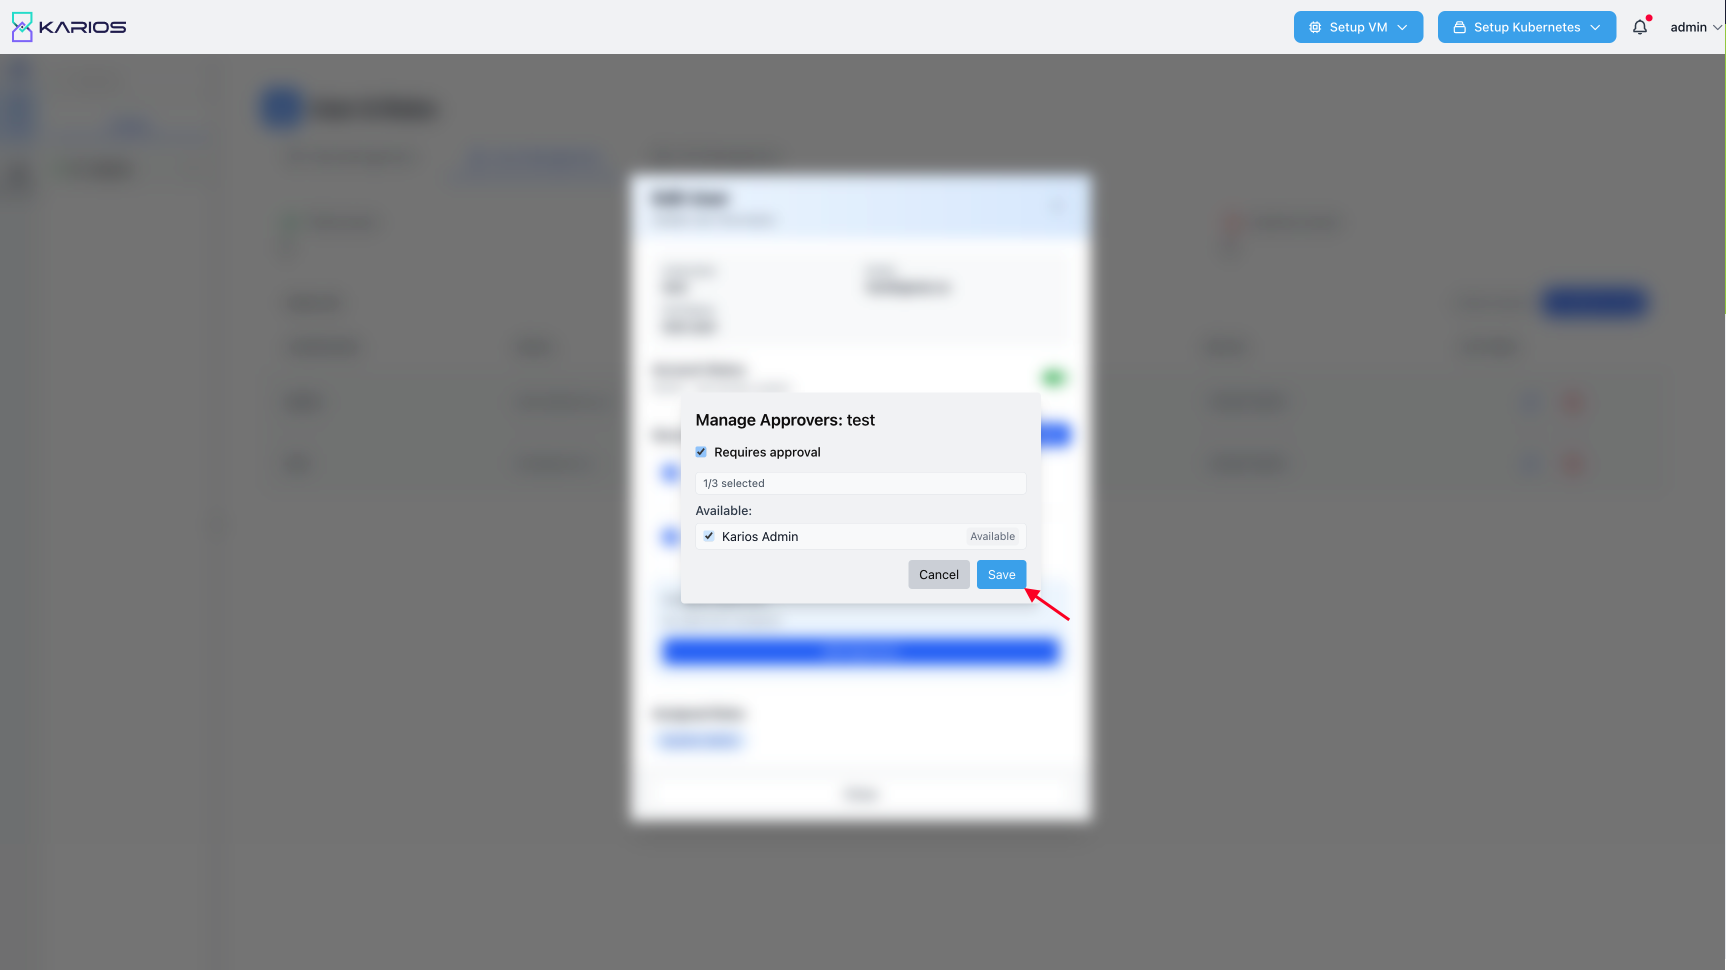
Figure : Select Approvers Popup
Specialized Access Implementation
Users can be assigned specialized roles based on job function:
Storage Administrators: Storage Admin role for ZFS and storage management
Network Engineers: Network Admin role for network infrastructure
Operations Staff: ReadOnly User role for monitoring and reporting
Warning
Full access roles carry significant operational implications:
Complete System Control: Ability to modify any system configuration
Data Access: Unrestricted access to all stored data and configurations
User Management: Ability to create, modify, or delete user accounts
User Lifecycle Management
Account Activation Process
The complete account activation workflow:
Registration: Create user account with required information
Role Assignment: Assign appropriate role based on job function
Approval: Process any required approvals through designated approvers
Activation: Activate account to enable system access
Notification: User receives activation notification and initial access instructions
Account Maintenance
Ongoing account management includes:
Status Changes: Toggle between Active and Inactive status as needed
Role Modifications: Update user roles based on changing responsibilities
Approval Management: Manage approval workflows for sensitive role assignments
Access Reviews: Regular review of user accounts and assigned permissions
Account Deletion: Process account deletion requests by navigating to the user management block.
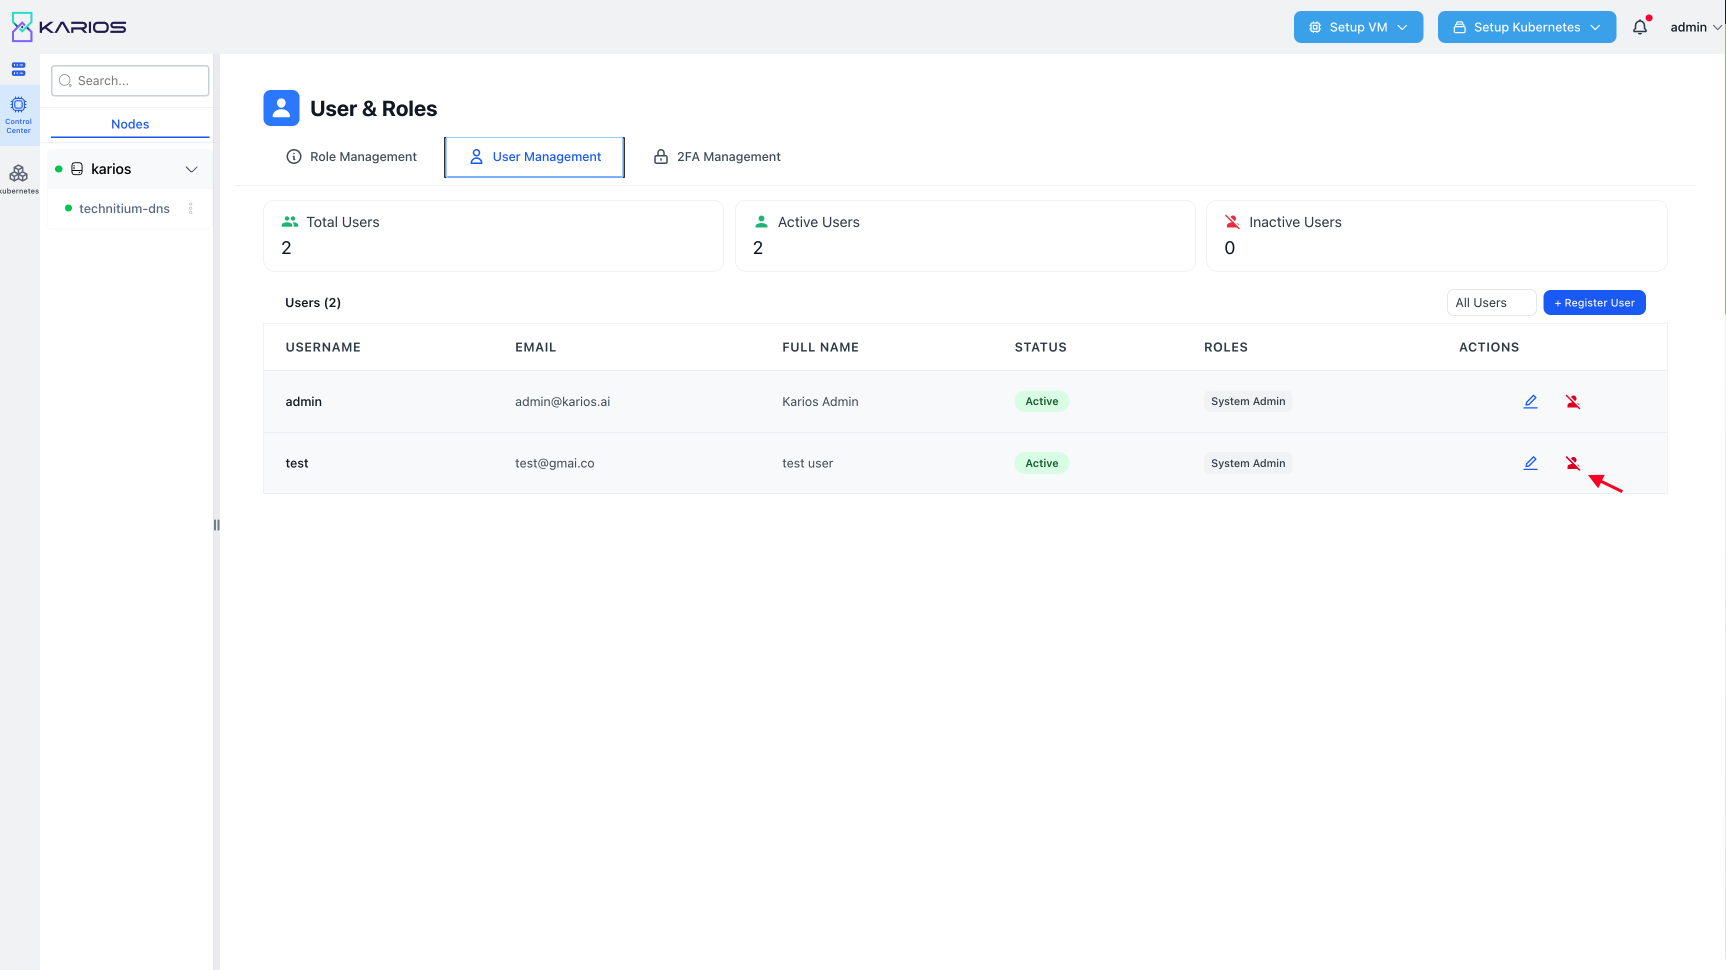
Figure : Account Deletion
Two-Factor Management
Two-Factor Authentication Management Dashboard
Navigate to the Two-Factor Management section
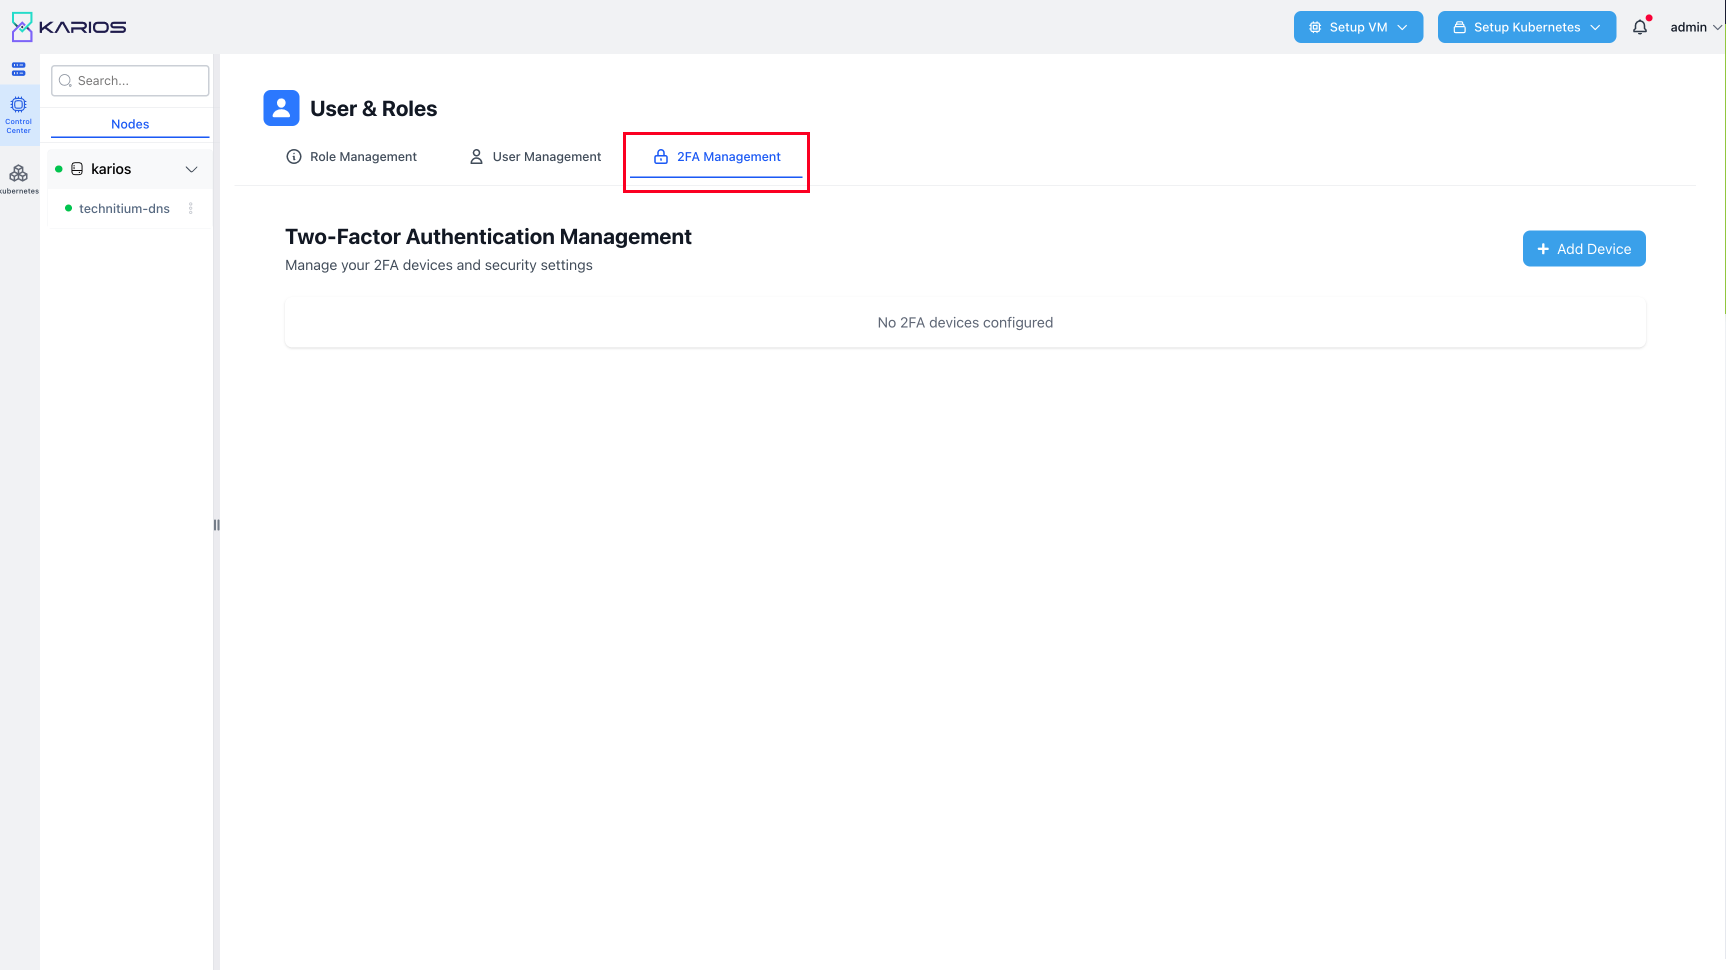
Figure : Navigate to Two-Factor Management
View and manage two-factor authentication settings and devices
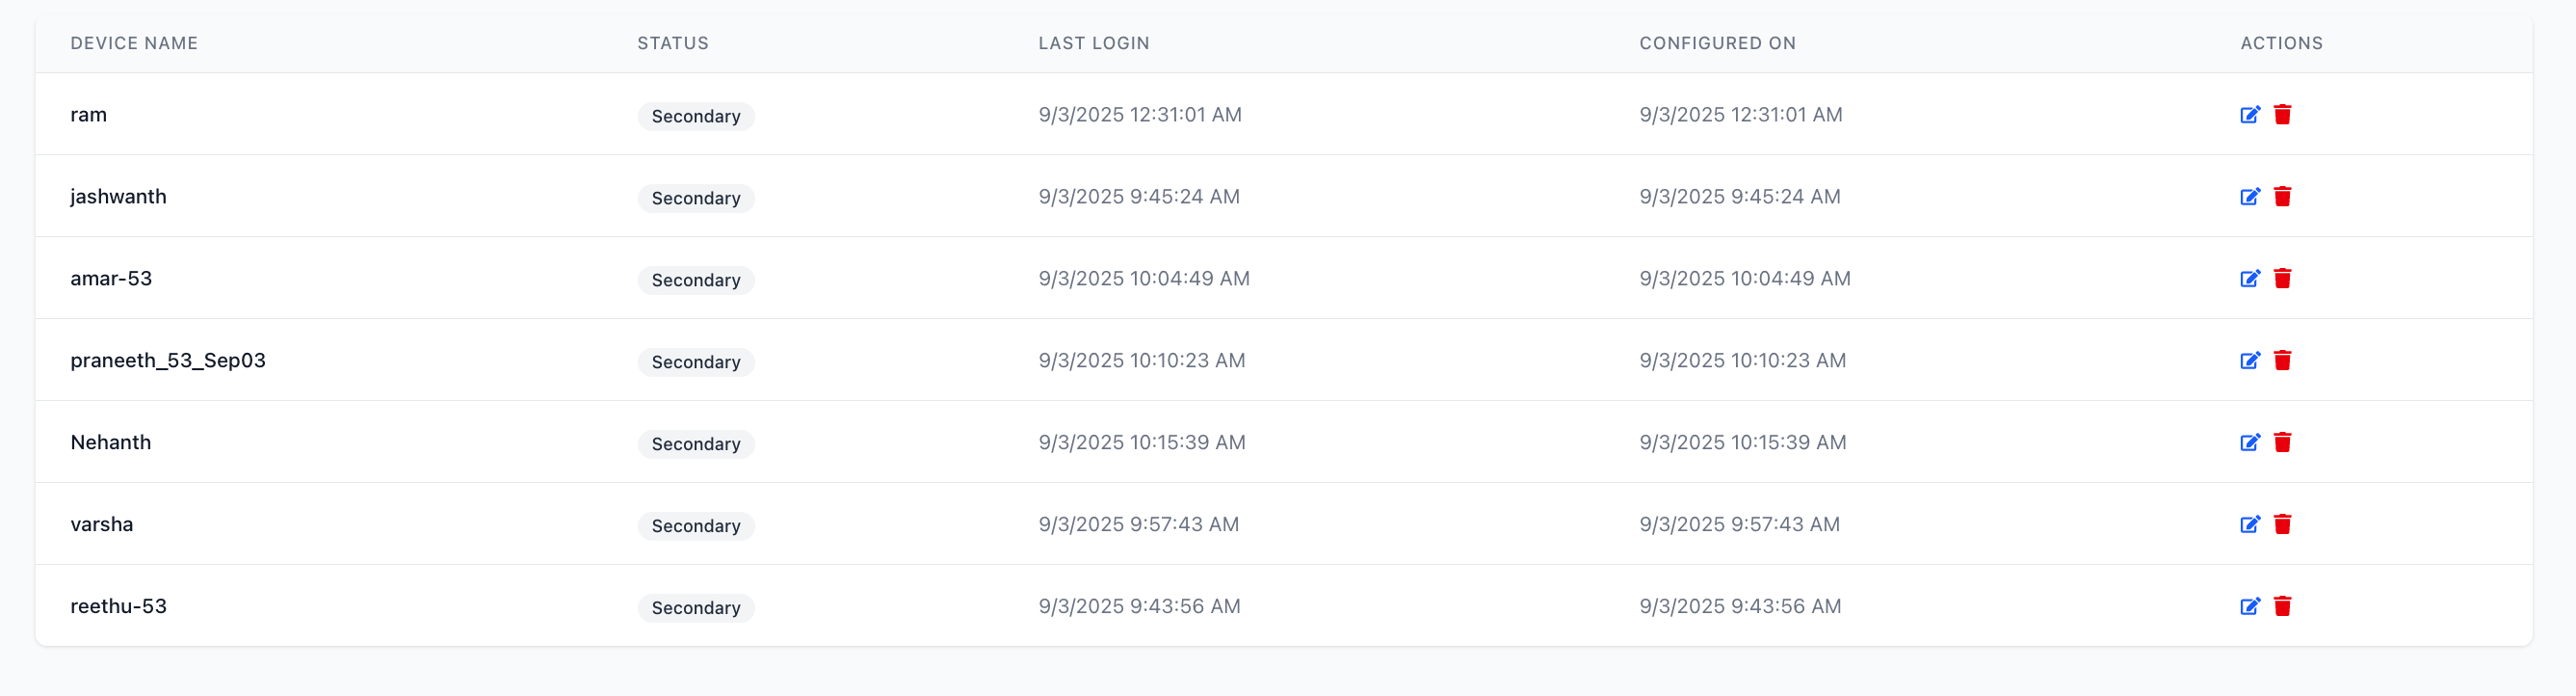
Figure : Two-Factor Management Dashboard
Edit and delete devices in the dashboard
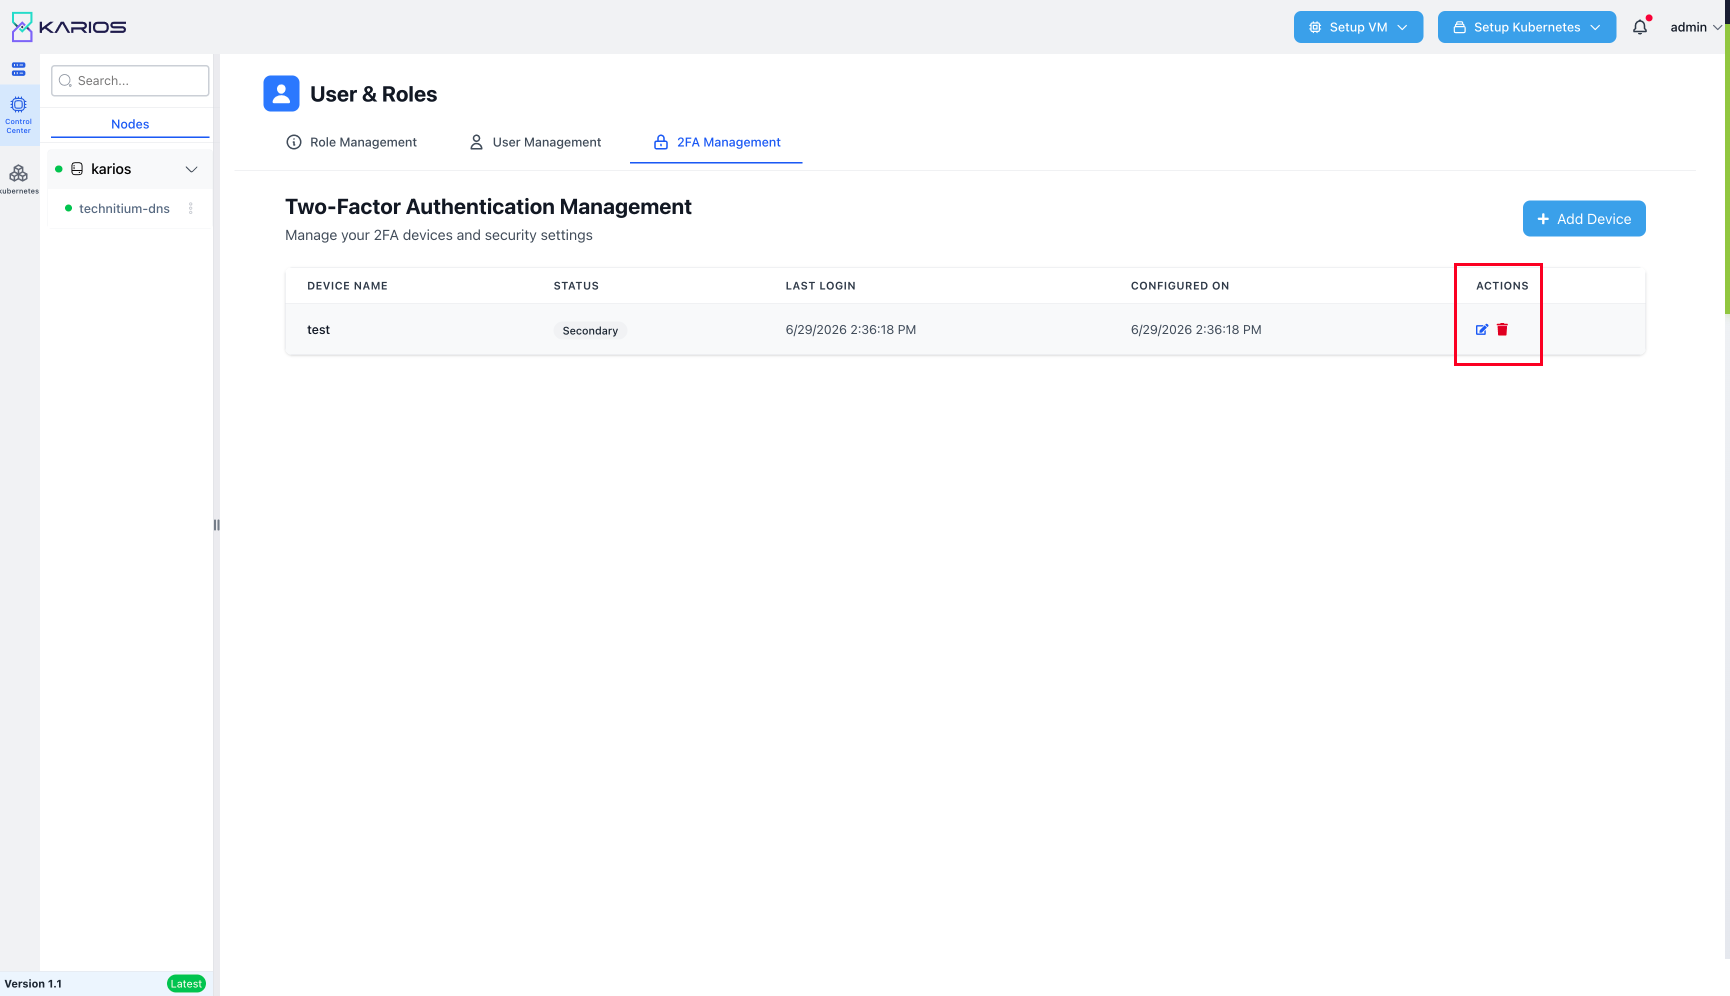
Figure : Two-Factor Device Management
Add new device
Click on the “Add Device” button in the Two-Factor Device Management dashboard
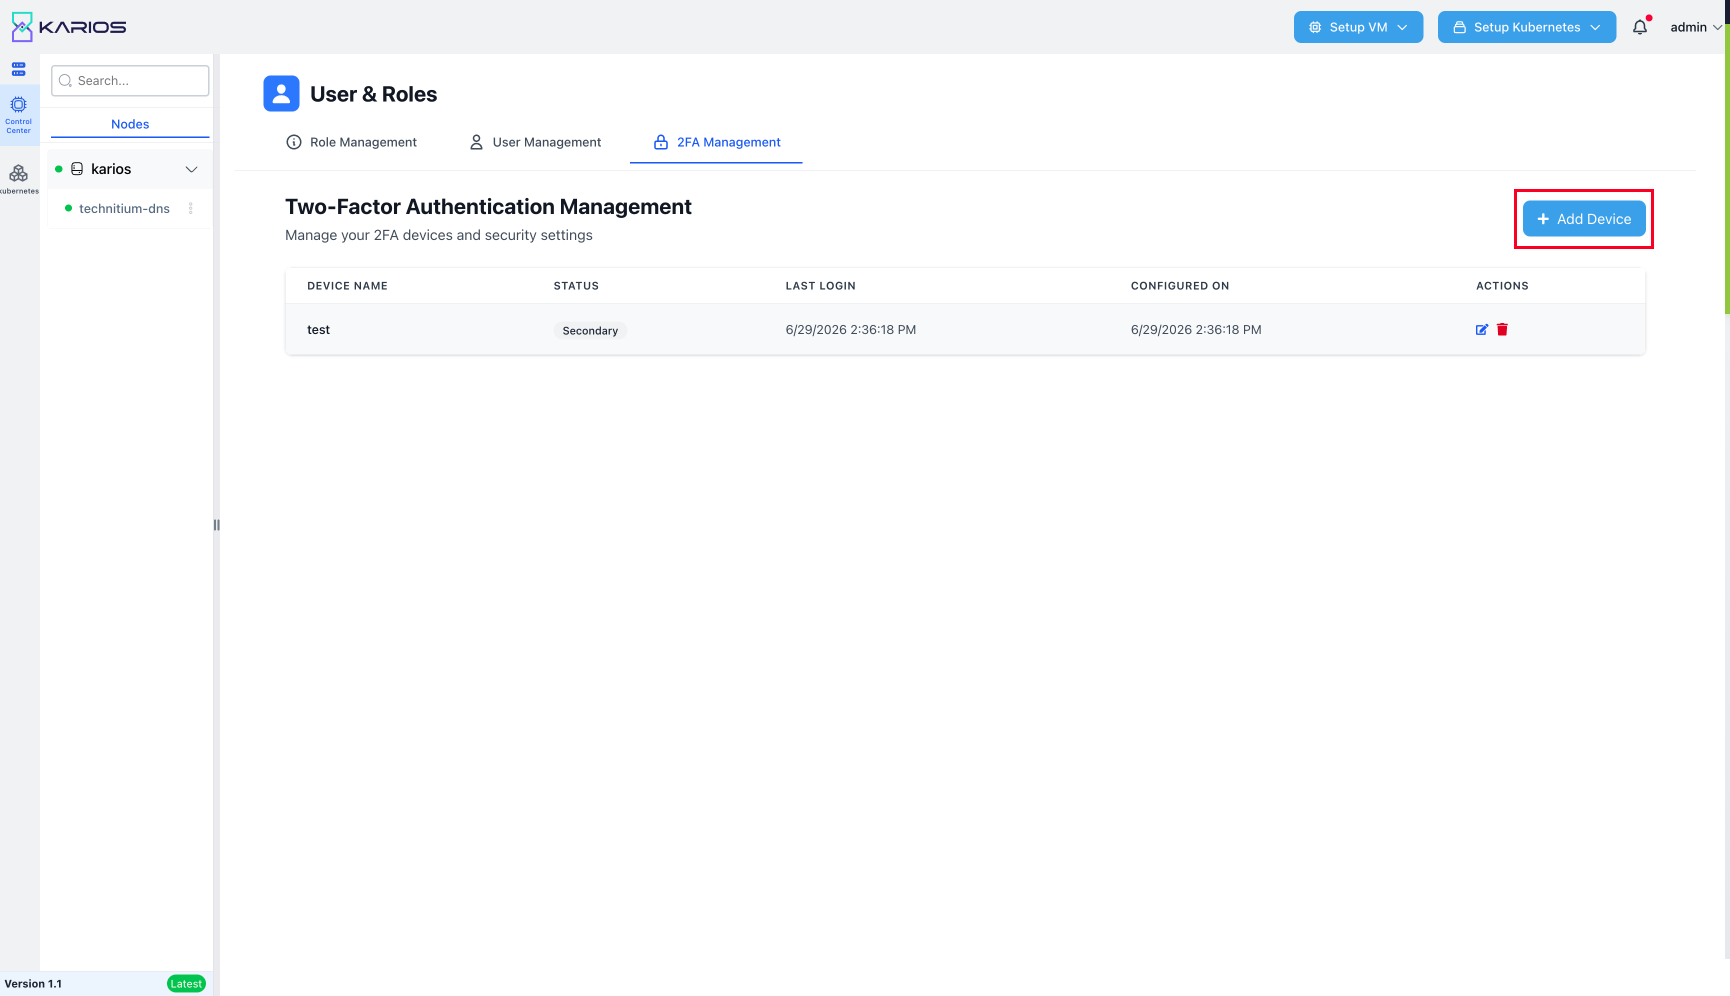
Figure : Add Two-Factor Device
Follow the prompts to enter new device information for two-factor authentication
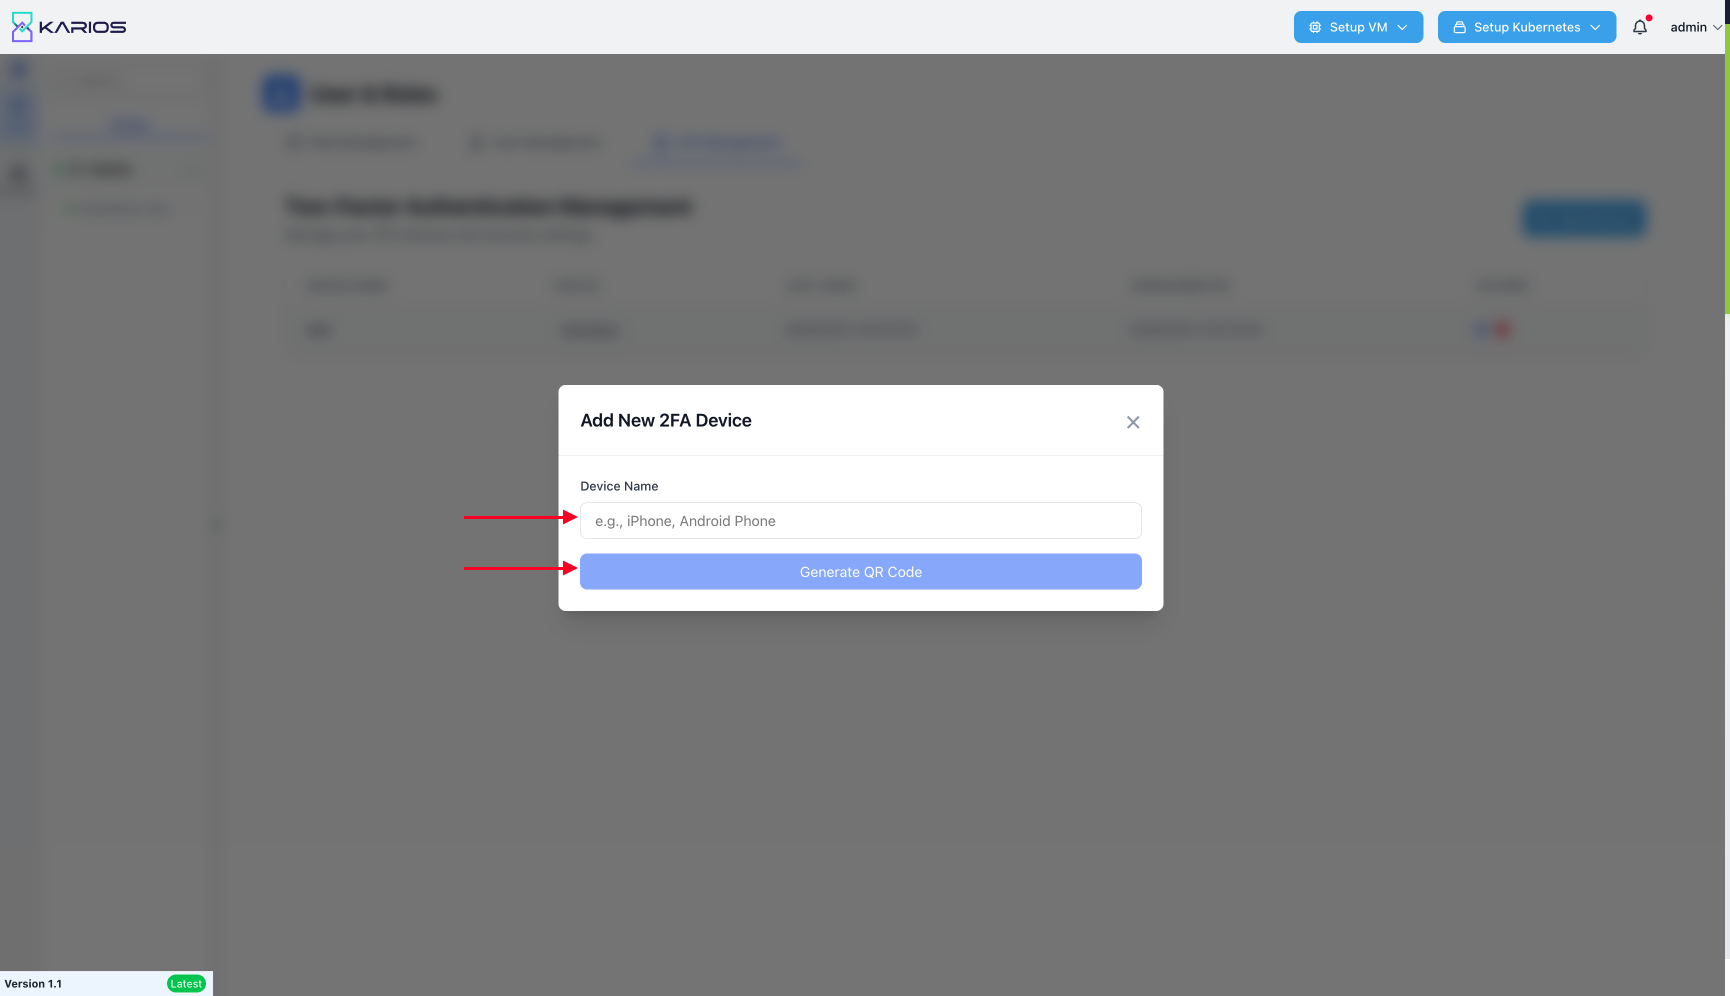
Figure : Two-Factor Device Enrollment
Scan and verify the new device to complete the enrollment process
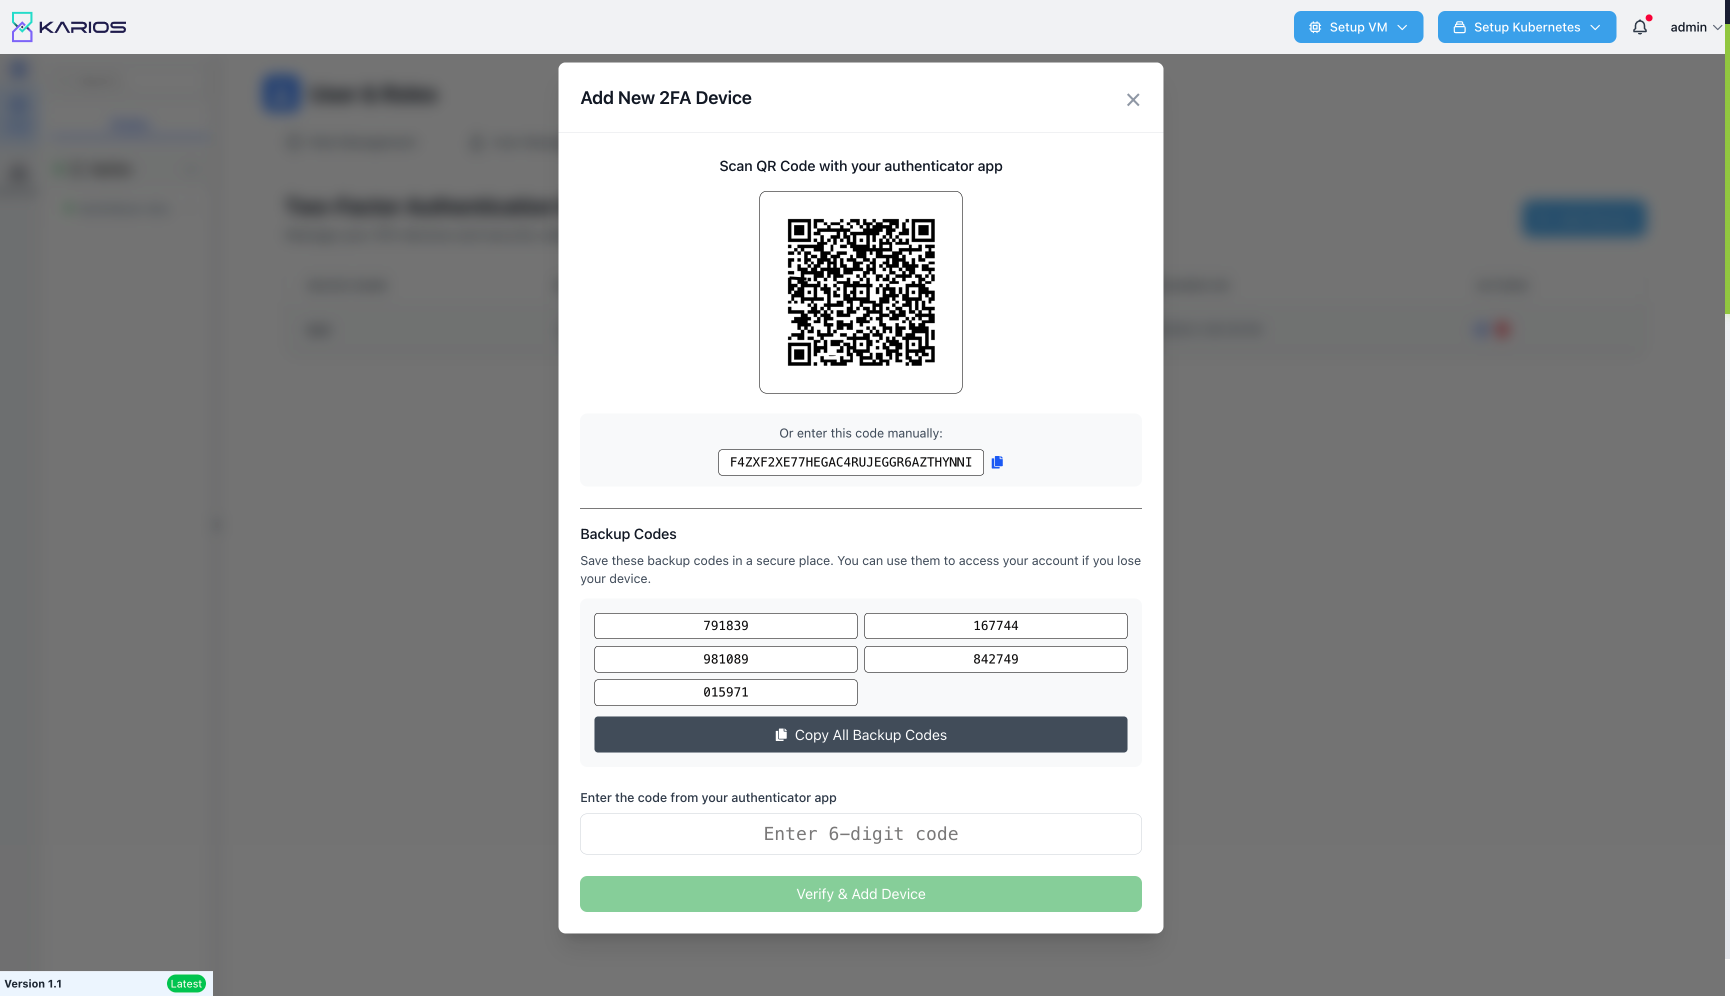
Figure : Two-Factor Device Verification
Best Practices
Account Management
Strong Passwords: Use strong, unique passwords for your account.
Regular Updates: Update passwords regularly.
Session Management: Log out properly when finished using the system.
Access Monitoring: Monitor account access and report suspicious activity.
License Compliance
Renewal Tracking: Monitor license expiration dates proactively.
Compliance Documentation: Maintain records of license validation and renewals.
Usage Monitoring: Ensure system usage complies with license terms.
Renewal Planning: Plan license renewals well in advance of expiration dates.
System Usage
Resource Management: Use system resources efficiently and responsibly.
Documentation: Keep personal documentation of system configurations and procedures.
Change Management: Follow proper change management procedures for system modifications.
Support Utilization: Utilize available support resources and documentation effectively.
Operational Guidelines
Regular Audits: Conduct periodic access reviews
Role Documentation: Maintain clear documentation of role purposes and permissions
Training: Provide adequate training for users with new role assignments
Change Management: Follow proper procedures for role modifications
Emergency Procedures: Maintain emergency access procedures for critical situations
Note
This practical implementation guide provides step-by-step instructions for managing roles and users through the Karios web interface, ensuring proper access control while maintaining operational efficiency.
Web Interface Navigation
Dashboard Overview
The Karios web interface provides a comprehensive management dashboard with the following key areas:
Datacenter Hierarchy: Navigate between different datacenters and control nodes using the left sidebar
Component Tabs: Access major system components via the top navigation bar
Status Indicators: Real-time status information and metrics displayed prominently
Action Buttons: Primary actions like “Setup VM” accessible from the main interface
Storage Management Operations
Storage Tab Overview: The Storage tab provides comprehensive storage management capabilities for all supported storage protocols and systems. This centralized interface allows administrators to configure, monitor, and manage various storage types through a unified dashboard.
Storage Protocol Support: The storage interface provides access to multiple storage protocols with dropdown selection:
MooseFS Storage
MooseFS Distributed Storage: MooseFS is a distributed file system that provides scalable, fault-tolerant storage across multiple servers with a unified namespace. It offers high availability and automatic data replication for enterprise storage requirements.
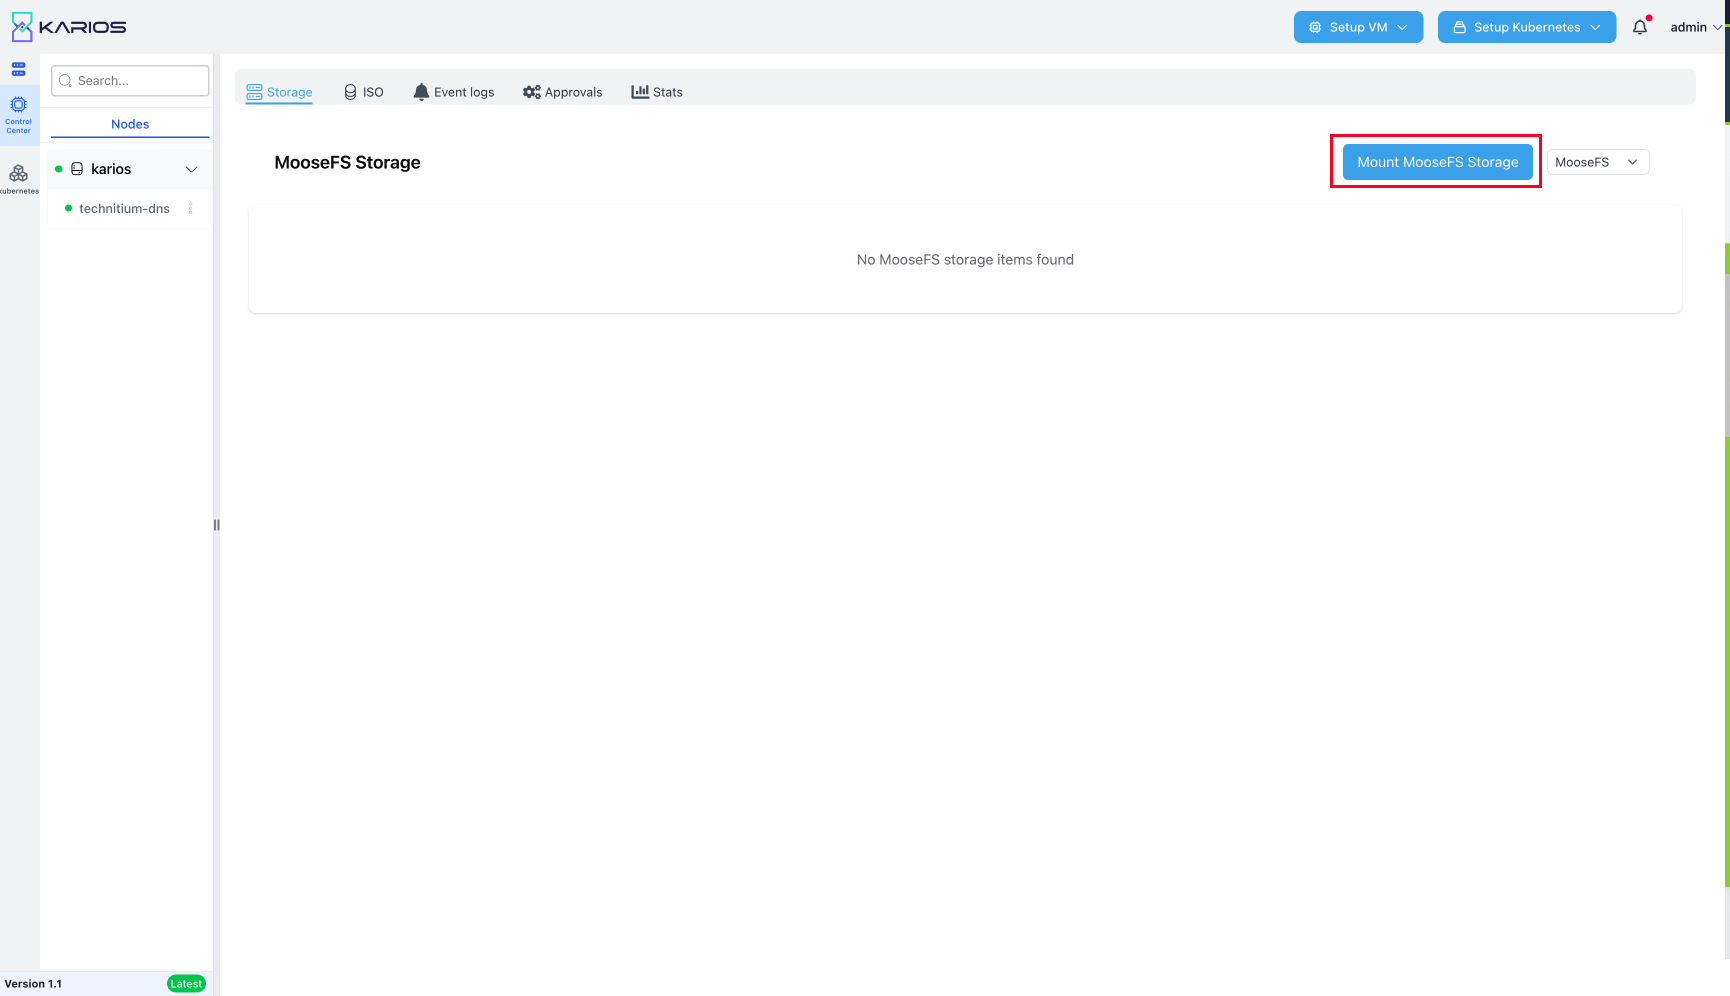
Mount MooseFS Storage: Click “Mount MooseFS Storage” to configure MooseFS connections
Server Information: View MooseFS server details (e.g., 192.168.111.92)
Port Configuration: Configure MooseFS port settings (e.g., 9421)
Storage Metrics: Monitor storage usage and capacity
Size: Total storage capacity (e.g., 49G)
Used: Currently used storage (e.g., 11G)
Available: Available storage space (e.g., 38G)
Capacity: Storage utilization percentage (e.g., 22%)
Mount Point: View mount directory (e.g., /mnt/moosefs/karios)
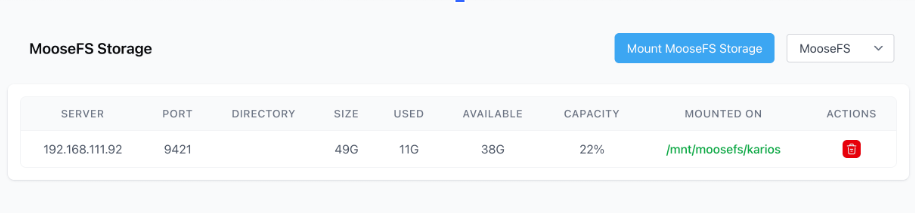
To mount MooseFS storage, follow these steps:
Step 1: Gather MooseFS Server Information Before configuring, obtain the following details
MooseFS server IP address
Server port number (usually 9421)
Available directory/namespace to mount
Step 2: Configure MooseFS Mount
ID: Enter a name to identify this storage mount (e.g., “main-storage”)
Tip
A MooseFS ID is a unique identifier used for user authentication, access control, and quota management within the distributed MooseFS file system.
Server: Enter the IP address of your MooseFS server (e.g., 192.168.111.92)
Tip
A MooseFS server is any computer running the MooseFS software and fulfilling a specific role like managing metadata (master), storing data chunks (data), or facilitating discovery (listen) within a distributed file system cluster.
Port: Enter the MooseFS port number (default is 9421)
Tip
MooseFS ports are network doorways used by the master, data, and listen servers to communicate with each other and clients, with default values like 10001 (master), 10003 (data), and 10005 (listen).
Directory: Enter the MooseFS directory path you want to access (e.g., “moosefs”)
Tip
A MooseFS directory is a hierarchical structure within the distributed file system, similar to traditional directories, that organizes files and subdirectories across multiple servers for storage and access.
Step 3: Configure Options
✓ Auto Mount on Restart: Check this to automatically connect to storage when system restarts
✓ Add to Datastore: Check this to make the storage available for virtual machines
Step 4: Complete Setup Click Submit to save the configuration and mount the S3 storage.
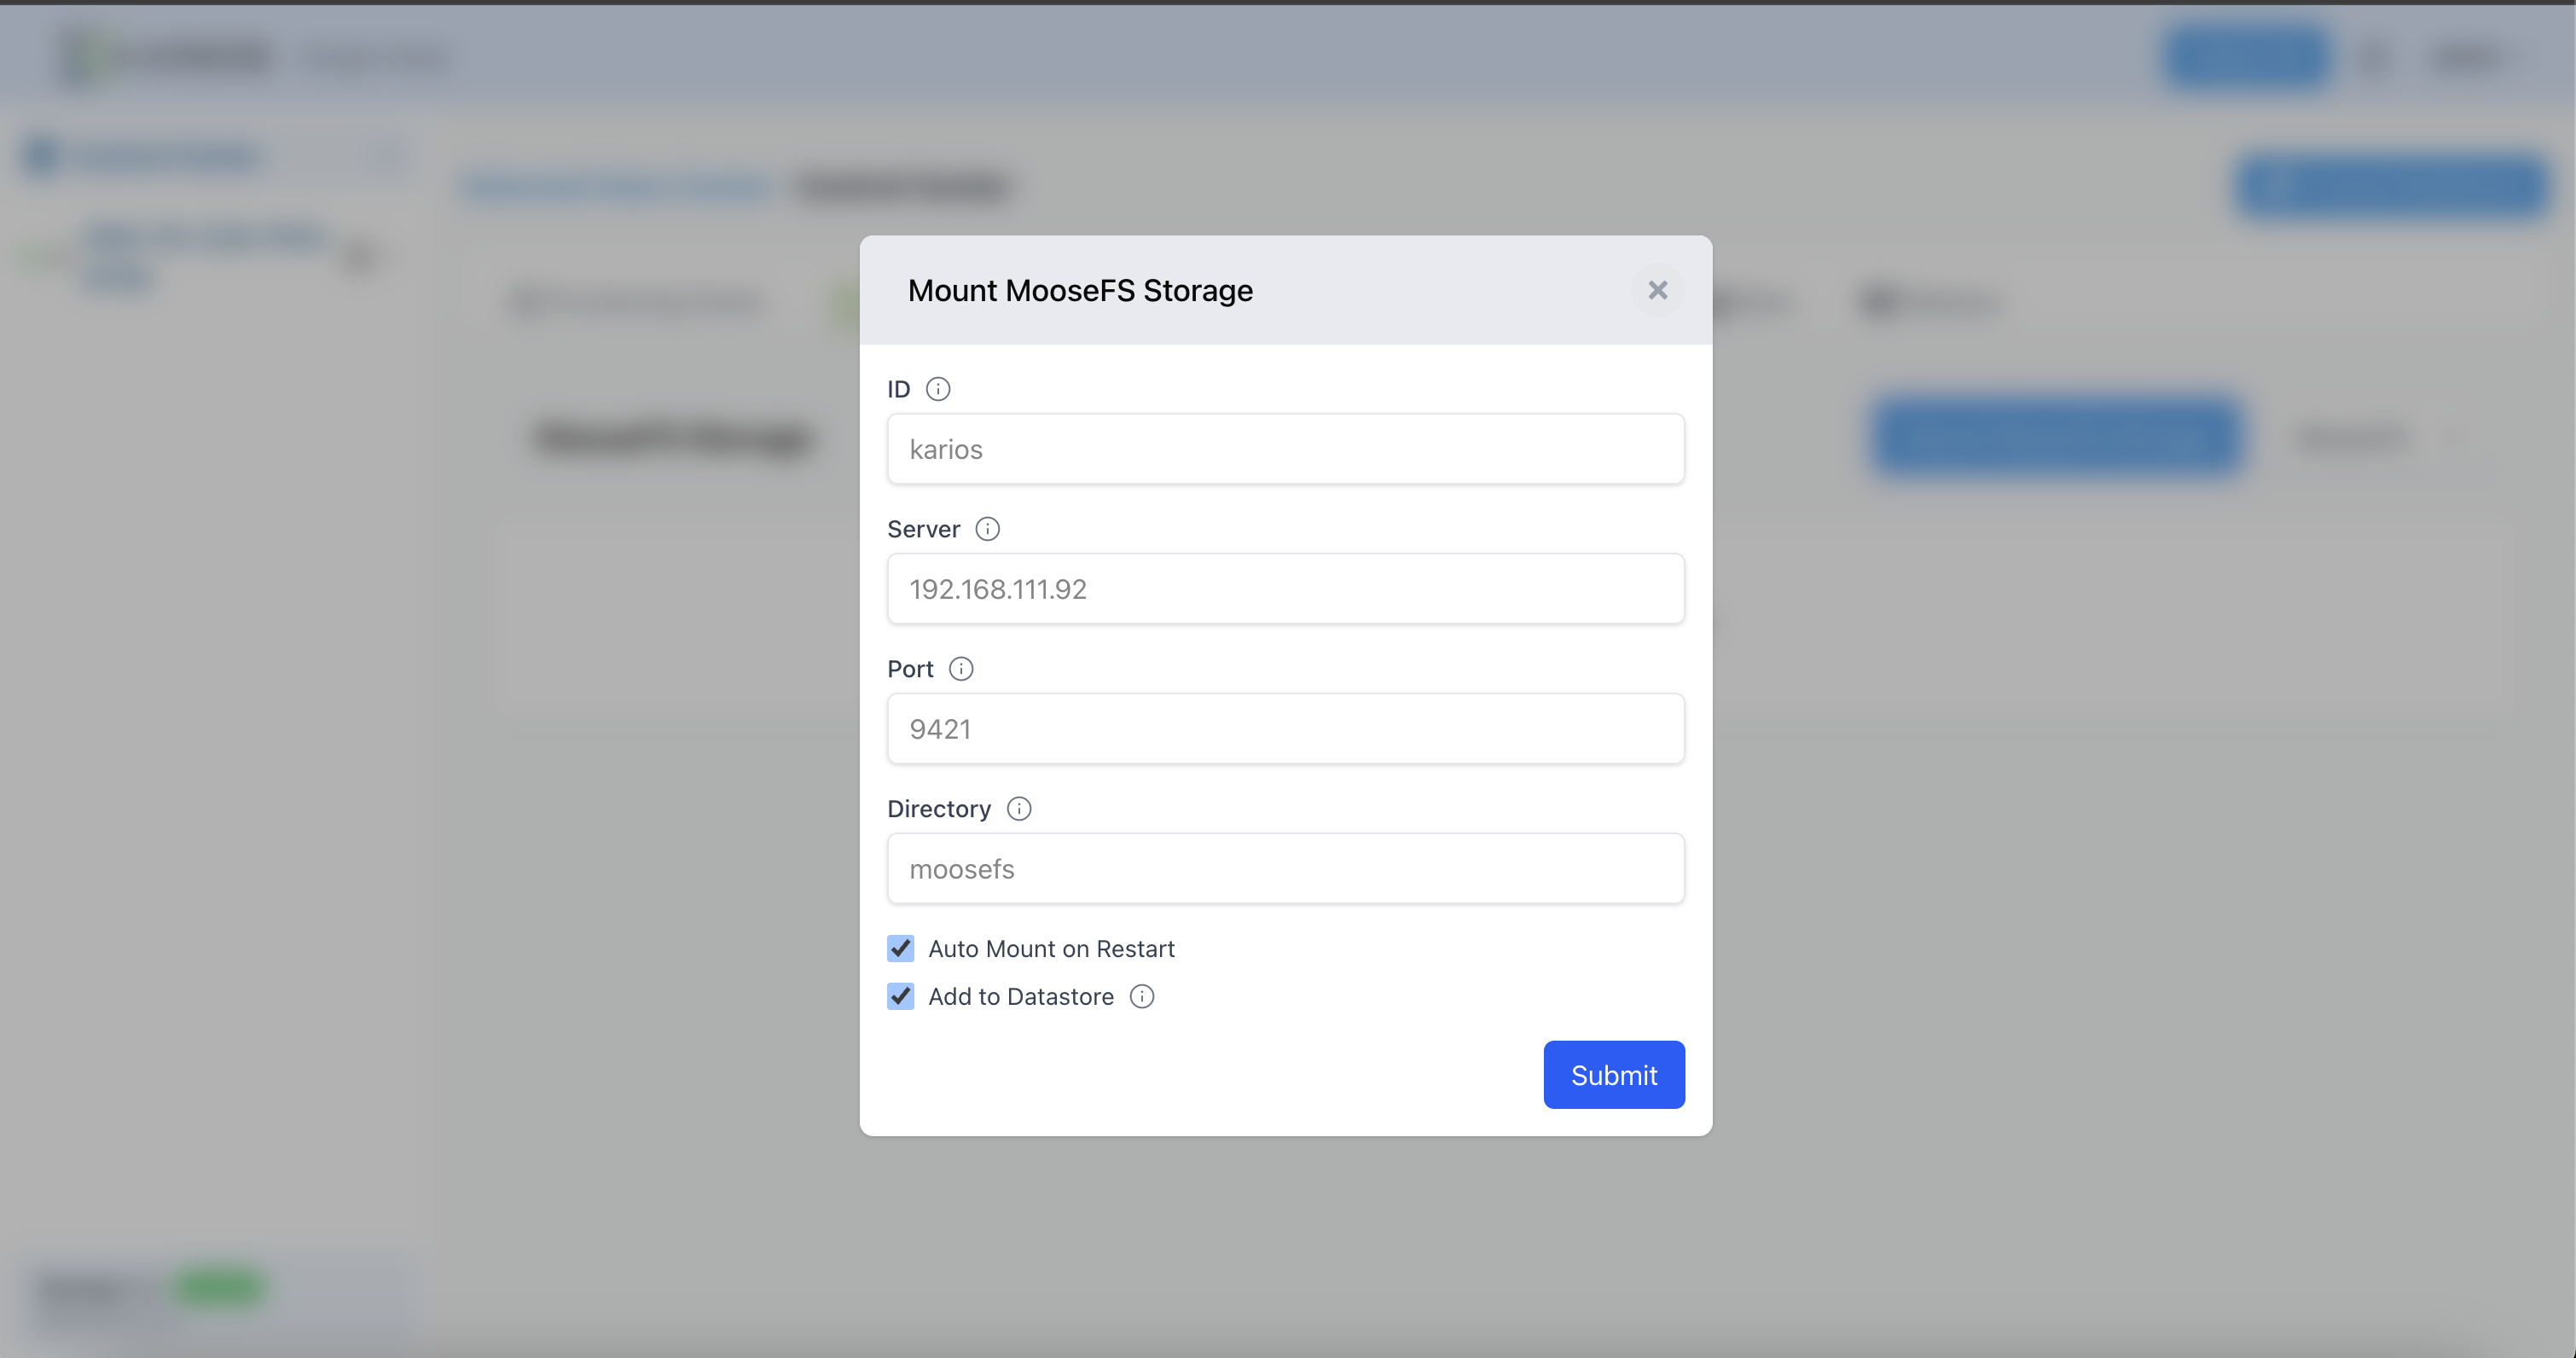
MooseFS Storage Management
Actions: Unmount and manage MooseFS storage
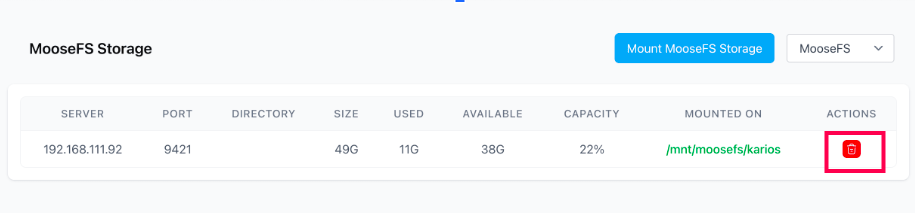
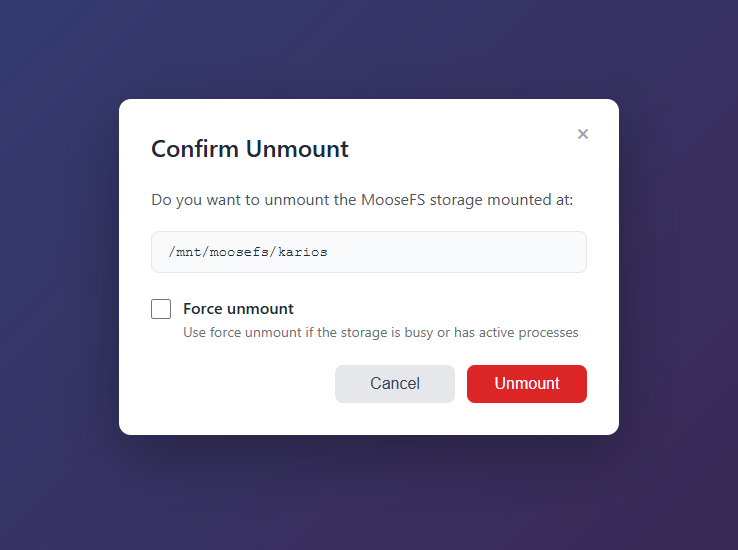
Click Delete icon to unmount the moosefs storage. It will prompt you for a confirmation. Click “unmount” to remove the moosefs mount.
S3 Storage
S3 (Simple Storage Service) provides scalable object storage for backup, archival, and cloud-native applications. It offers cost-effective storage with global accessibility and integration with modern DevOps workflows.
Why S3 is Useful for Hypervisors - Core Benefits
Centralized Storage for VM Images and Disks
The most common and significant use case involves storing VM disk images (.raw files) in S3 buckets instead of local hypervisor storage. This approach provides:
Scalability: Easily scale storage capacity as needed without being limited by the physical hardware of the hypervisor host
Cost-Effectiveness: S3 is often cheaper than traditional SAN or NAS solutions for large amounts of data
Data Durability & Redundancy: S3 provides extremely high levels of data durability and redundancy, protecting against data loss
Additional Use Cases
Backup and Disaster Recovery: S3 serves as an ideal target for VM backups. Regular VM backups to S3 ensure quick restoration in case of disaster or hardware failure
VM Migration & Replication: Moving VMs between Karios hosts becomes easier when VM images are stored centrally in S3. This simplifies copying images between locations and enables streamlined disaster recovery replication
Content Delivery: For VMs hosting web applications or content-serving services, S3 can serve as a staging area or directly serve static assets
Specific Advantages for Karios
Flexibility: S3 allows Karios to operate more independently of the underlying storage hardware
Cloud-Native Integration: For Karios deployments in cloud environments, S3 integration provides natural architectural alignment
Simplified Management: Centralized storage simplifies management and reduces complexity compared to managing multiple local storage devices
Important
Summary S3 enables a more scalable, resilient, and flexible Karios environment by separating VM images from the hypervisor’s physical storage infrastructure.
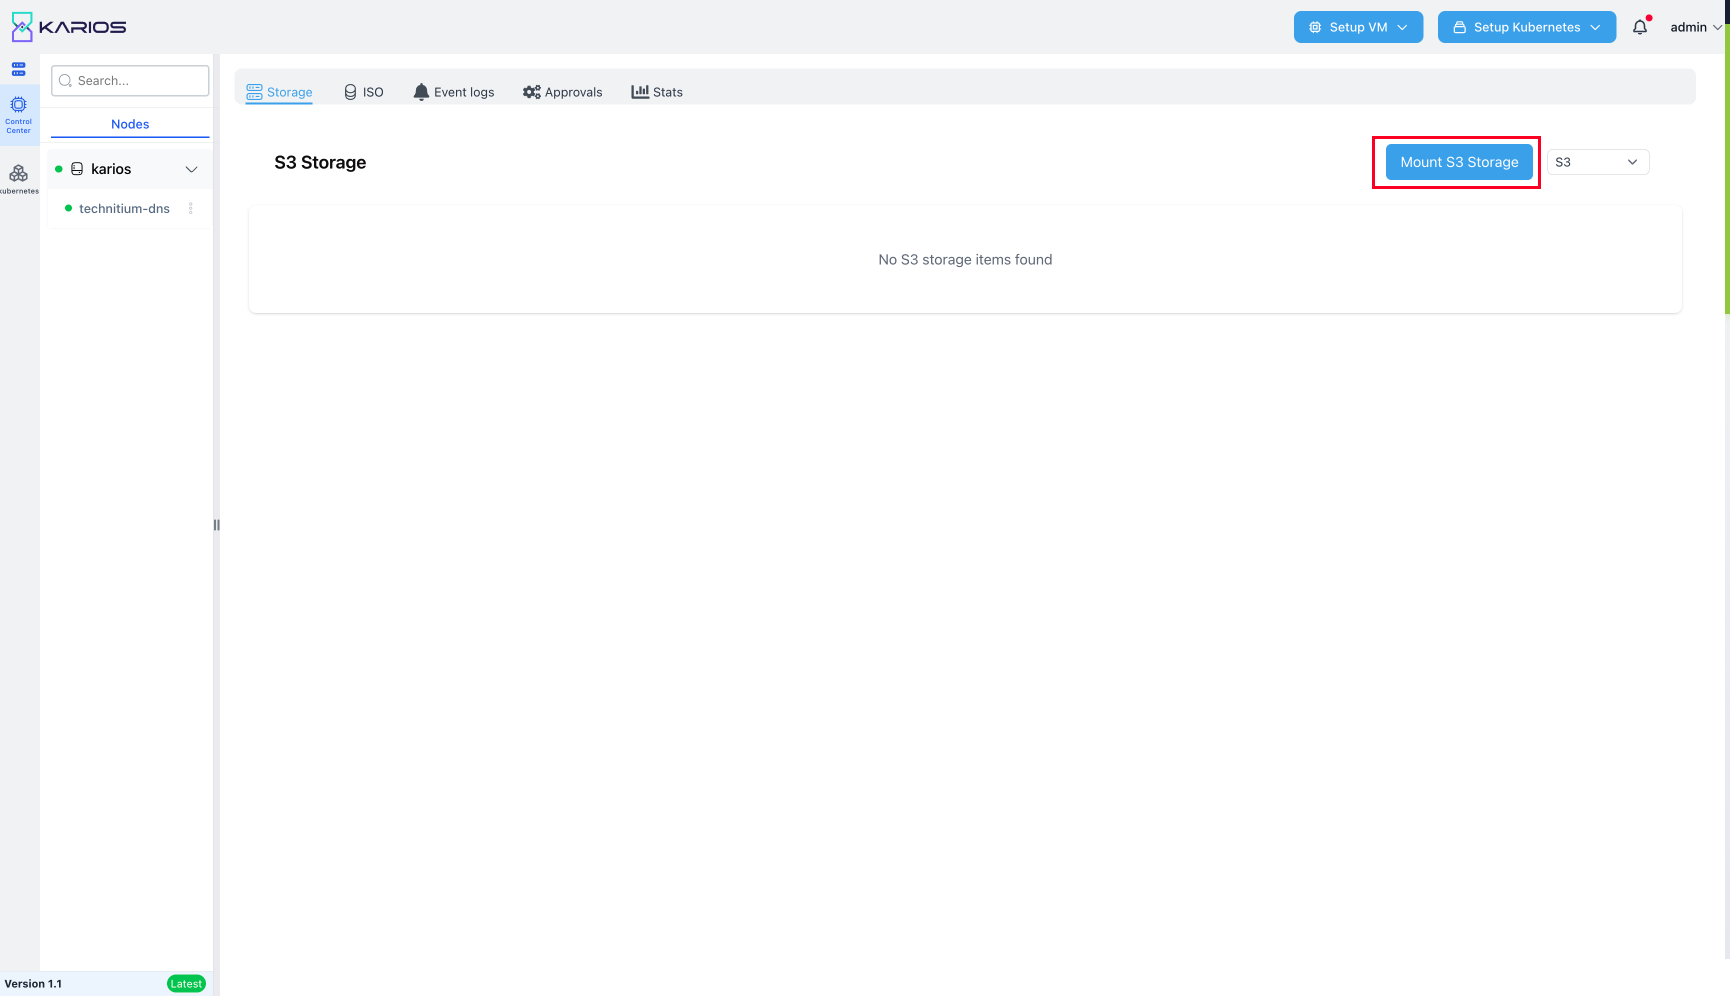
To mount S3 storage, follow these steps:
Step 1: Gather S3 Storage Information Before configuring, obtain the following details:
S3 bucket name
Access credentials (Access Key and Secret Key)
S3 endpoint URL or region information
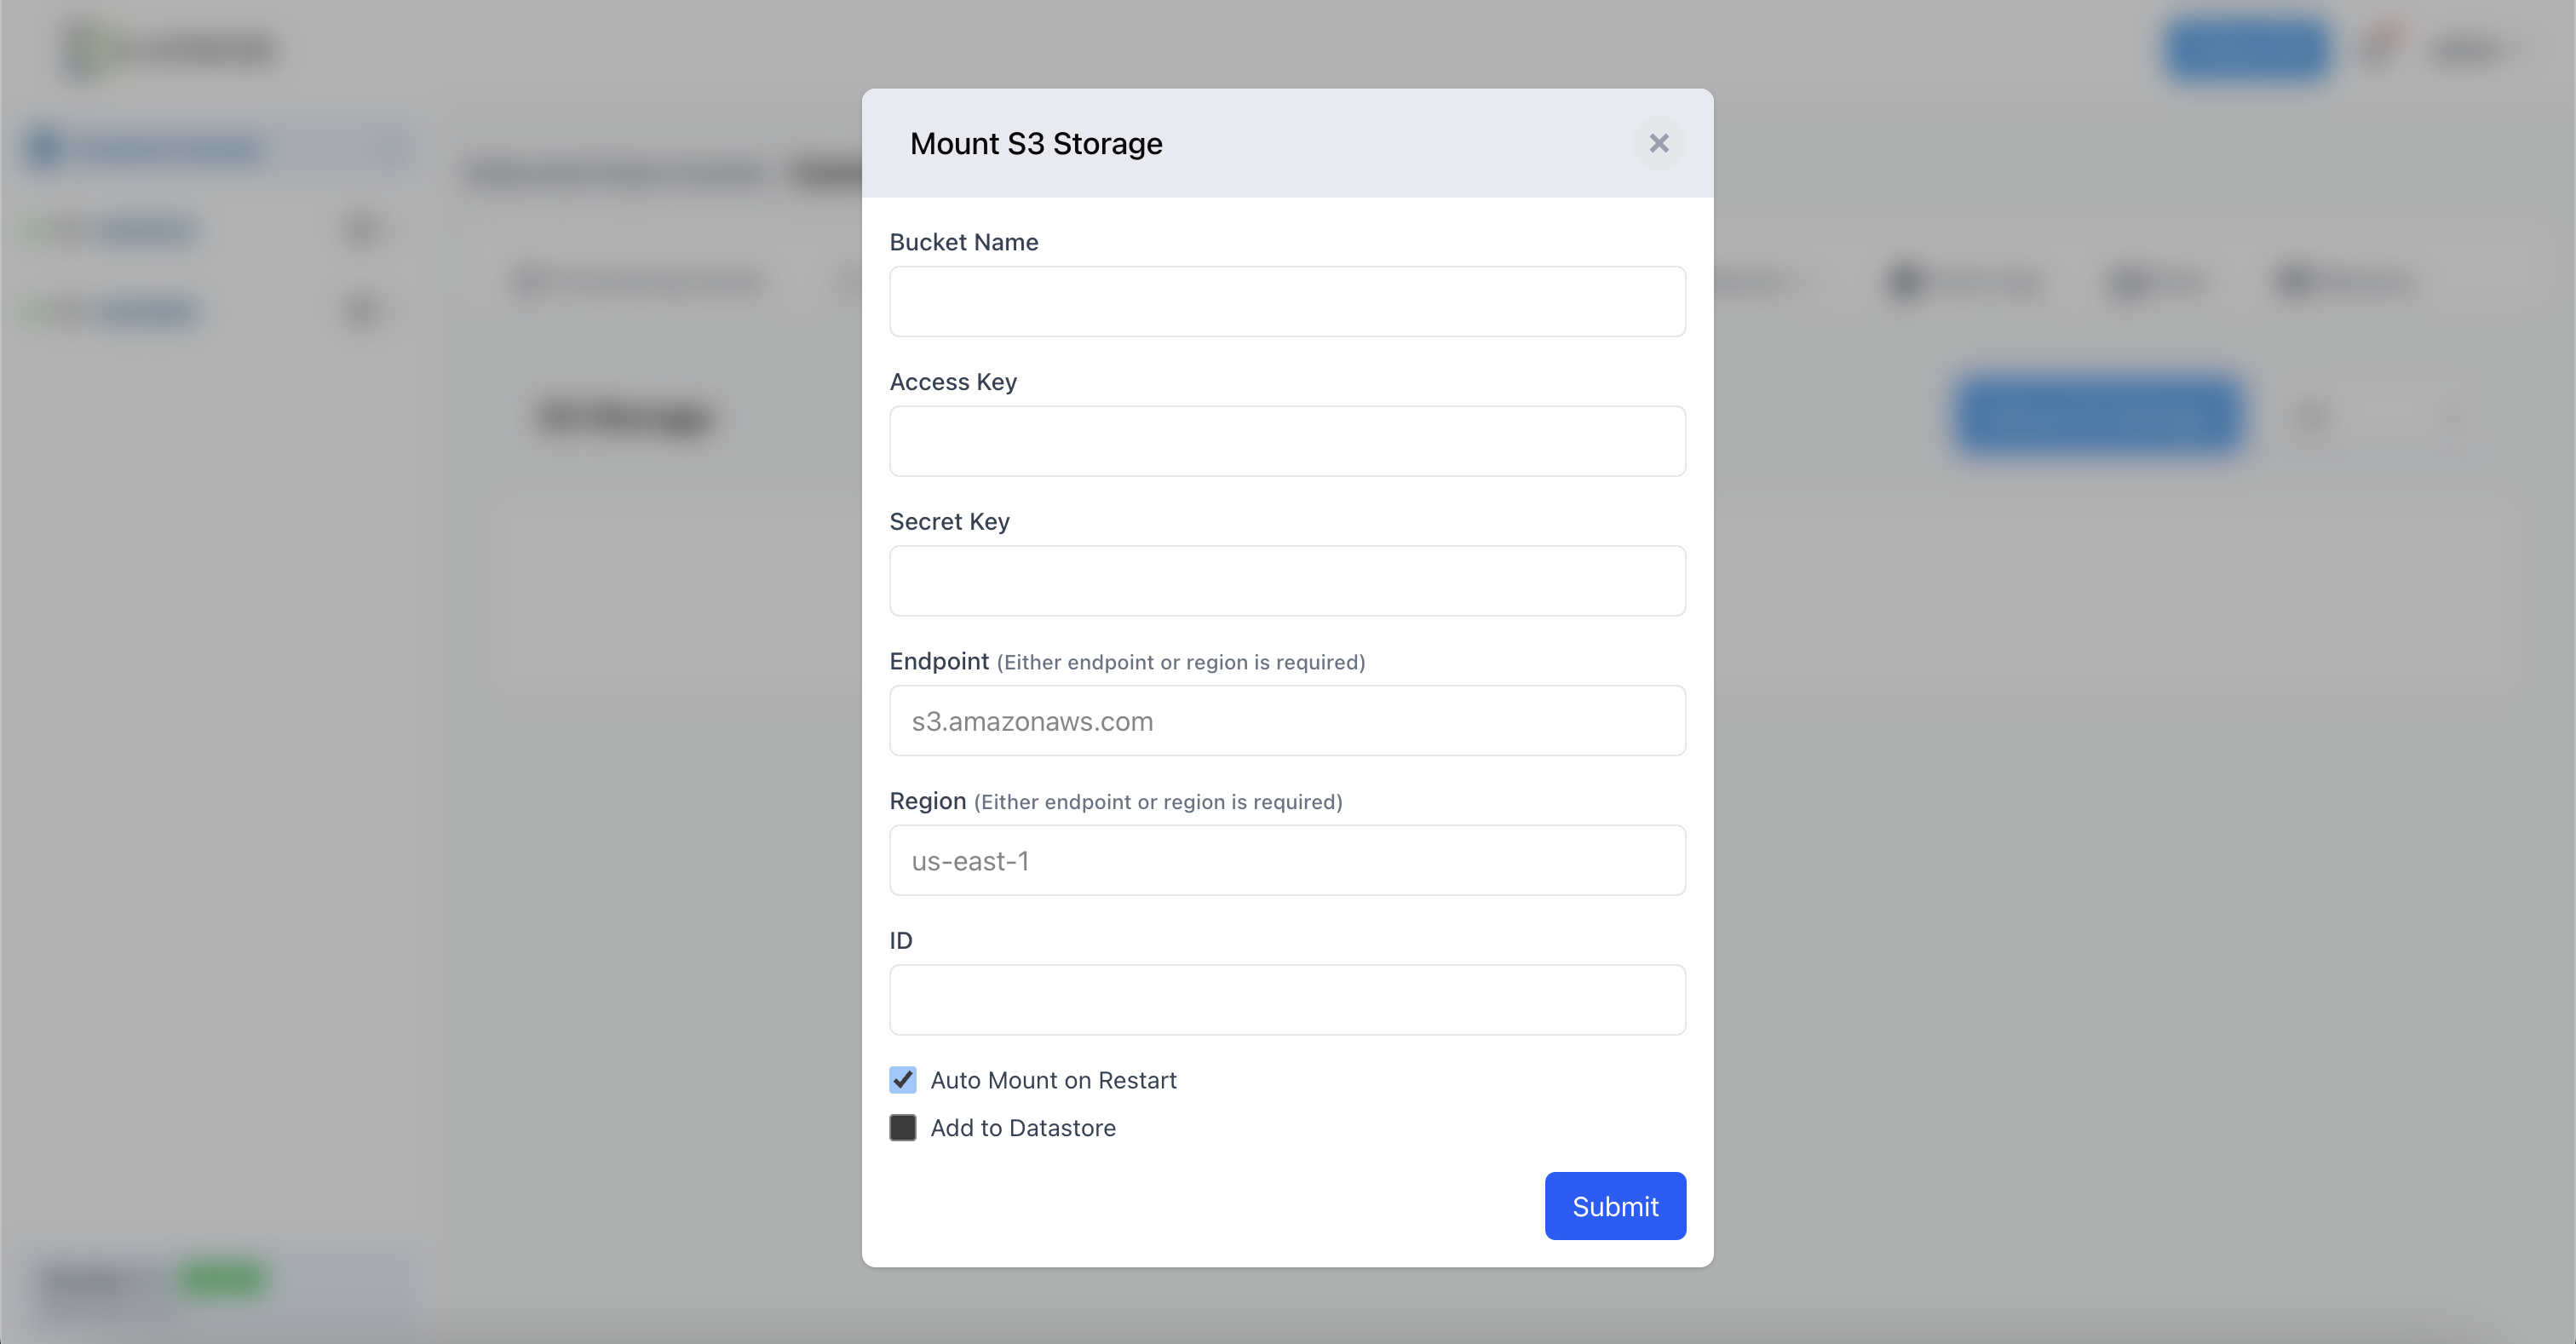
Step 2: Configure S3 Mount
Bucket Name: Enter the name of your S3 bucket you want to access
Tip
An AWS bucket is a container within Amazon S3 that securely stores objects (files and their metadata) in the cloud, offering scalability, durability, and various configuration options for different use cases.
Access Key: Enter your S3 access key ID for authentication
Tip
A bucket access key is a unique set of credentials, an Access Key ID and Secret Access Key that allows users or applications to authenticate and interact with an AWS S3 bucket.
Secret Key: Enter your S3 secret access key for authentication
Tip
The bucket secret key, also known as the Secret Access Key, is a confidential string of characters paired with an Access Key ID that authenticates requests made to your AWS S3 bucket.
Endpoint: Enter the S3 endpoint URL (e.g., s3.amazonaws.com)
Tip
The URL of the S3 service endpoint for your region (e.g., s3.amazonaws.com for global, or s3.us-west-2.amazonaws.com for specific regions). For S3-compatible services, this would be the custom endpoint URL
Region: Enter the S3 region (e.g., us-east-1) or leave default
Tip
An S3 region is a geographical location where your Amazon S3 bucket’s data is physically stored, impacting latency, cost, and compliance considerations.
ID: Enter a name to identify this storage mount (e.g., “karios”)
Tip
An S3 Access Key ID is a public identifier that acts as the first part of your credentials for authenticating requests to access your Amazon S3 bucket.
Step 3: Configure Options
✓ Auto Mount on Restart: Check this to automatically connect to storage when system restarts
✓ Add to Datastore: Check this to make the storage available for virtual machines
Step 4: Complete Setup Click Submit to save the configuration and mount the S3 storage.
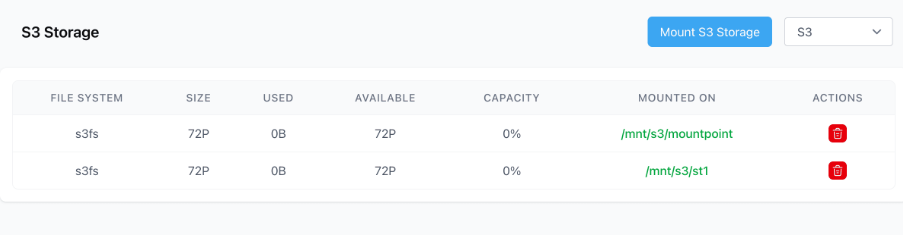
Storage Status: Monitor S3 storage availability and connection status
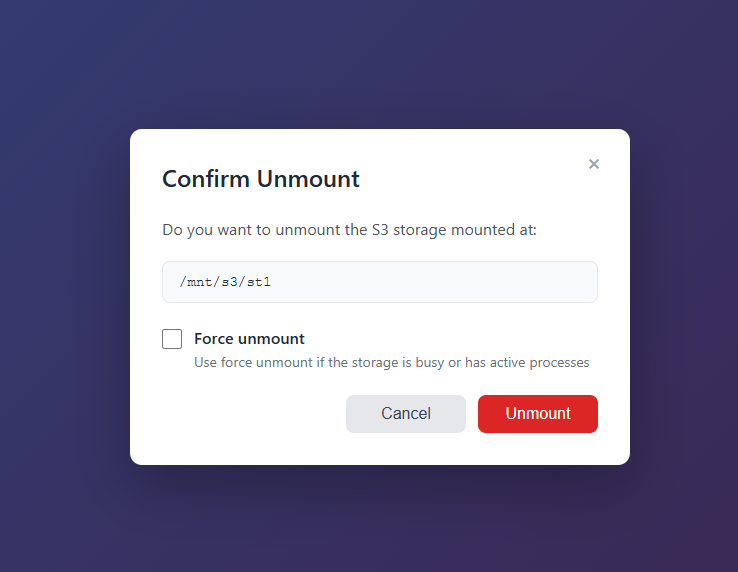
Click Delete to unmount the S3 storage. Click “unmount” to confirm the removal of S3 storage.
iSCSI Storage
iSCSI Block Storage: iSCSI provides block-level storage access over IP networks, enabling remote storage to appear as locally attached disks. It’s commonly used for shared storage in virtualization environments and high-performance database applications.
iSCSI integration provides Karios with flexible, centralized block storage that delivers:
Improved performance through dedicated storage networks
Enhanced reliability via centralized storage management
Better manageability with unified storage administration
Scalable architecture supporting infrastructure growth
Storage Benefits
Benefit |
Description |
|---|---|
Centralized Storage |
Simplifies management and enables easy scaling of storage capacity as infrastructure grows |
High Availability |
Supports live VM migration between hosts without data loss, ensuring continuous operations |
Cost-Effective |
Provides SAN functionality at a lower cost than traditional Fibre Channel solutions |
Understanding iSCSI Terms:
Target: An iSCSI target is the storage device or service on the remote server that provides the actual storage space. It’s identified by an IQN (iSCSI Qualified Name) and contains one or more LUNs (Logical Unit Numbers).
Mount: Mounting makes the connected iSCSI storage accessible to the operating system as a usable disk or file system. After mounting, the remote storage appears as a local disk that can be used for data storage.
Connect to iSCSI Target: Click “Connect to iSCSI Target” to establish iSCSI connections

Step 1: Gather iSCSI Target Information Before configuring, obtain the following details:
iSCSI target server IP address
Target name (IQN - iSCSI Qualified Name)
Authentication credentials (username and password)
Step 2: Configure iSCSI Connection
Portal: Enter the IP address of your iSCSI target server (e.g., 192.168.116.113)
Tip
An iSCSI portal is the combination of an IP address and TCP port (typically 3260) that defines a specific endpoint for initiating or accepting iSCSI connections, essentially acting as the doorway for communication between an initiator and target.
Target: Enter the iSCSI target name (e.g., iqn.store.ai.karios:storage.lun1)
Username: Enter the authentication username for the iSCSI target (e.g., admin)
Tip
An iSCSI username is a credential used for authentication when connecting to an iSCSI target, ensuring only authorized initiators can access the shared storage.
Password: Enter the authentication password for the iSCSI target
Tip
An iSCSI password, paired with a username, provides secure authentication for clients accessing an iSCSI target, verifying their identity before granting storage access.
Step 3: Complete Connection Click Submit to establish the iSCSI connection and make the storage available as a block device.
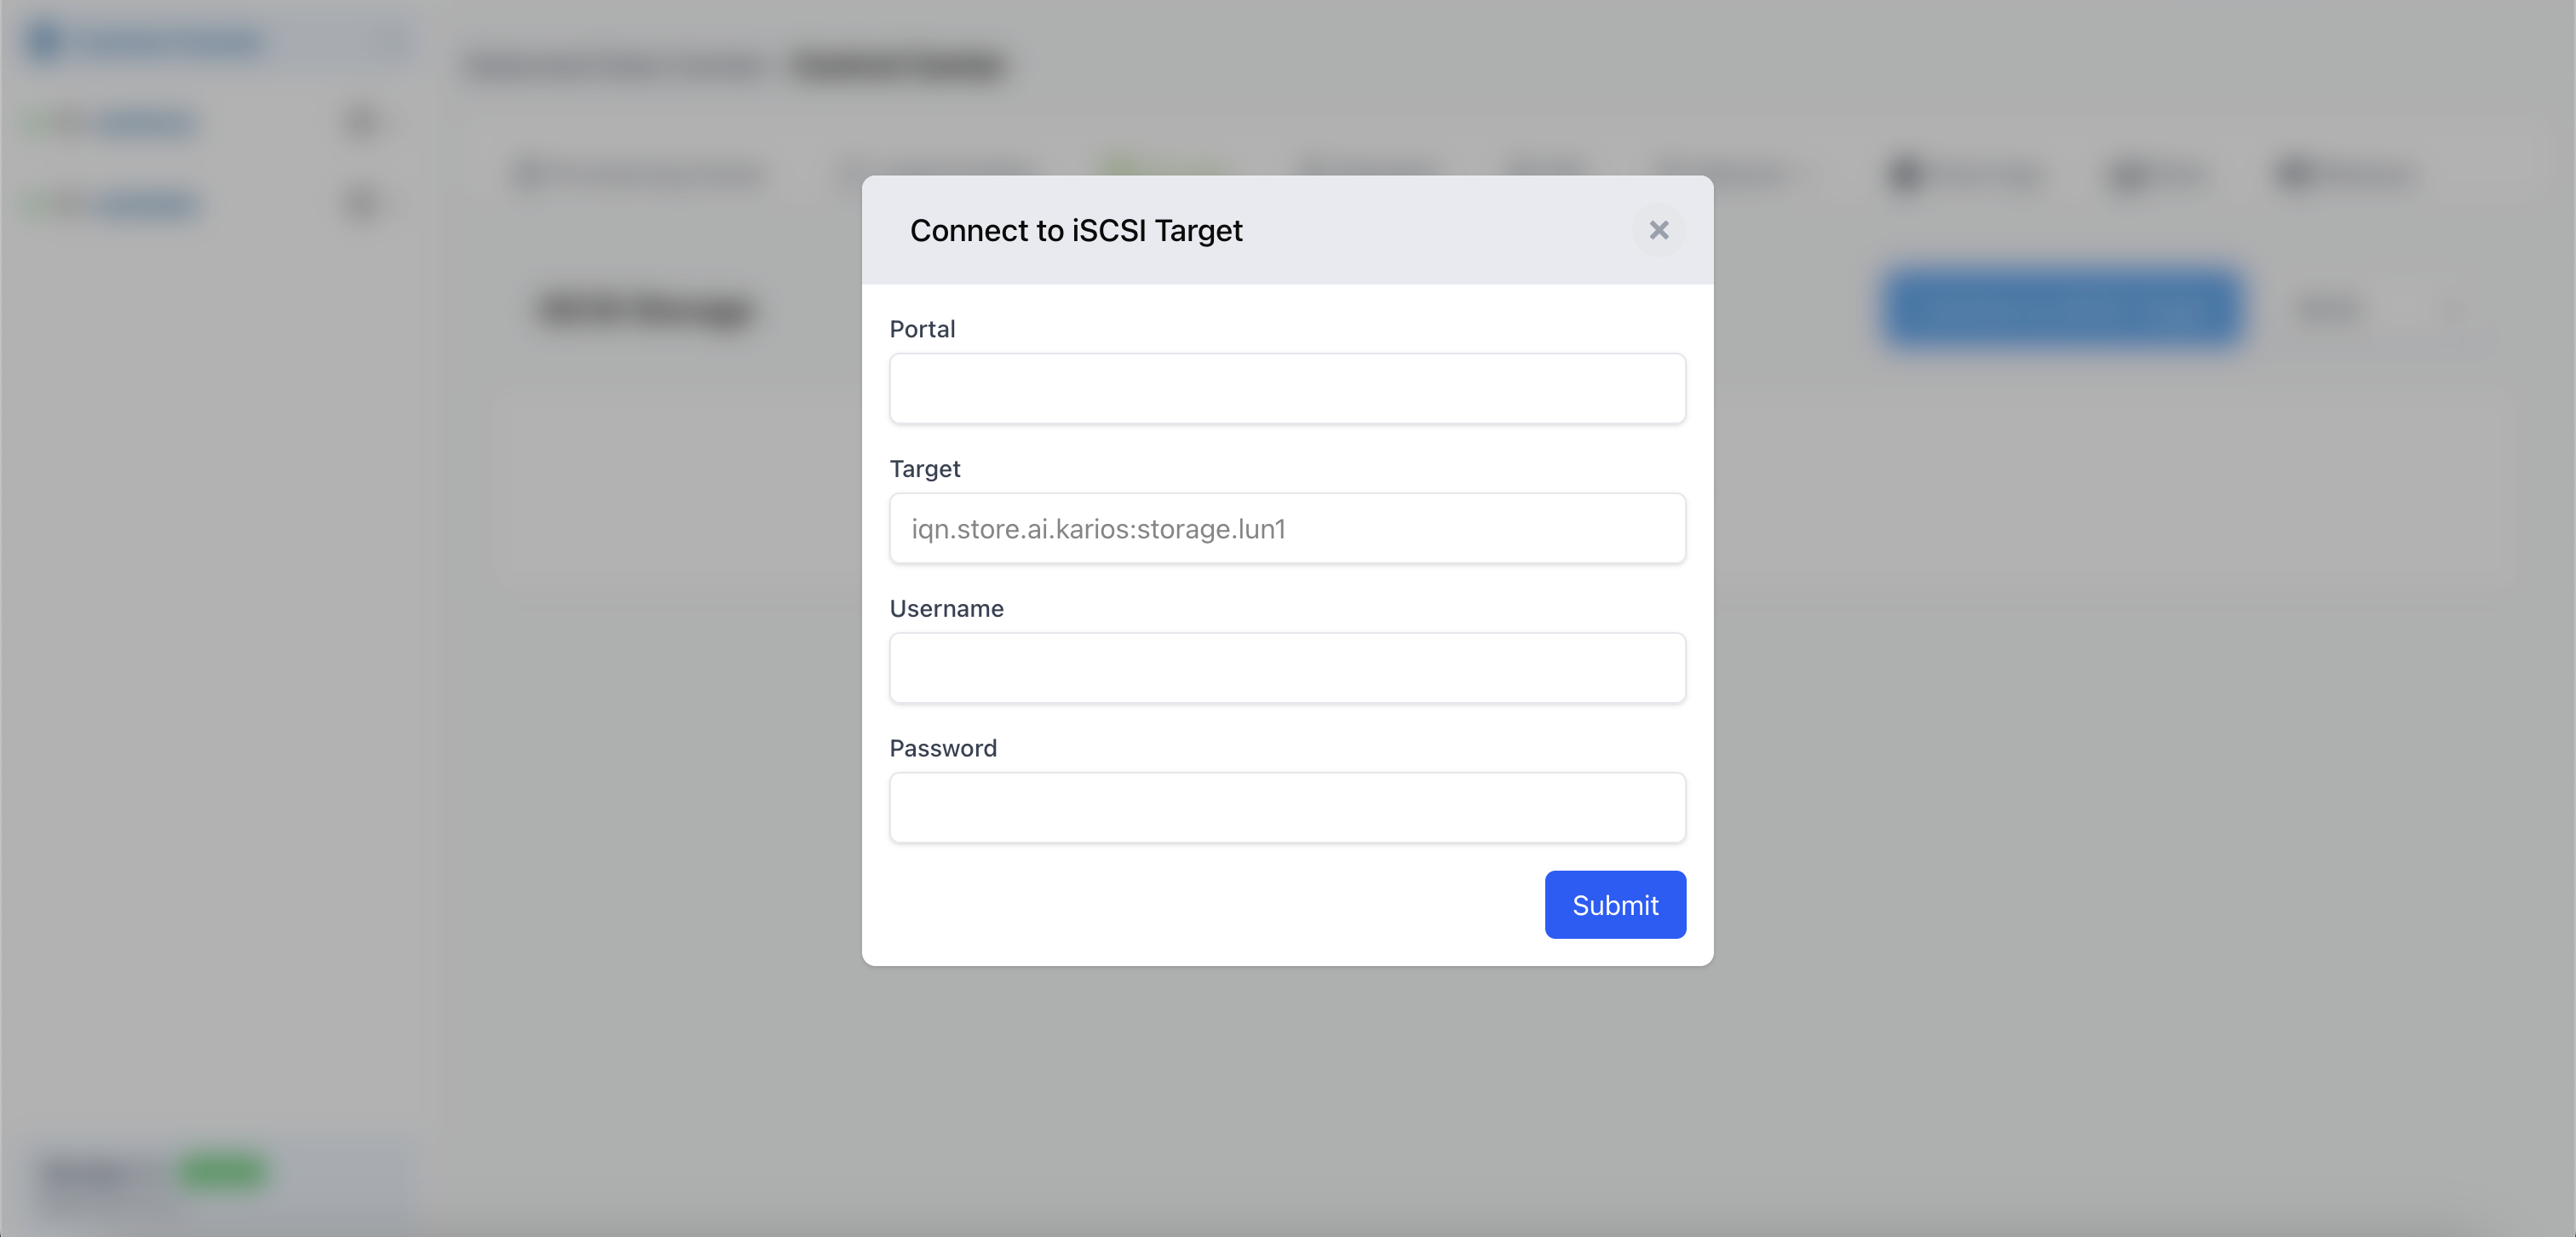
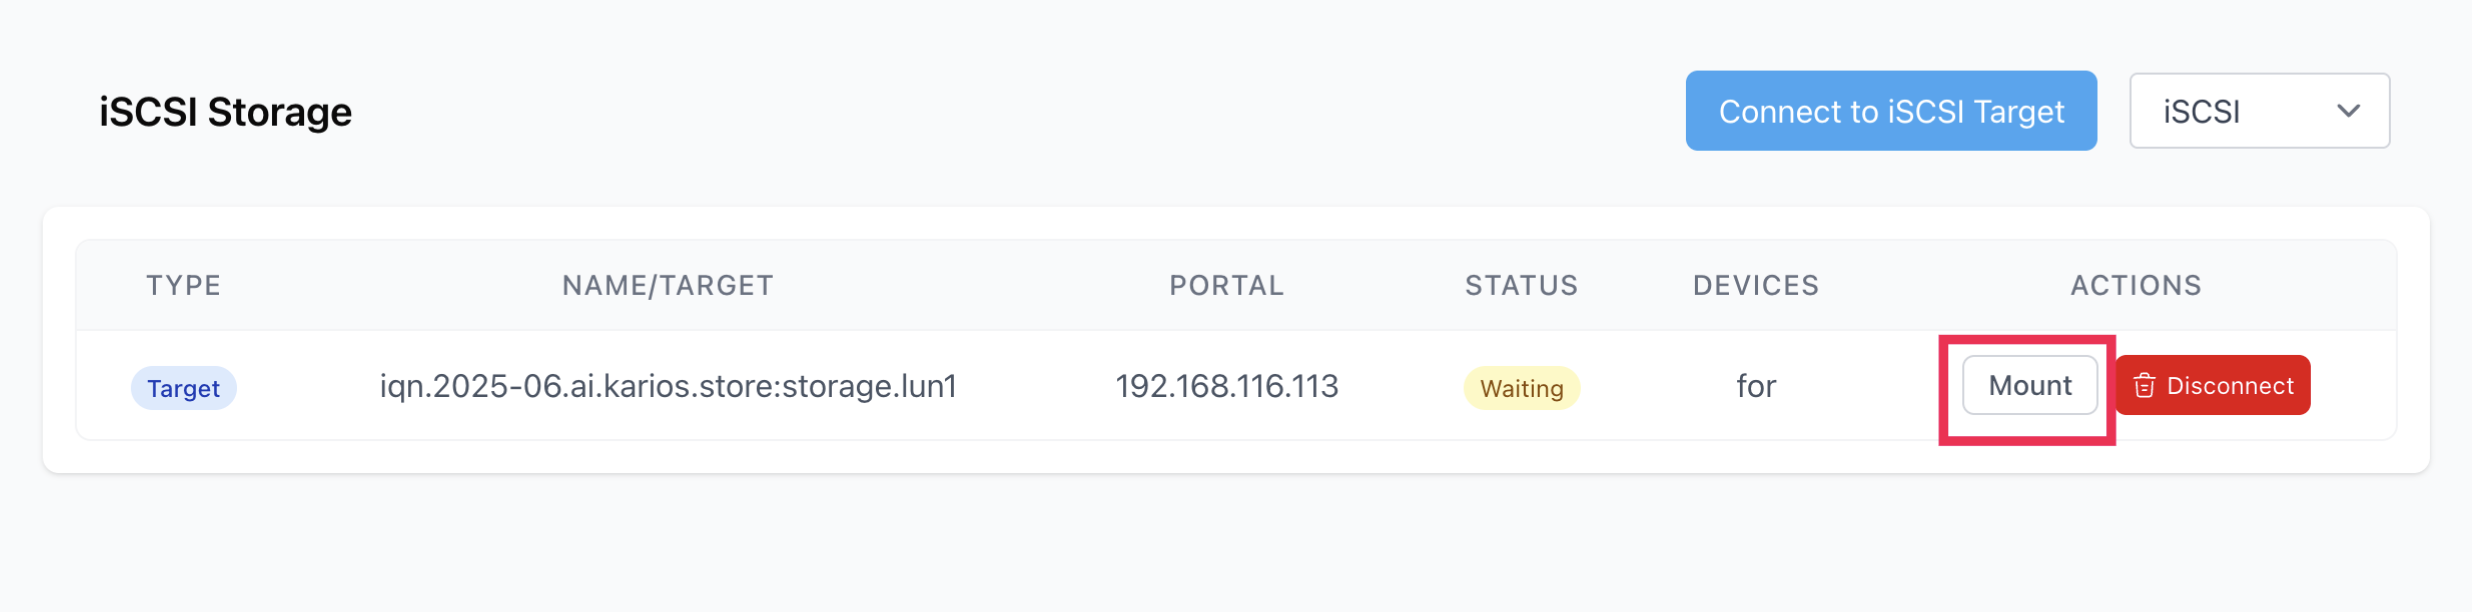
To mount iSCSI devices, follow these steps:
After connecting to an iSCSI target, you need to mount the discovered devices to make them accessible for storage operations.
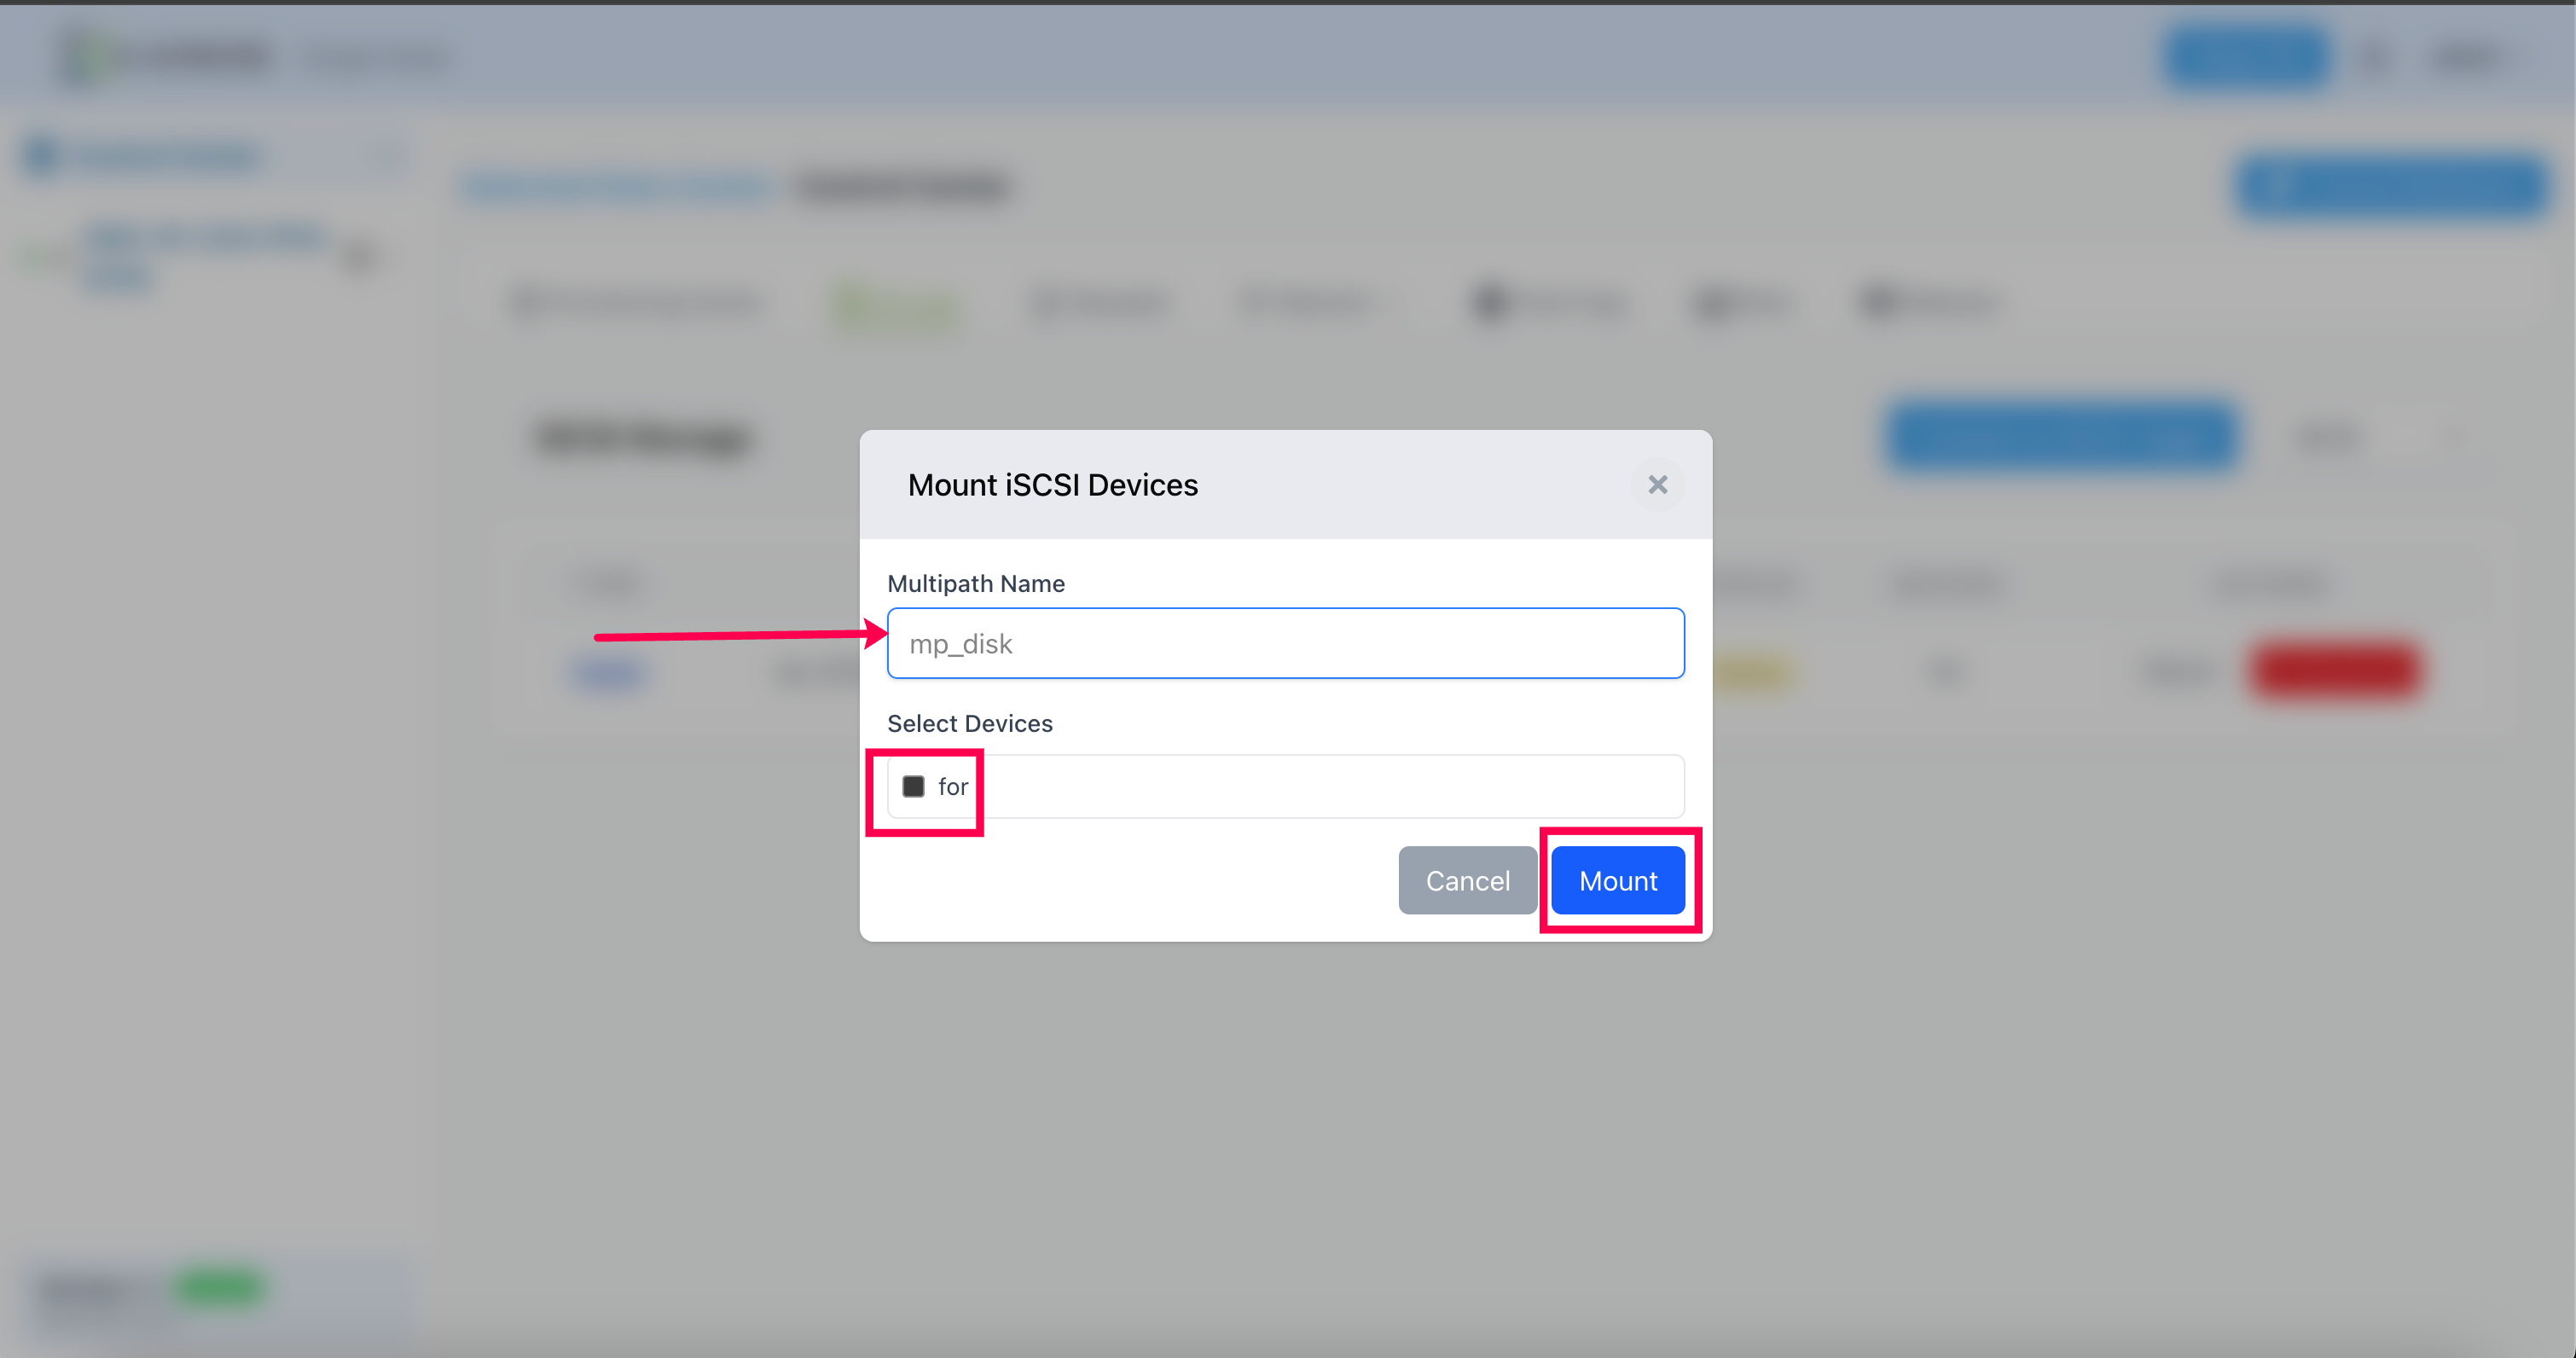
Step 1: Configure Multipath Settings
Multipath Name: Enter a name for the multipath device (e.g., “mp_disk”)
Tip
The Multipath Name is essentially the logical name you assign to the multipath device created from multiple iSCSI paths.
Select Devices: Choose the iSCSI devices you want to include in the multipath configuration
Device Selection: Check the boxes for available devices (e.g., “da1”)
Verify Selection: Confirm your selected devices are listed correctly
Step 2: Complete Mount Process Click Mount to mount the selected iSCSI devices and make them available for use.
Device Actions: These are the following actions that can be performed on an iSCSI storage device.
Mount: Makes the iSCSI storage accessible to the system as a usable disk drive
Disconnect: Terminates the connection to the iSCSI target while preserving configuration
Remove Device: Completely removes the device from the system configuration
Destroy Path: Removes the multipath configuration and destroys the path mapping
NFS Storage
NFS File Storage: NFS (Network File System) allows you to access files on remote servers as if they were stored locally on your system. It’s commonly used for shared storage in Unix/Linux environments and virtualization platforms.
NFS Advantages for Hypervisors
For hypervisors like Karios, NFS offers several crucial advantages:
- Shared Storage
The primary benefit of NFS integration. NFS allows multiple Karios hosts to access and use the same VM disk images (.raw files). This shared access is essential for advanced hypervisor features like live migration.
- Live Migration Support (Future)
Moving a running virtual machine from one Karios host to another becomes feasible with NFS. Since both hosts access the same storage, the VM’s data remains accessible during migration, minimizing downtime.
- Centralized Management
Simplifies storage administration by consolidating management at the NFS server level rather than managing storage individually on each hypervisor host.
- Scalability & Flexibility
Enables easier storage capacity scaling by adding resources to the NFS server without modifying individual Karios hosts. This approach also provides flexibility in storage hardware selection, removing dependency on directly attached storage.
- Cost-Effectiveness
Can provide more economical storage solutions compared to dedicated SAN implementations, particularly beneficial for smaller deployments.
Implementation Benefits
Operational Advantages:
Unified storage management across multiple hypervisor hosts
Simplified backup and disaster recovery procedures
Reduced storage hardware complexity per host
Enhanced resource utilization through shared storage pools
Technical Considerations:
Network bandwidth requirements for storage traffic
NFS server performance impact on VM operations
Network reliability requirements for storage availability

To mount NFS storage, follow these steps: Click “Mount NFS Storage” to configure NFS connections
Step 1: Select NFS Server
NFS Server: Enter the IP address or hostname of your NFS server (e.g., 192.168.116.113)
Click Next to proceed to mount configuration
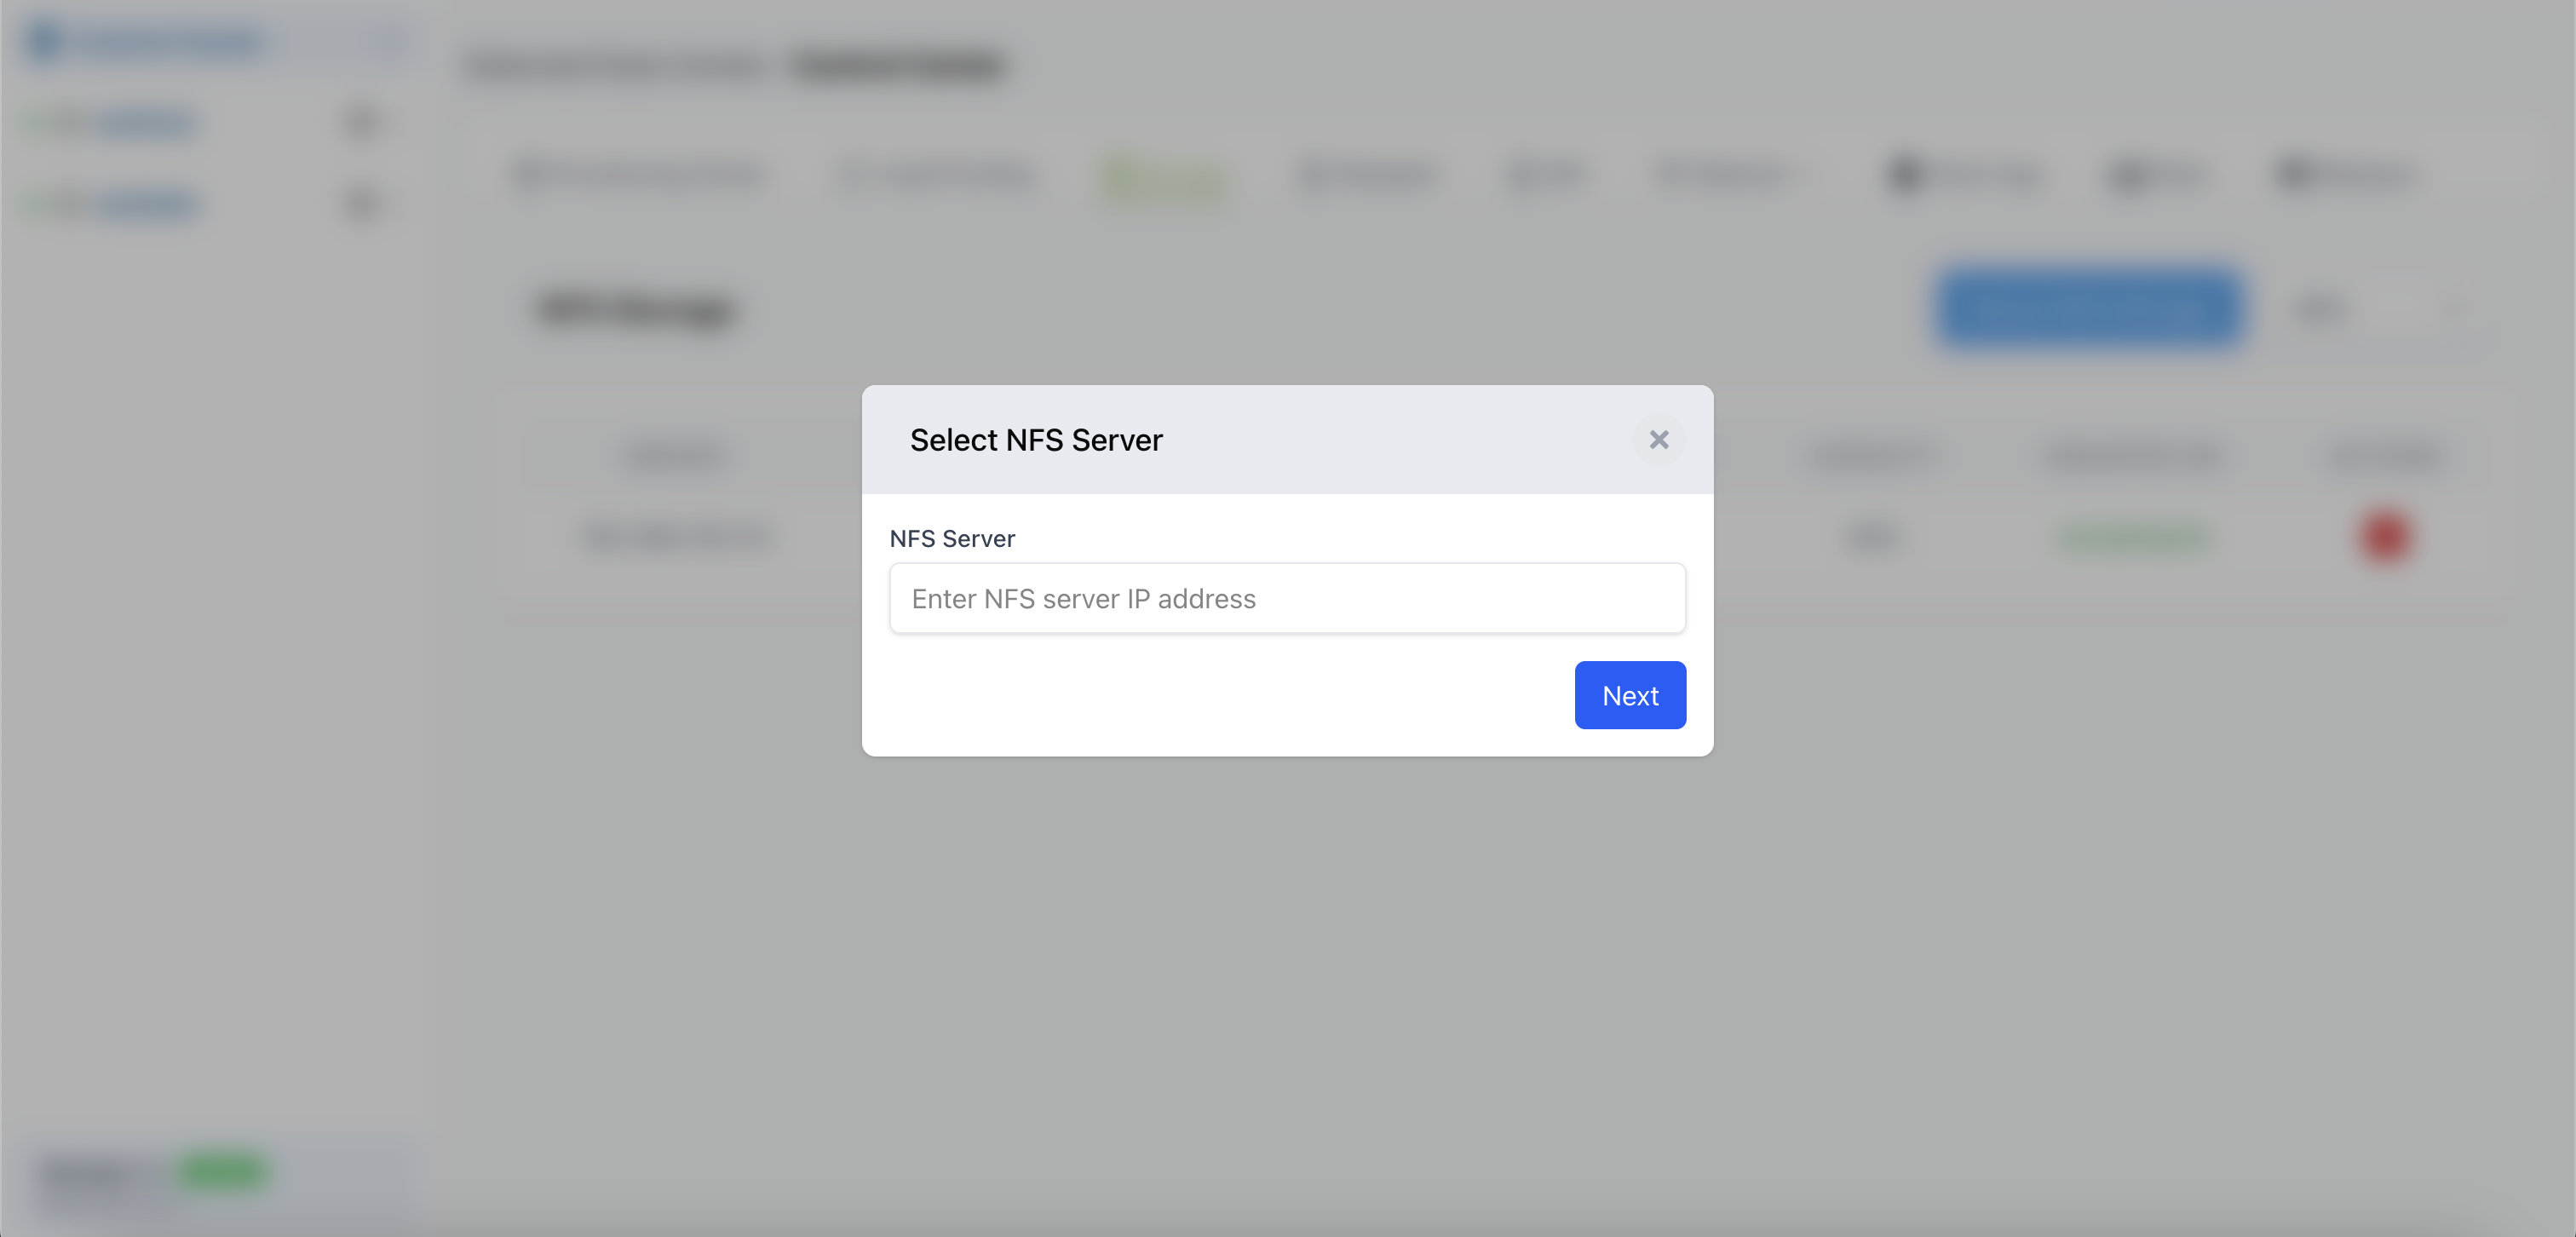
Step 2: Configure NFS Mount
ID: Enter a name to identify this storage mount
Tip
An NFS ID (Network File System Identifier) is a unique identifier assigned to each client accessing an NFS server, used for access control and tracking.
Server: Enter the IP address or hostname of your NFS server (e.g., 192.168.1.100)
Tip
A network file server that runs the Network File System daemon (nfsd) and exports (shares) directories to remote client systems over a network. The NFS server manages file access permissions, handles client requests for file operations (read, write, create, delete), and maintains the shared file systems that clients can mount and access as if they were local storage.
Export Path: Enter the directory path exported by the NFS server (e.g., /exports/shared)
Tip
The directory path on the NFS server that has been configured and made available for sharing to client systems. This is the actual folder location on the server (e.g., /exports/shared, /home/data) that contains the files you want to access remotely.
Tip
Mount Point: The local directory path on the client system where the remote NFS share will be attached and accessed. This is an empty directory on your local system (e.g., /mnt/nfs-storage, /data/shared) that serves as the access point for the remote files.
Mount Options: Configuration parameters that control how the NFS file system is mounted and behaves, including NFS protocol version (NFSv3, NFSv4), read/write permissions, timeout settings, and cache behavior. These options determine the performance characteristics and access rules for the mounted file system.
Step 3: Configure Options
✓ Auto Mount on Restart: Check this to automatically mount NFS storage when system restarts
✓ Add to Datastore: Check this to make the storage available for virtual machines
✓ Enable pNFS: Check this to enable parallel NFS for improved performance (if supported)
Tip
An extension to NFSv4 that allows clients to access file data directly from multiple storage servers simultaneously, rather than routing all data through a single NFS server. This parallel access significantly improves performance and scalability by distributing I/O operations across multiple storage devices, reducing bottlenecks and enabling higher throughput for large file operations.
Step 4: Complete Setup Click Submit to save the configuration and mount the NFS storage.
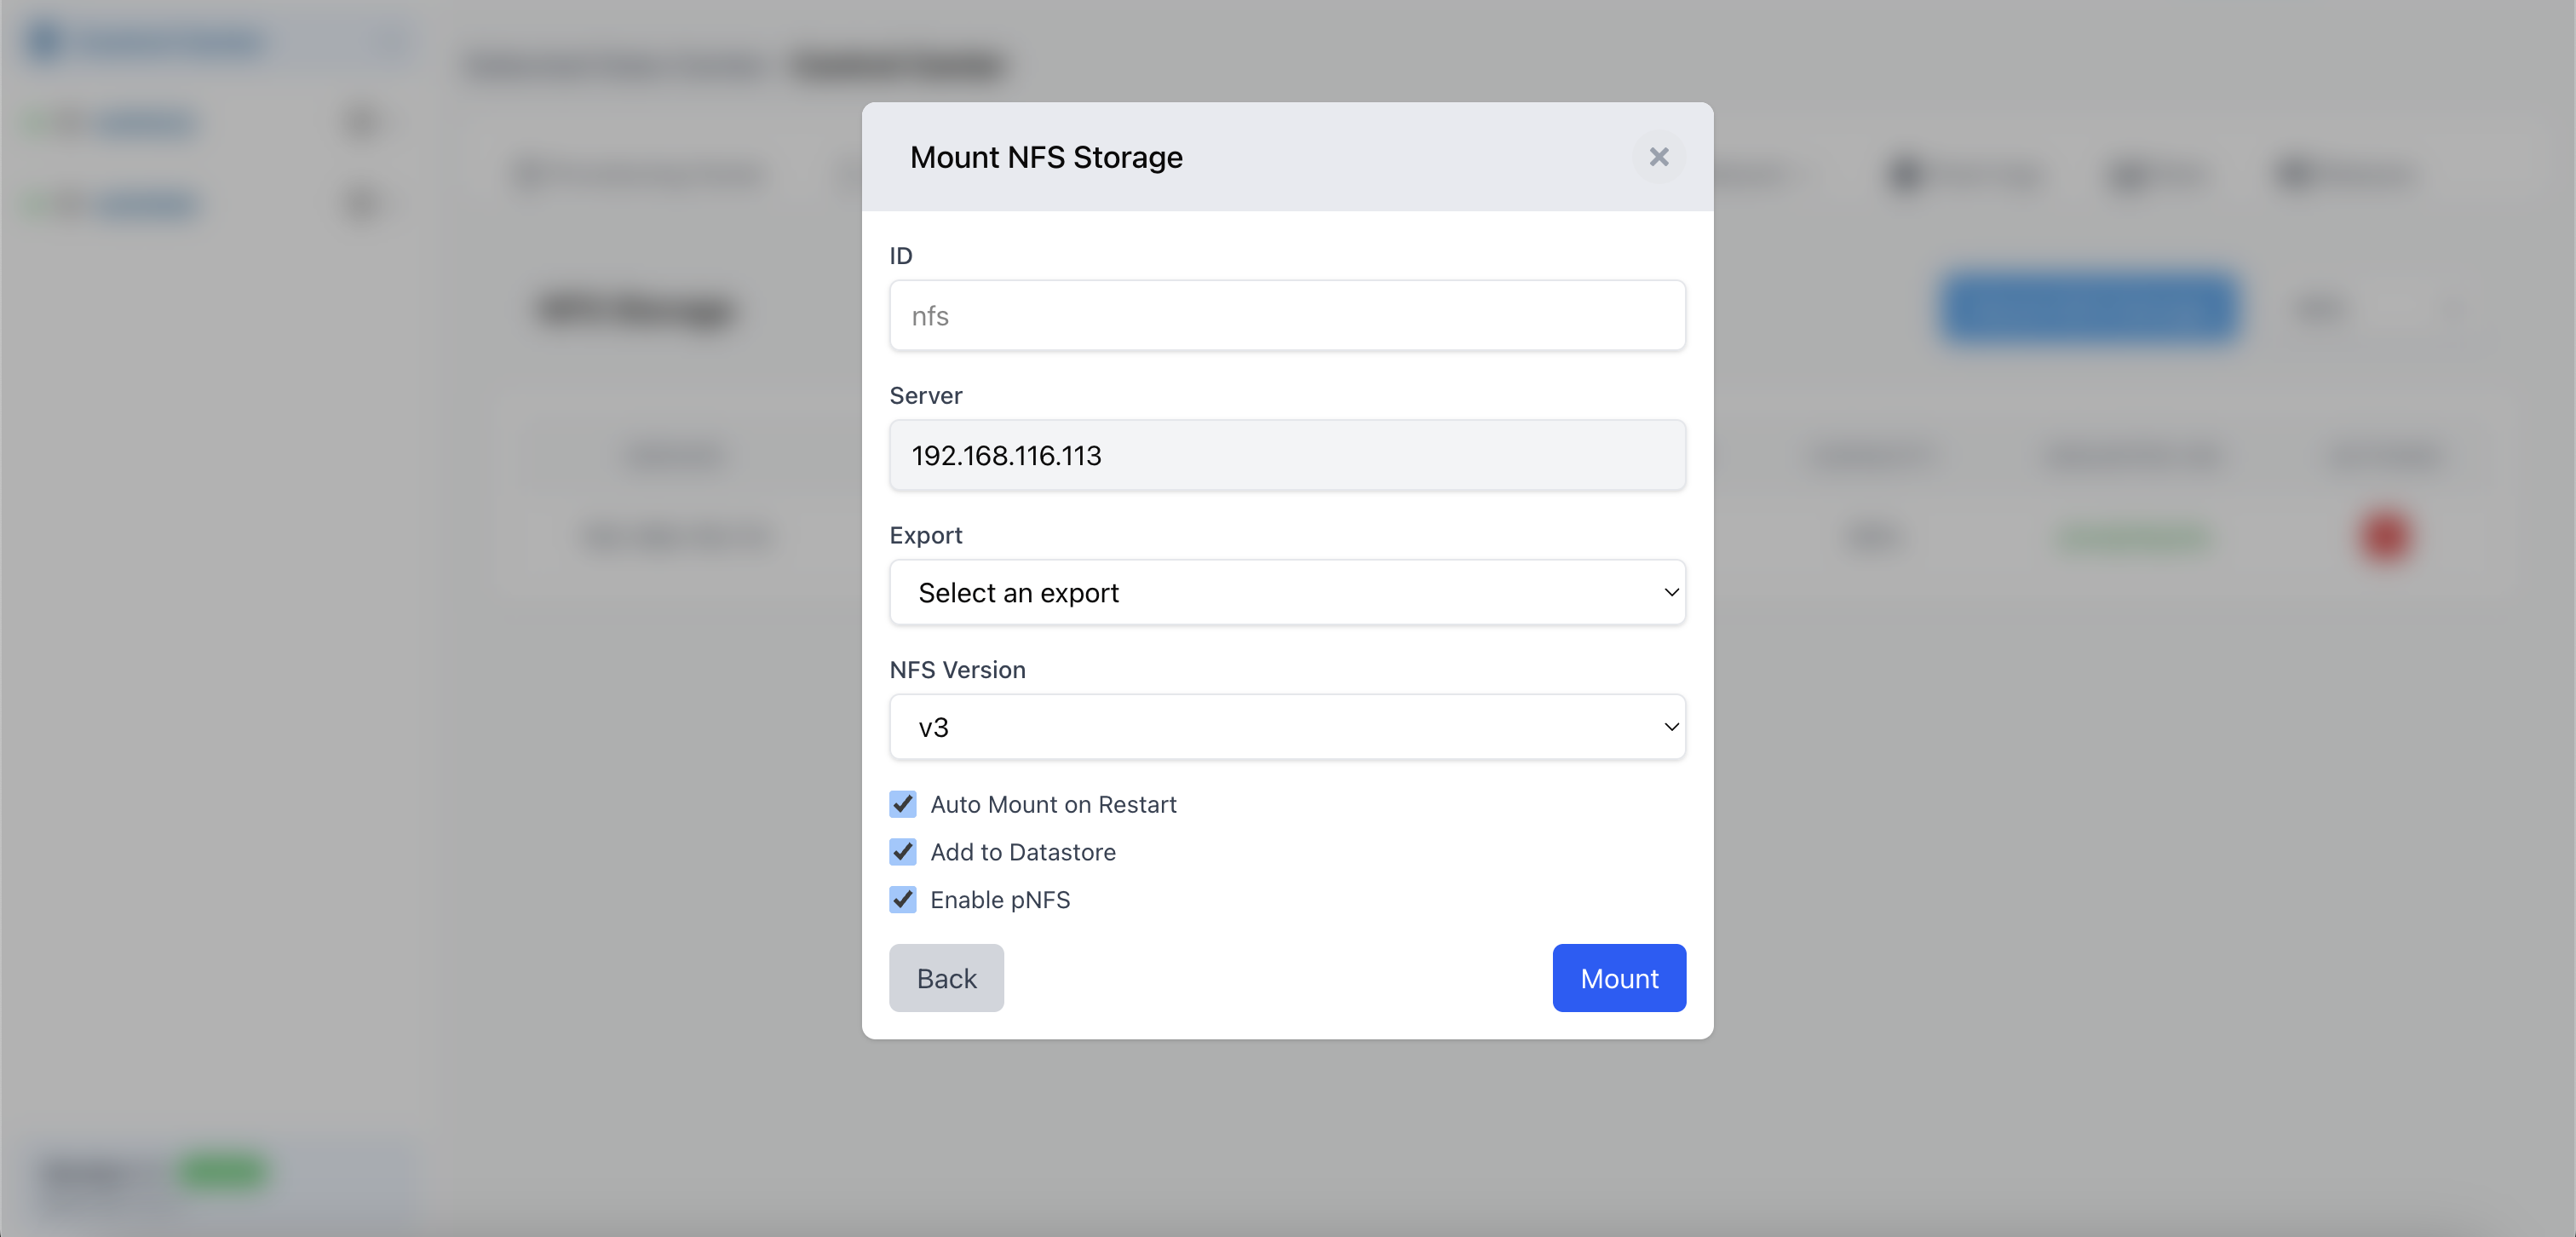
To unmount the NFS storage, please click on the delete icon

SMB Storage
SMB/CIFS Storage:
SMB (Server Message Block), formerly known as CIFS (Common Internet File System), is a network file sharing protocol primarily used by Windows environments. It allows computers to access files over a network as if they were local drives, similar to NFS functionality.
Importance for Hypervisors
For hypervisors like Karios, SMB offers valuable benefits, particularly in mixed or Windows-integrated environments:
- Windows Integration
Simplifies integration in infrastructures that heavily utilize Windows servers and Active Directory, leveraging existing expertise and tools
- Shared Storage Capabilities
Similar to NFS, SMB enables multiple Karios hosts to access the same VM disk images (.raw files), which is crucial for live migration and high availability
- Live Migration Support (Future)
Allows seamless movement of running VMs between Karios hosts since both access the same storage location, minimizing downtime during migrations
- Administrative Familiarity
For administrators experienced with Windows environments, SMB setup and management are often more straightforward than NFS alternatives
- Cost-Effective Implementation
SMB solutions can be economical, especially when leveraging existing Windows servers for file sharing
Protocol Comparison
Protocol |
Best Use Case |
Key Characteristics |
|---|---|---|
SMB/CIFS |
Windows-centric environments |
Native Windows integration, familiar management |
NFS |
Linux/Unix-centric setups |
POSIX compliance, Unix-native features |
SAN |
High-performance requirements |
Superior performance but higher cost and complexity |
Storage Decision Factors
Choose SMB when:
Infrastructure has strong Windows presence
Existing Windows file sharing infrastructure available
Administrative team has Windows storage expertise
Integration with Active Directory is required

Mount SMB/CIFS Storage: Click “Mount SMB/CIFS Storage” to configure SMB connections and follow these steps:
Step 1: Gather SMB Server Information Before configuring, obtain the following details:
SMB server IP address or NetBIOS name
Share name on the SMB server
Authentication credentials (username and password)
Step 2: Configure SMB Mount
ID: Enter a name to identify this SMB mount (e.g., “karios”)
NetBIOS Name: Enter the Windows computer name or NetBIOS name (e.g., “DESKTOP-FHPF4OS”)
Tip
A NetBIOS name is a legacy computer name used in Windows networking that can be utilized when specifying the server address for mounting SMB/CIFS shares.
Server: Enter the IP address of your SMB server (e.g., 192.168.111.230)
Tip
An SMB (Server Message Block) / CIFS (Common Internet File System) server allows users on a network to share files, printers, and other resources using the Windows networking protocol.
Share: Enter the name of the shared folder (e.g., “shared-folder”)
Tip
An SMB share is a designated folder on an SMB/CIFS server that’s made accessible to other computers on the network for file sharing.
Username: Enter your SMB authentication username (e.g., “smbuser”)
Tip
An SMB username is a specific account name used to authenticate and access resources (like files and folders) on an SMB/CIFS share, separate from your local computer’s login.
Password: Enter your SMB authentication password
Tip
An SMB password is the secret credential associated with an SMB username, required for authentication when accessing shared resources on an SMB/CIFS server.
Step 3: Configure Options
✓ Auto Mount on Restart: Check this to automatically mount SMB storage when system restarts
✓ Add to Datastore: Check this to make the storage available for virtual machines
Step 4: Complete Setup Click Submit to save the configuration and mount the SMB storage.
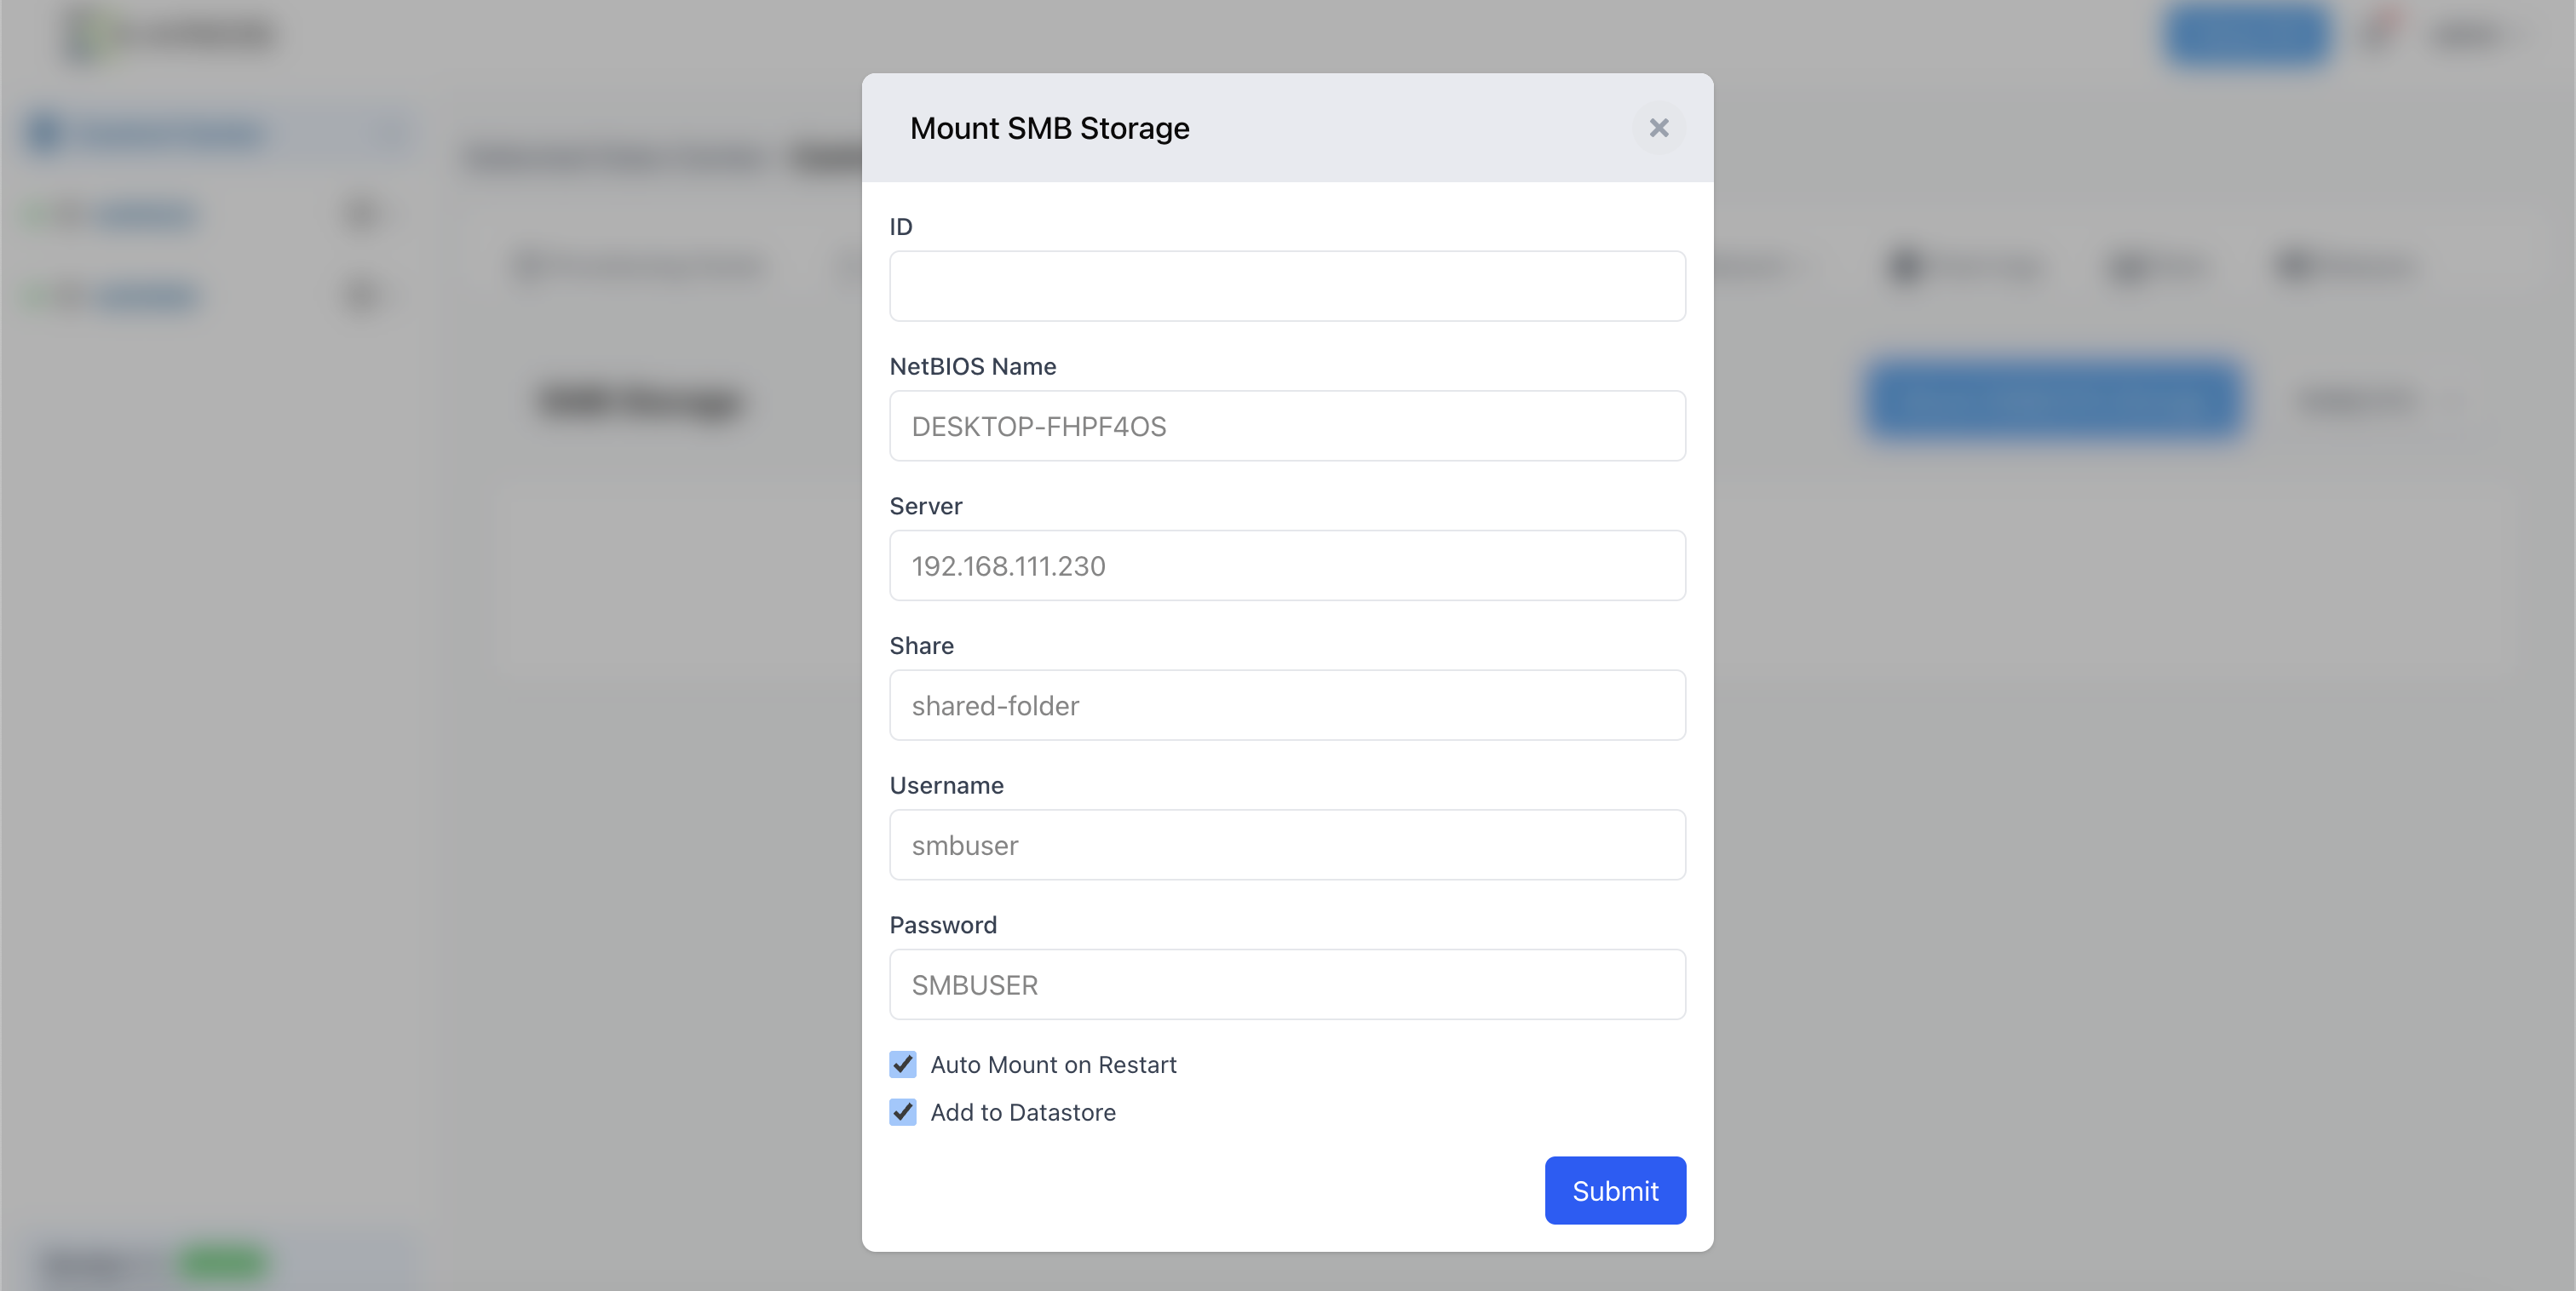
SMB Server Configuration: SMB/CIFS server connections.
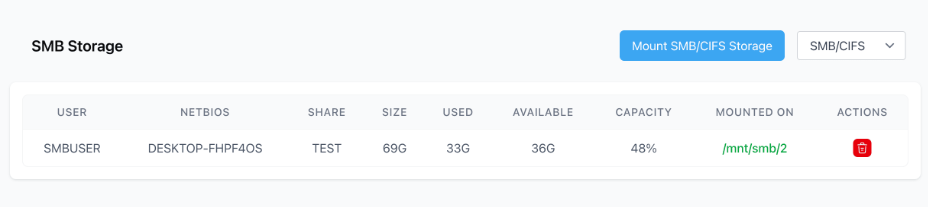
Unmount: Click on the “delete” icon to unmount SMB storage.
Storage Operations
Common Storage Operations:
Mount/Unmount: Mount and unmount storage systems
Connection Management: Connect and disconnect from storage targets
Capacity Monitoring: Real-time storage usage and capacity monitoring
Status Tracking: Monitor connection status and storage health
Configuration Management: Configure storage protocol settings
Storage Management Features:
Protocol Selection: Dropdown selection for different storage protocols
Unified Interface: Single interface for all storage protocol management
Real-time Monitoring: Live storage metrics and status updates
Action Controls: Direct action buttons for storage operations
Storage Analytics: Detailed storage usage and performance metrics
For detailed information regarding storage protocols, configuration options, advanced features, and comprehensive storage management, please refer to Flexible Storage.
ISO Operations:
Download ISO: Download ISO files using FQDN URL with appended ISO file path
Upload ISO: Upload valid ISO files to the data center storage
RAW File Support: Upload and manage RAW disk image files
File Selection: Browse and select from available ISO and RAW files
Availability Tracking: Real-time view of available ISO and RAW files
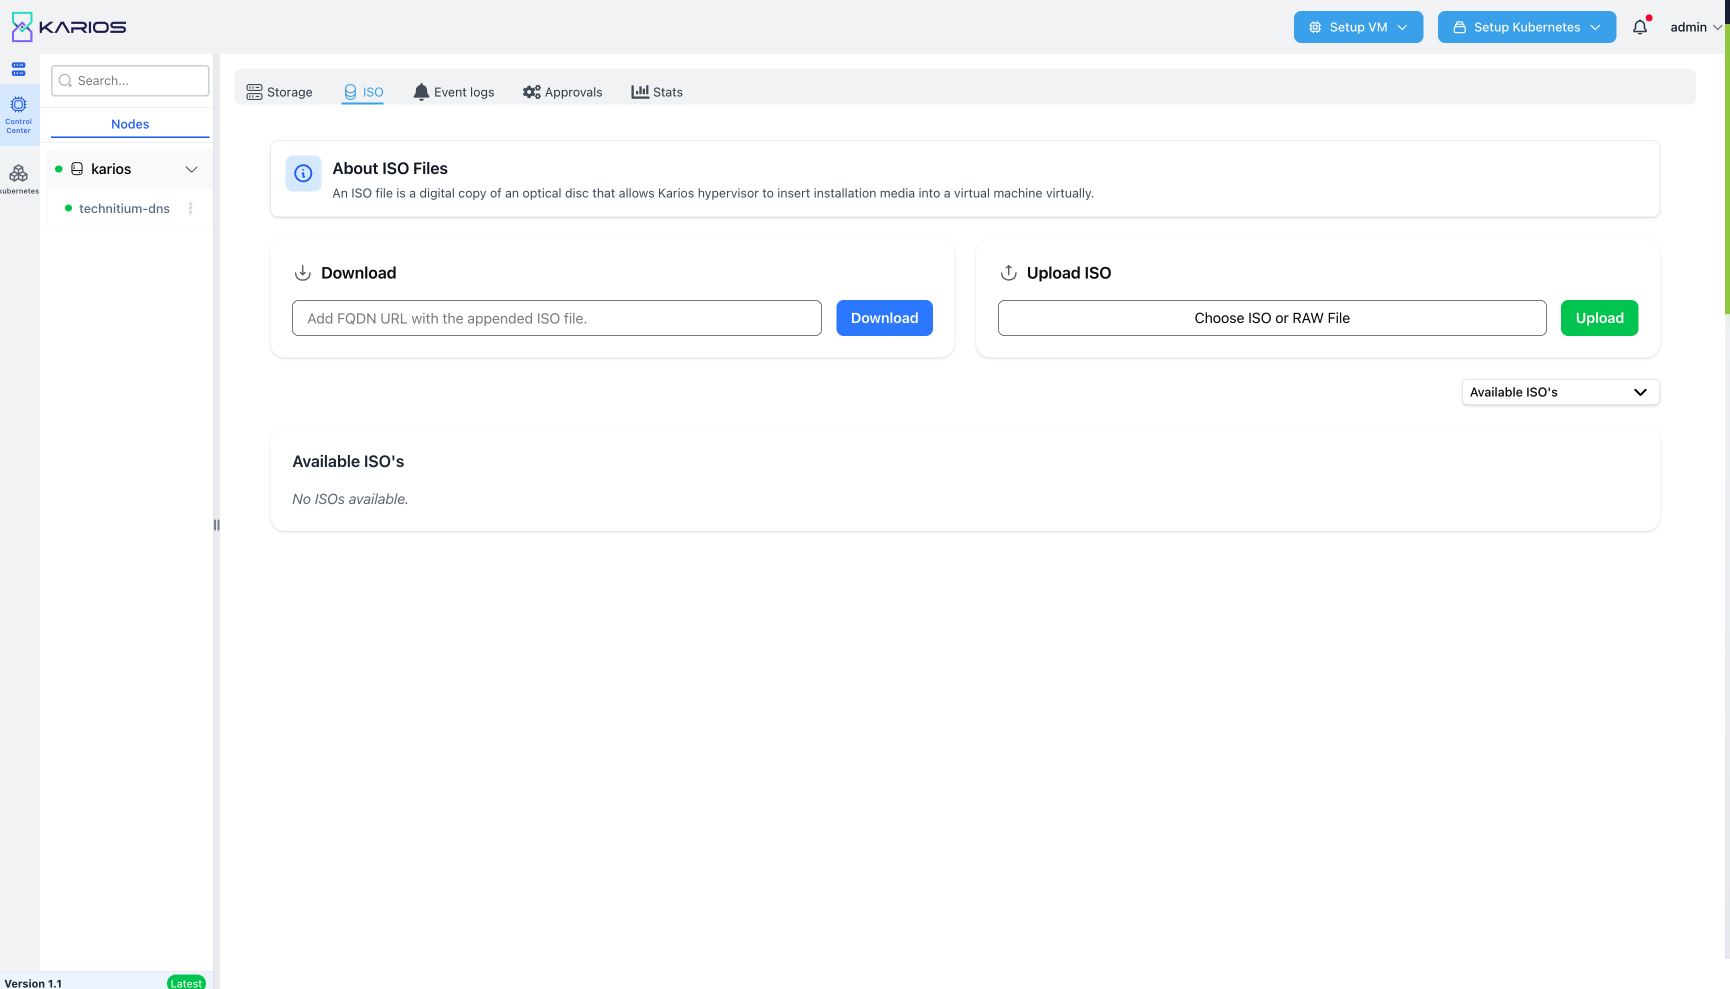
ISO Management Features:
Dual Upload Support: Support for both ISO and RAW file formats
URL-based Downloads: Download ISO files directly from FQDN URLs
File Browser Integration: Integrated file selection interface
Availability Dropdown: Dropdown menu displaying all available ISO and RAW files
Upload Status Monitoring: Real-time upload progress and completion status
File Validation: Automatic validation of uploaded ISO and RAW files
ISO Management Interface:
Download Section: FQDN URL input field with download button for remote ISO retrieval (e.g., https://download.freebsd.org/ftp/releases/ISO-IMAGES/14.2/FreeBSD-14.2-RELEASE-amd64-bootonly.iso)
Please give a valid FQDN URL in the input field and click “download”

Upload Section: File selection interface with upload button for local ISO/RAW files
Select a valid iso or raw file and click “upload”

Available Files Dropdown: Comprehensive list of all available ISO and RAW files (cloud images)
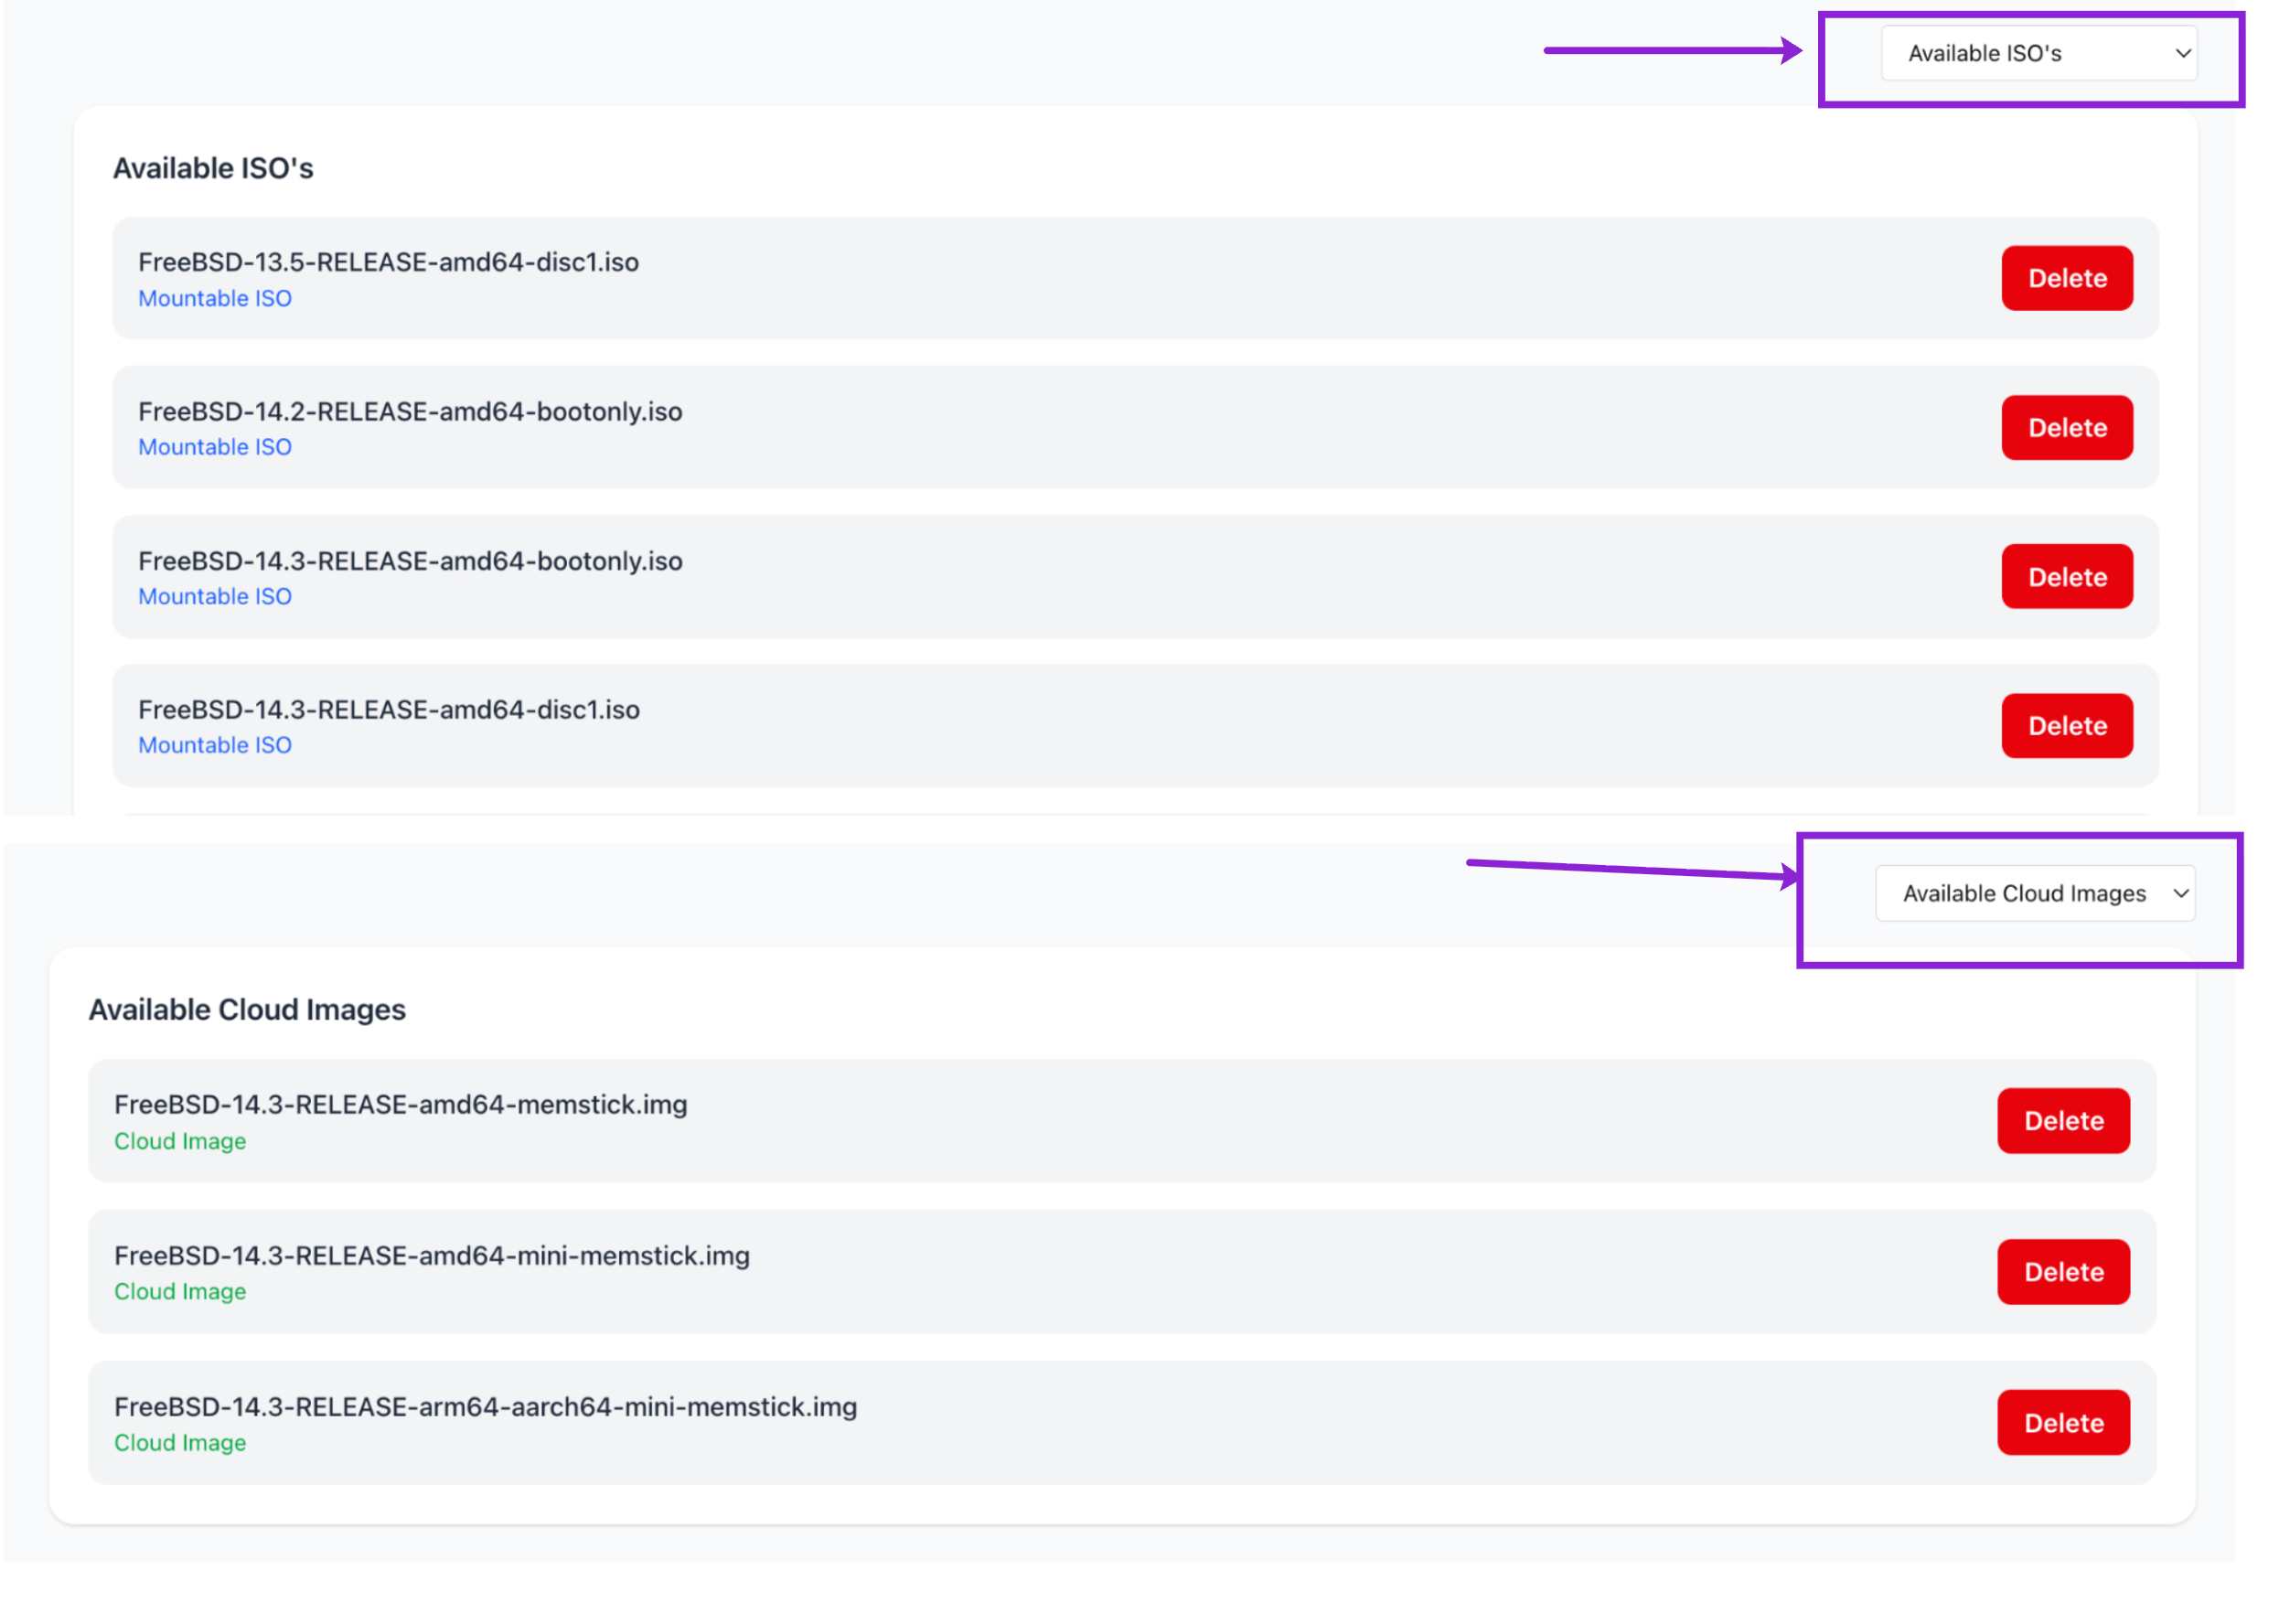
Status Indicators: Visual indicators for file availability and upload status
File Management Controls: Direct access to file operations and management functions
Supported File Types:
ISO Files: Standard ISO 9660 disk image files
RAW Files: Raw disk image files and virtual machine disk formats
Validation: Automatic file format validation during upload process
Stats Management Operations
Stats Navigation Structure
Stats Tab Selection: Access statistics and monitoring by selecting the Stats tab from the main navigation
Live and Recommendations Tabs: Toggle between real-time monitoring and system recommendations
Node & VM Stats Overview: Comprehensive monitoring of both physical nodes and virtual machines
Real-time Data Updates: Live statistics with automatic refresh capabilities

Live Statistics Monitoring
Node Performance Metrics: Real-time monitoring of CPU percentage, memory usage, power consumption, and uptime
VM Performance Tracking: Individual virtual machine CPU usage, memory consumption, and operational status
Status Indicators: Visual status indicators showing NORMAL, Running, or Stopped states
Multi-Node Support: Monitor multiple nodes simultaneously with consolidated view
Resource Utilization: Track resource allocation and usage patterns across the infrastructure
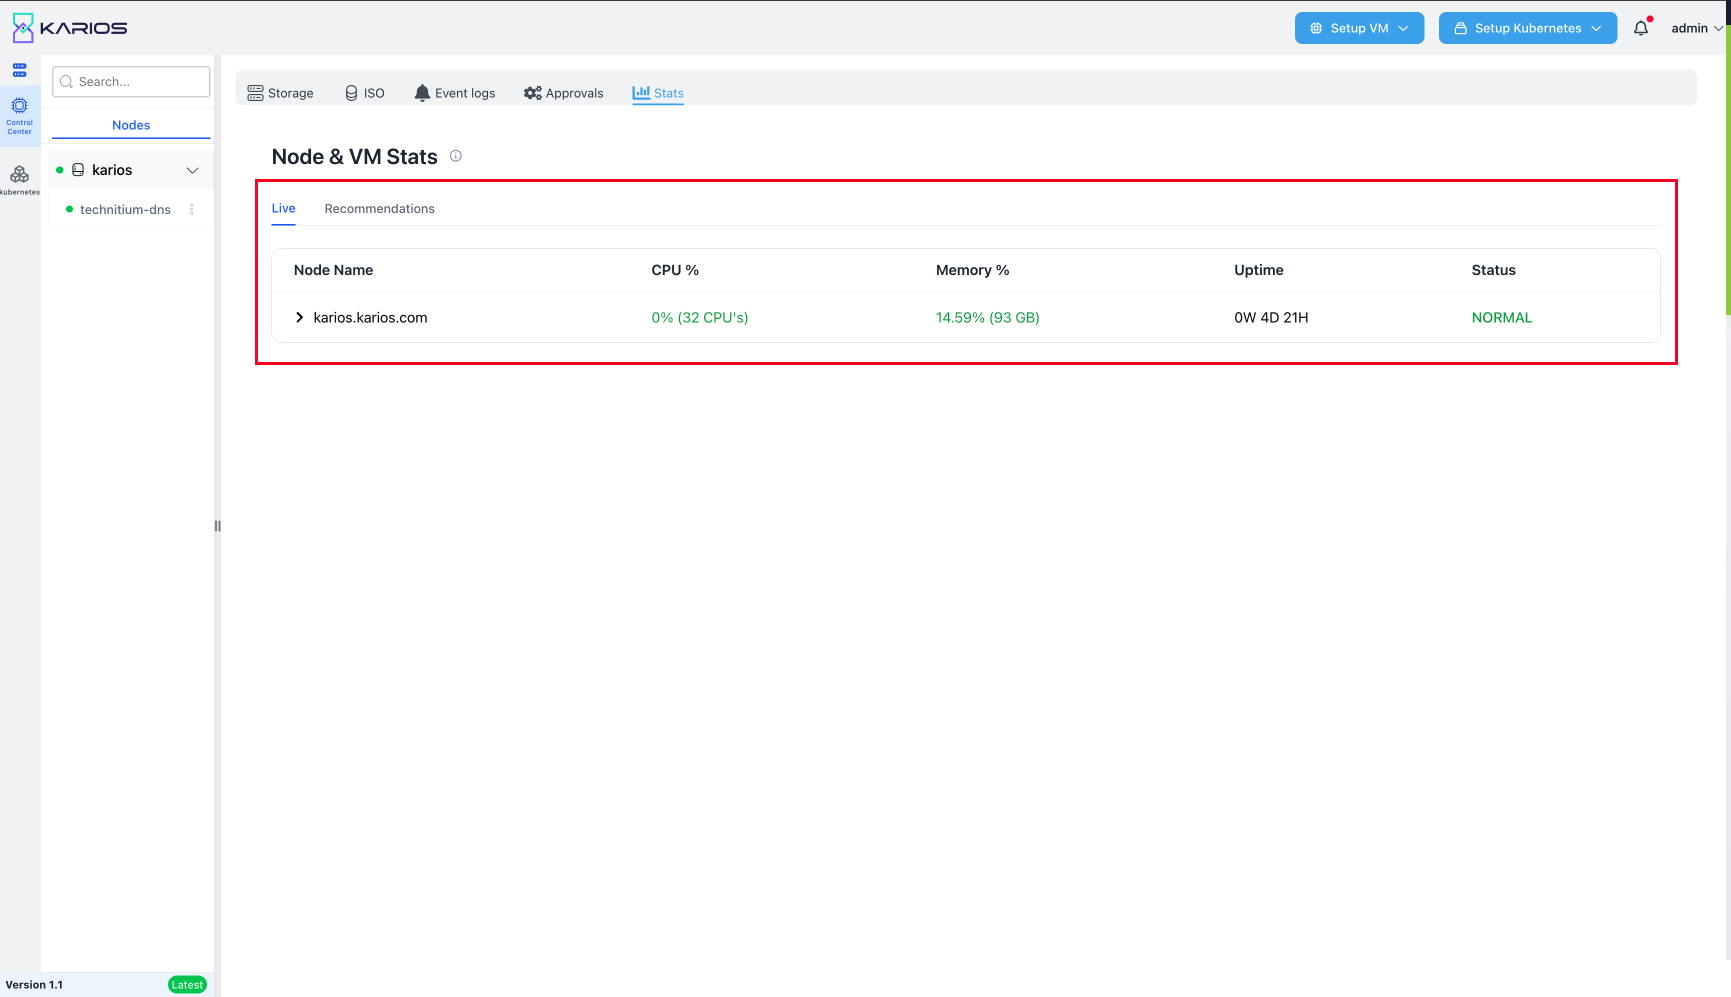
Node Statistics Display
Node Name: Display of node identifiers and hostnames
CPU Usage: Real-time CPU utilization percentage with core count information
Memory Usage: Memory consumption percentage with total available memory in GB
Power Consumption: Current power usage in watts with power status indicators
Uptime Information: Node uptime tracking with days, hours, and minutes format
Status Monitoring: Overall node health status with color-coded indicators

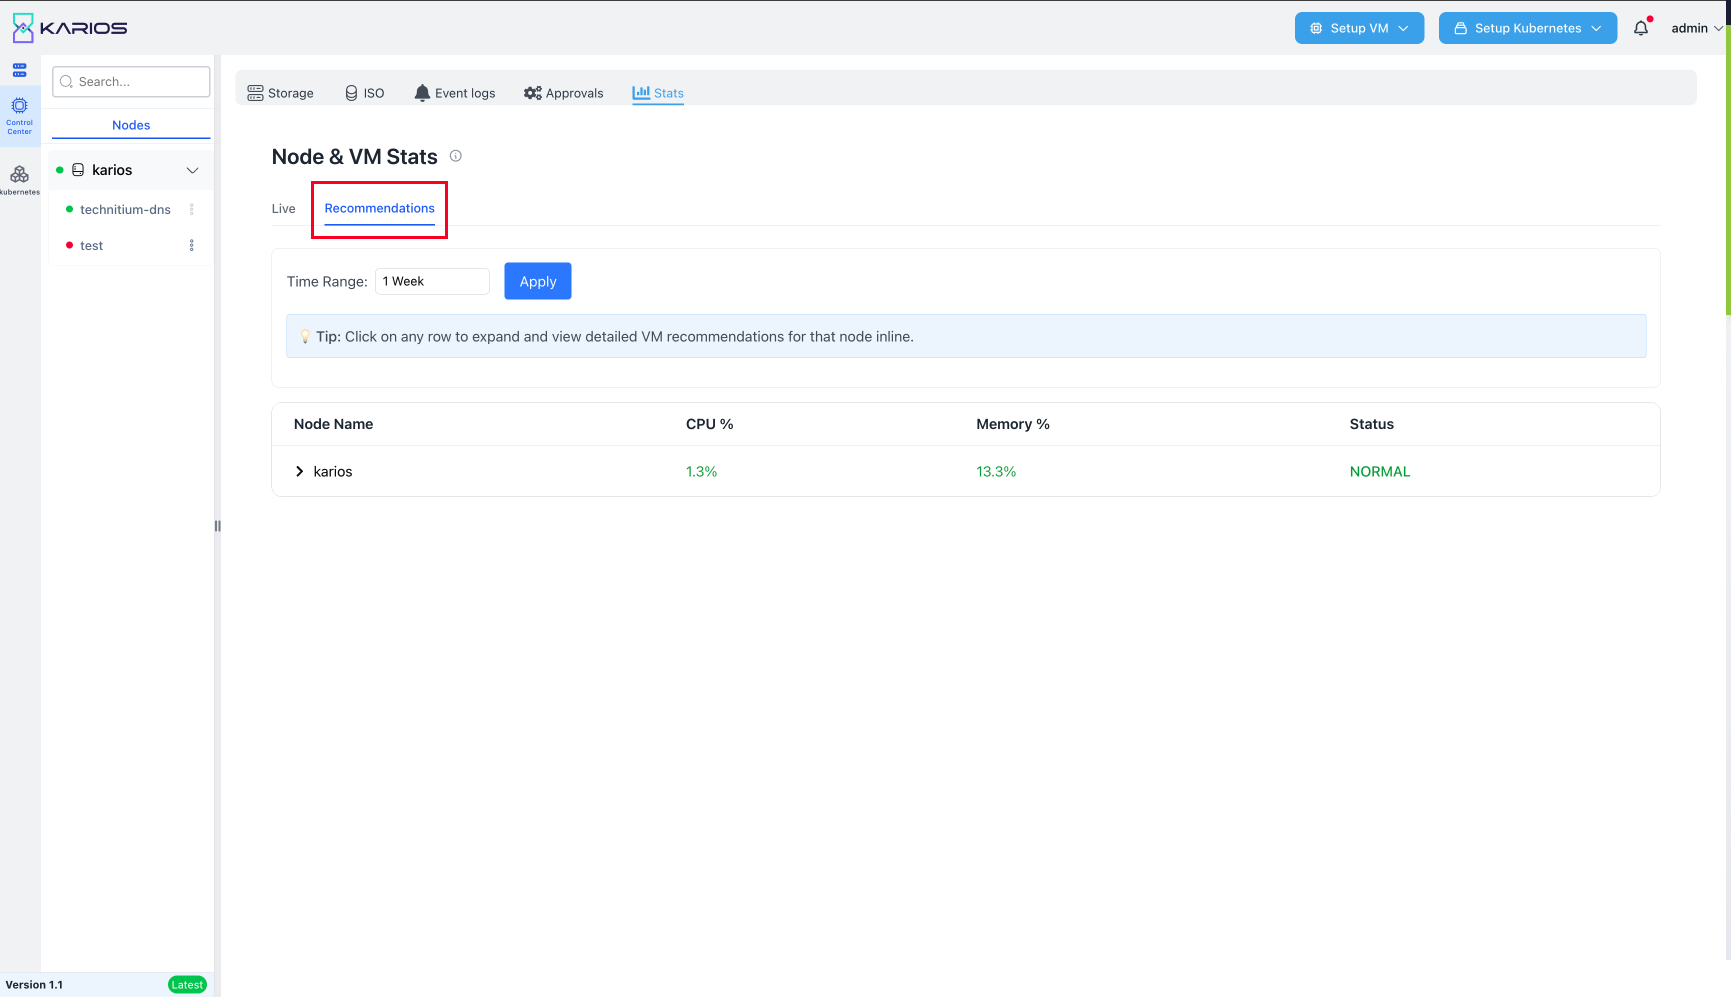
Virtual Machine Statistics
VM Name: Individual virtual machine identification and naming
CPU Usage: Per-VM CPU utilization with allocated CPU core information
Memory Usage: VM memory consumption with allocated memory in GB
VM Status: Current operational status (Running, Stopped) with color coding
Uptime Tracking: Individual VM uptime monitoring with precise time formatting
Status Health: VM health status indicators with NORMAL operational states
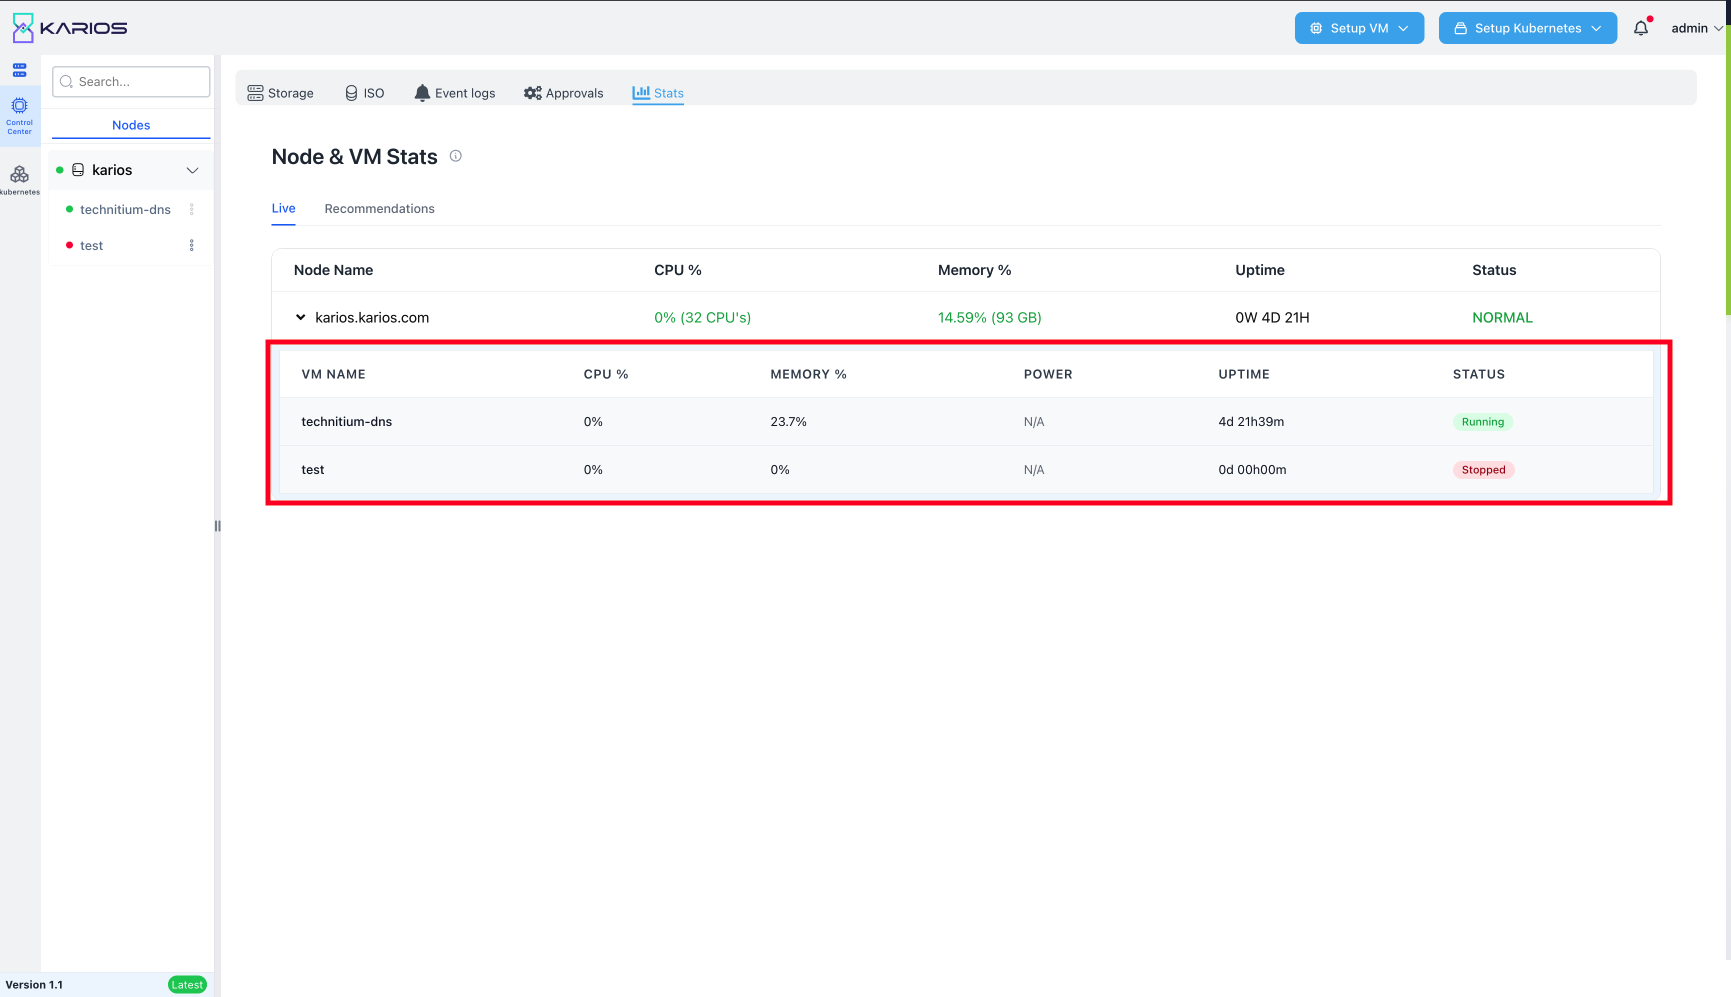
Recommendations System
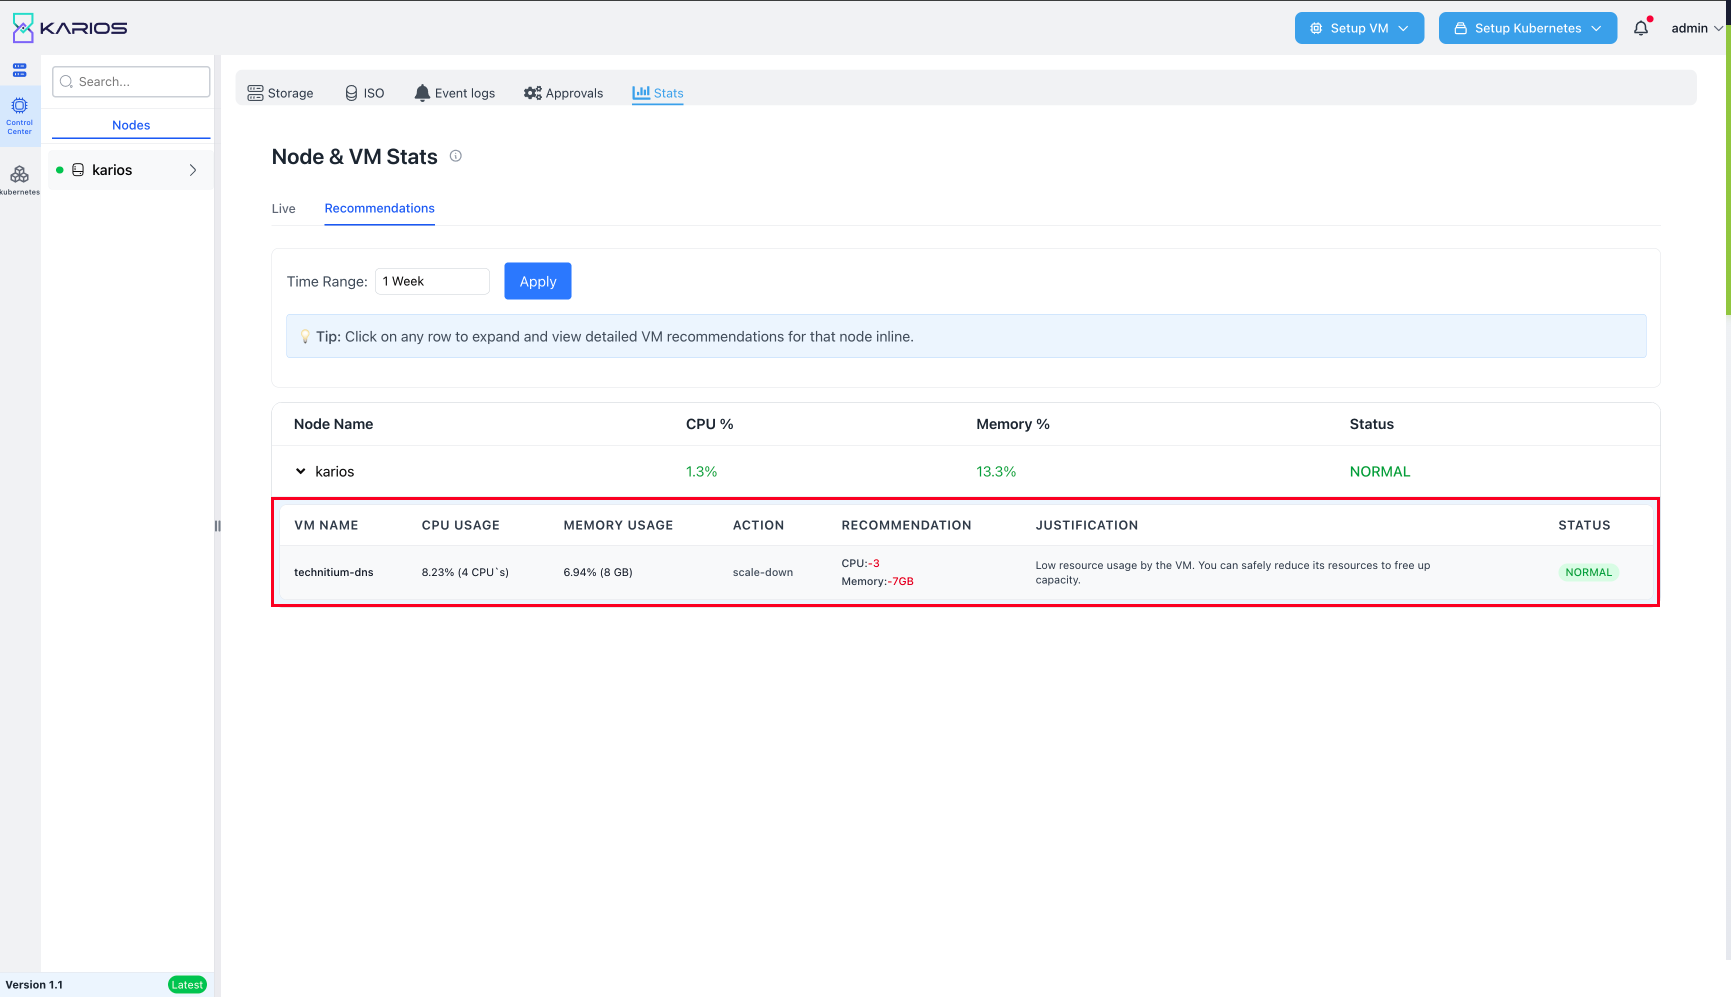
Time Range Selection: Configurable time range dropdown for recommendation analysis (1 Week default)
Apply Button: Apply selected time range for recommendation generation
Expandable Recommendations: Click on any node row to expand detailed VM recommendations
Resource Optimization: Intelligent recommendations for resource allocation and scaling
Performance Insights: Detailed analysis and suggestions for infrastructure optimization
Recommendation Details
VM-Level Recommendations: Individual virtual machine optimization suggestions
CPU Recommendations: CPU scaling recommendations with specific core adjustments
Memory Recommendations: Memory optimization suggestions with GB-level adjustments
Action Suggestions: Specific actions like “scale-down” for underutilized resources
Justification: Detailed explanations for each recommendation with reasoning
Resource Efficiency: Recommendations to free up capacity and optimize resource usage
Statistics Table Features
Sortable Columns: Sort by node name, CPU usage, memory usage, power, uptime, and status
Color-Coded Status: Visual status indicators for quick health assessment
Expandable Rows: Click to expand nodes and view detailed VM statistics
Real-time Updates: Automatic refresh of statistics data
Multi-Level Monitoring: Both node-level and VM-level statistics in unified view
Performance Monitoring Capabilities
Resource Utilization Tracking: Monitor CPU, memory, and power consumption patterns
Capacity Planning: Resource usage insights for infrastructure planning
Health Monitoring: Continuous monitoring of system health and operational status
Optimization Insights: Data-driven recommendations for performance improvements
Node Level Management
Navigating to Node Level
Accessing Worker Node Components: To access worker node level management, administrators must first navigate to the specific server they want to manage. This provides access to individual server components and detailed node-specific operations.
Navigation Process:
Server Selection: From the datacenter hierarchy in the left sidebar, select the specific worker node you want to manage
Component Access: Once a worker node is selected, the interface displays “Selected Server” with the server’s name(e.g., k00000)
Component Tabs: The worker node interface provides access to specialized component tabs designed for individual server management
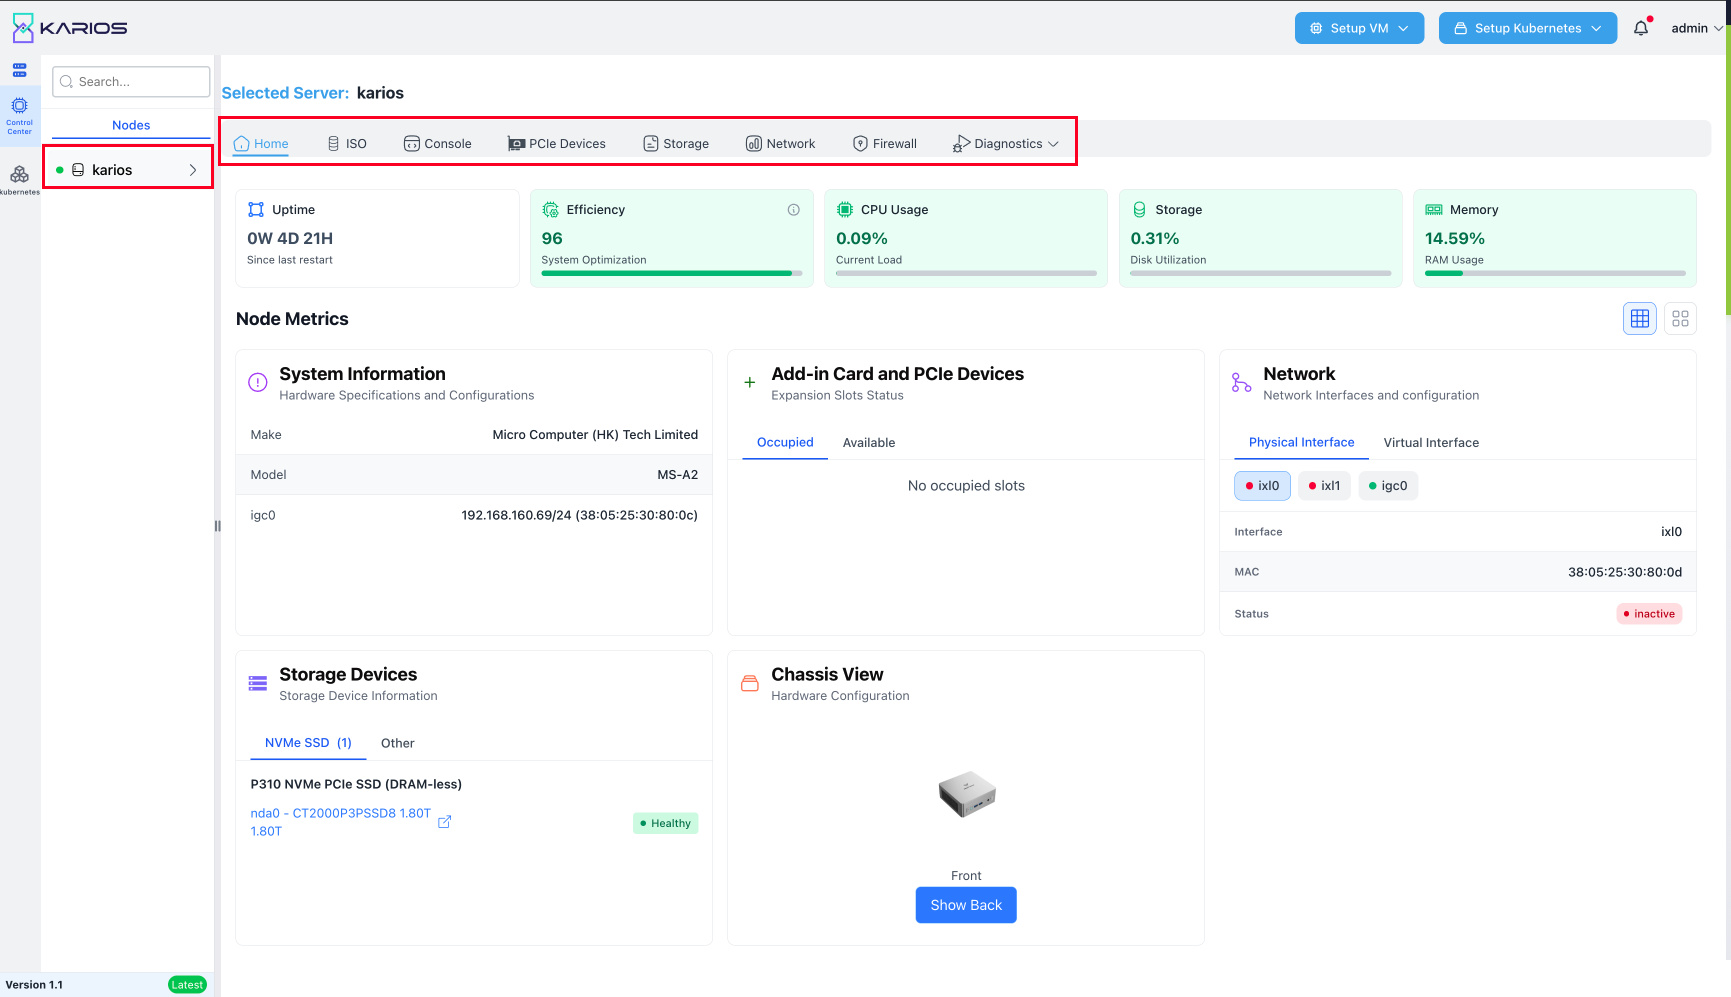
Node Component Overview: The worker node interface provides access to the following key components:
Home: Server dashboard with performance metrics and system information
ISO: Node-specific ISO image management and mounting
Storage: Local storage management and disk health monitoring
Monitoring: Server-specific performance monitoring and analytics
Network: Network interface management and connectivity status
Firewall: Node-level firewall configuration
Logs: System logs and event monitoring for the individual server
Interface Context: When working at the worker node level, all operations and configurations apply specifically to the selected server, providing granular control over individual infrastructure components.
Home Dashboard
Worker Node Home Overview: The Home tab serves as the primary dashboard for individual worker node management, providing comprehensive real-time metrics and system information essential for server administration and monitoring.
Performance Metrics Dashboard: The Home dashboard displays five key performance indicators in an intuitive card-based layout:

Figure: Worker Node Home Dashboard
System Uptime:
Display Format: Shows uptime in weeks, days, and hours format (e.g., “0W 0D 18H”)
Uptime Tracking: Continuous monitoring of system availability since last restart
Reliability Indicator: Provides quick assessment of system stability and availability
Color-coded Status: Visual indicators for uptime duration and system health
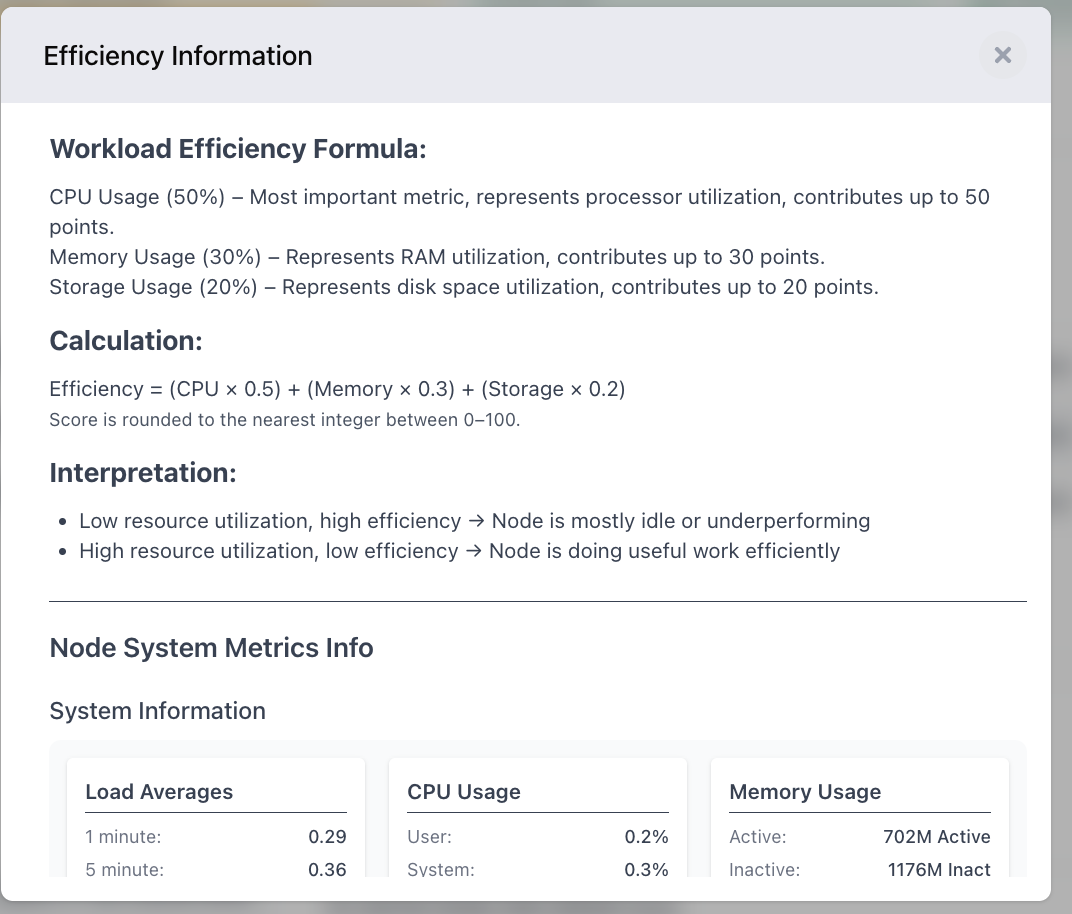
Efficiency Rating:
Efficiency Score: Displays overall system efficiency rating (e.g., “91”)
Performance Optimization: Indicates how efficiently the server is utilizing resources
Energy Efficiency: Reflects power consumption relative to performance output
Operational Insights: Provides guidance for optimization opportunities
CPU Utilization:
Real-time CPU Usage: Current CPU utilization percentage (e.g., “3.46%”)
Processing Load: Indicates current computational workload on the server
Performance Monitoring: Continuous tracking of CPU performance metrics
Capacity Planning: Helps assess CPU capacity and usage patterns
Storage Utilization:
Storage Usage: Current storage utilization percentage (e.g., “1.05%”)
Disk Capacity: Indicates available storage space and usage trends
Storage Health: Monitors storage system performance and availability
Capacity Management: Assists with storage planning and optimization
Memory Utilization:
Memory Usage: Current memory utilization percentage (e.g., “22.37%”)
RAM Consumption: Indicates current memory usage and availability
Memory Performance: Tracks memory allocation and usage patterns
Resource Optimization: Helps optimize memory allocation for better performance
System Information
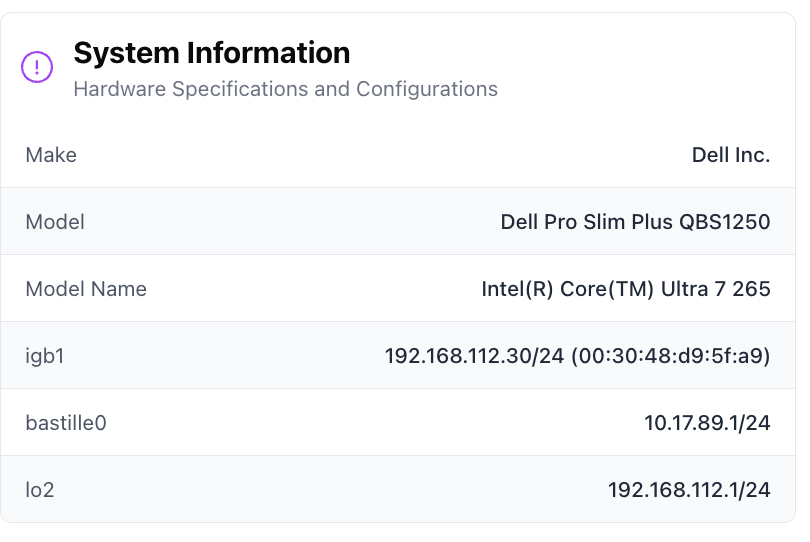
Hardware Information Display: The System Information section provides comprehensive details about the server’s hardware configuration and specifications.
System Specifications:
Make: Hardware manufacturer information (e.g., “Supermicro”)
Model: Server model designation (e.g., “Super Server”)
Network Interface: Primary network interface details with IP address and MAC address
Interface Name: Network interface identifier (e.g., “bnxt0”)
IP Address: Server’s network IP address (e.g., “192.168.116.111”)
MAC Address: Hardware MAC address (e.g., “7c:c2:55:e8:77:8c”)
System Identity:
Server Identification: Complete server identification including network configuration
Hardware Fingerprint: Unique hardware identifiers for system tracking
Network Configuration: Network interface configuration and connectivity details
Add-in Card and PCIe Devices
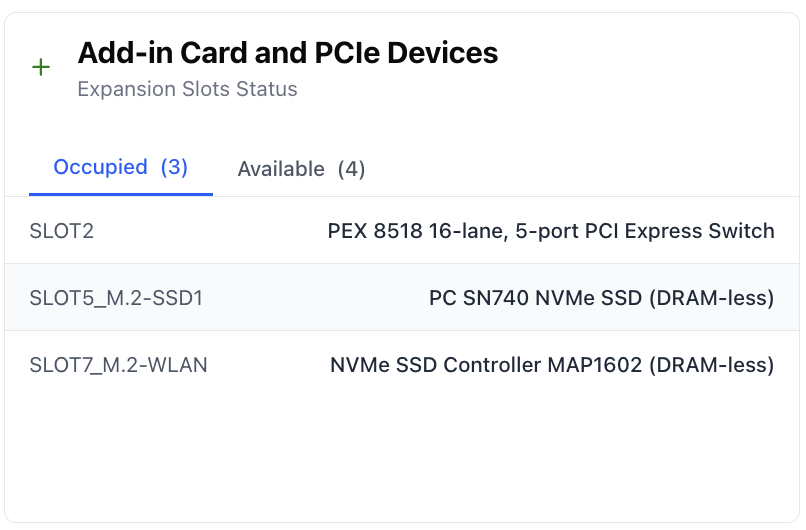
PCIe Expansion Monitoring: The Add-in Card and PCIe Devices section provides real-time monitoring of expansion card slots and their current status.
PCIe Slot Information:
CPU SLOT1 PCI-E 4.0 X16: PCIe slot specification with availability status
CPU SLOT2 PCI-E 4.0 X8: Secondary PCIe slot with current status
CPU SLOT3 PCI-E 4.0 X16: Third PCIe slot monitoring
CPU SLOT4 PCI-E 4.0 X8: Fourth PCIe slot status
Slot Status Monitoring:
Available: Indicates slots available for expansion cards
Occupied: Shows slots currently in use with installed devices
Slot Specifications: Detailed PCIe lane configuration and capabilities
Expansion Planning: Assists with hardware expansion planning and compatibility
Storage System Overview
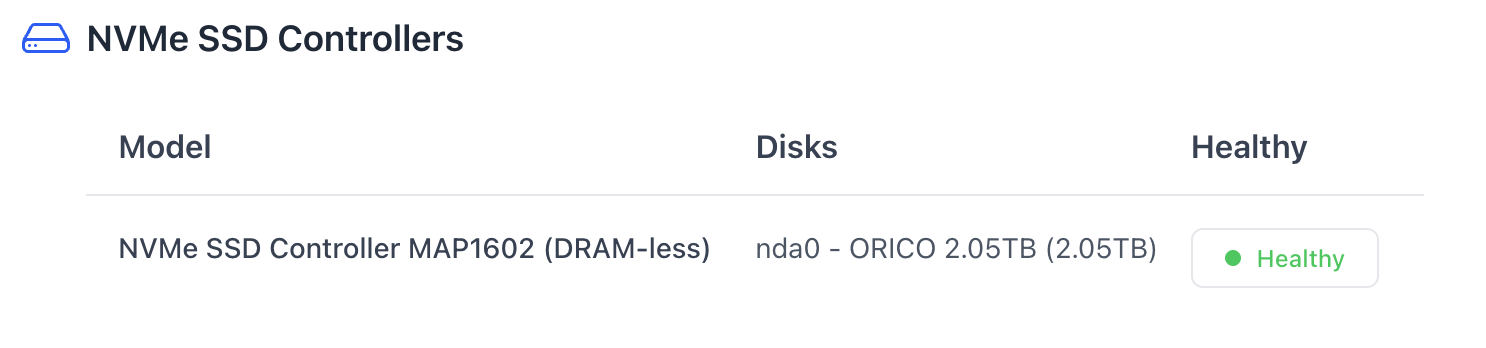
Storage Health Monitoring: The Storage section provides comprehensive monitoring of all storage controllers and attached storage devices.
NVMe SSD Controllers:
Controller Model: NVMe SSD controller specifications (e.g., “NVMe SSD Controller MAP1602 (DRAM-less)”)
Disk Information: Individual disk identification and capacity (e.g., “nda0 - ORICO 1.02TB”)
Health Status: Real-time health monitoring with status indicators (e.g., “Healthy”)
Multiple Disk Support: Monitoring of multiple attached storage devices
Other Storage Controllers:
SATA Controllers: Traditional SATA controller monitoring (e.g., “Raptor Lake SATA AHCI Controller”)
Storage Devices: Individual storage device monitoring (e.g., “sda - Sample Disk (1TB)”)
Health Monitoring: Comprehensive health status for all storage devices
Performance Tracking: Storage performance metrics and optimization insights
Note
Click on any storage controller in the list to view additional details about the device, including hardware specifications, health status, NVMe health metrics.
Network Interface Management
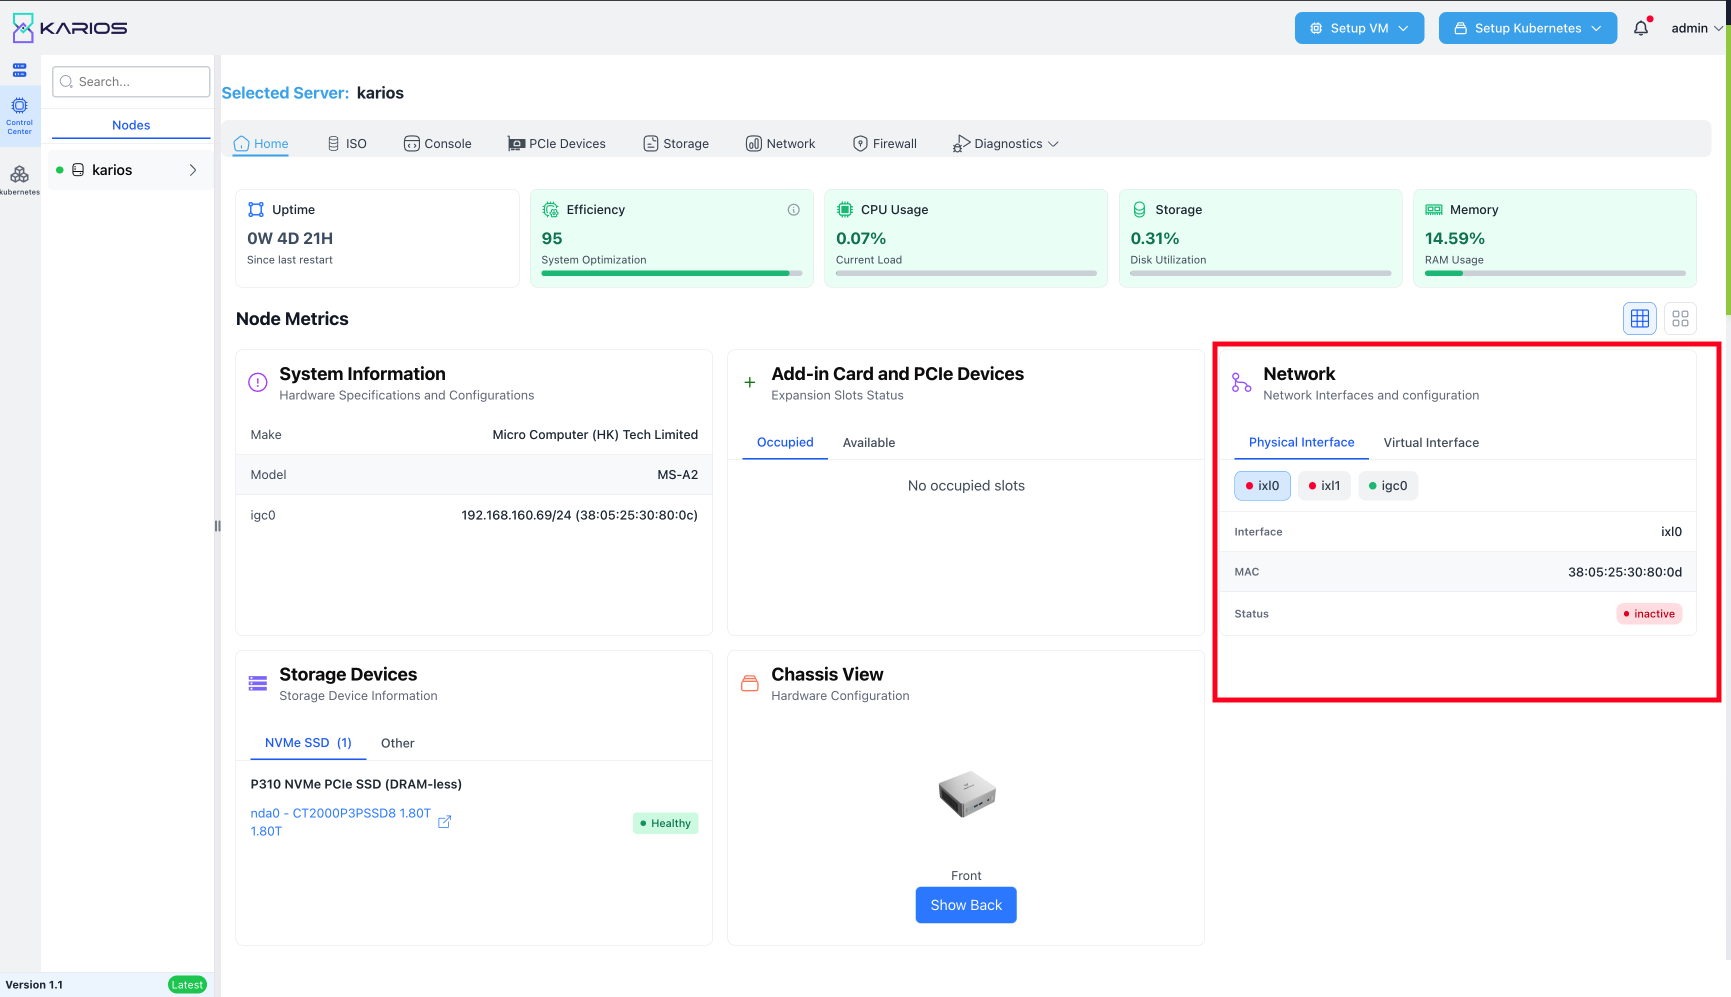
Physical Network Interfaces: The Network section provides detailed information about all network interfaces configured on the server.
Network Interface Information:
Interface Model: Network interface model identification (e.g., “bnxt0”, “bnxt1”)
MAC Address: Hardware MAC address for each interface
IP Configuration: Current IP address assignments and network configuration
Interface Status: Current operational status of each network interface
Virtual Network Interfaces: The system also displays virtual network interfaces created for virtualization and network segmentation.
Virtual Interface Details:
Virtual Interface Names: Virtual interface identifiers (e.g., “vm-default”, “vm-vlan115-sw”)
MAC Address Assignment: Virtual MAC addresses for each interface
Network Segmentation: Virtual network configuration for traffic isolation
VLAN Configuration: VLAN-specific virtual interfaces and their configurations
Chassis View
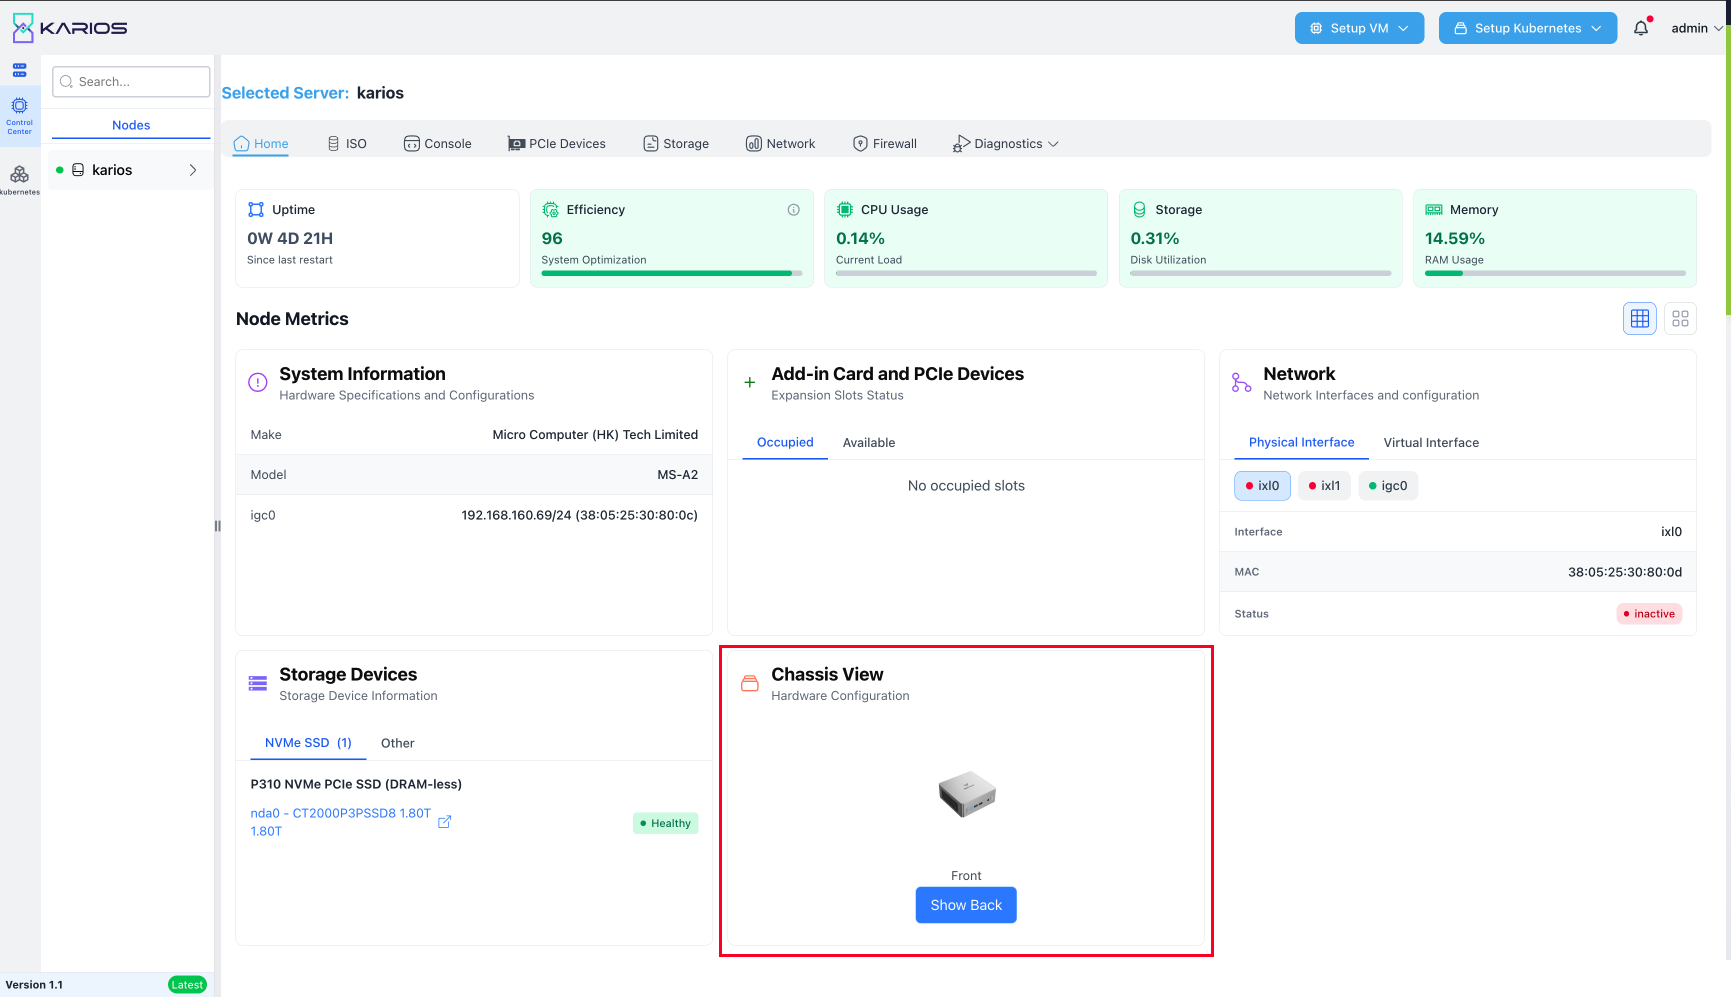
Physical Server Visualization: The Chassis View provides a visual representation of the physical server hardware, helping administrators understand the physical layout and configuration.
Chassis Display Features:
3D Server Visualization: Three-dimensional representation of the server chassis
Front Panel View: Default front panel view of the server hardware
Hardware Identification: Visual identification of physical server components
Physical Layout: Understanding of physical component placement and accessibility
Chassis Navigation:
View Options: Toggle between different chassis views (Front/Back)
Show Back Button: Option to view the rear panel of the server
Hardware Mapping: Visual correlation between logical and physical components
Physical Maintenance: Assistance with physical hardware maintenance and identification
Chassis View Benefits:
Hardware Identification: Quickly identify physical components and their locations
Maintenance Planning: Plan physical maintenance and hardware replacement
Visual Reference: Provide visual context for hardware troubleshooting
Documentation: Visual documentation of server configuration and layout
Node Console Management
Console Overview
The Console tab provides direct access to the FreeBSD command-line interface for individual worker nodes, enabling administrators to perform advanced system administration tasks, troubleshooting, and direct system configuration through a web-based terminal interface.
Console Interface Features:
Web-based Terminal: Browser-based access to the FreeBSD command line
Direct System Access: Full command-line access to the underlying FreeBSD system
Real-time Interaction: Live terminal session with immediate command execution
Administrative Control: Complete system administration capabilities through CLI
Secure Access: Password-protected console access with credential validation
Console Access and Authentication
Accessing Node Console
Console Navigation:
Node Selection: Select the target worker node from the datacenter hierarchy
Console Tab: Click on the “Console” tab in the node management interface
Console Interface: The web-based console interface loads automatically
Authentication Prompt: System prompts for console access credentials
Authentication Requirements:
Console Access: Requires valid system credentials
User Authentication: Password-based authentication for console access
Session Management: Secure session handling for terminal access
Credential Validation: Real-time credential verification
Console Authentication Interface
Credentials Dialog:
The console authentication interface provides secure access to the node’s command-line interface:
Authentication Components:
Credentials Header: “Credentials” dialog title
Password Field: Secure password input field for user authentication
Send Credentials Button: Submit authentication credentials to establish console session
Authentication Process:
Access Console: Navigate to the Console tab on the selected node
Credentials Prompt: System displays authentication dialog
Enter Password: Input the valid system password in the password field (Default password is “karios”)
Submit Credentials: Click “Send credentials” to authenticate and establish console session
Console Access: Upon successful authentication, gain full console access
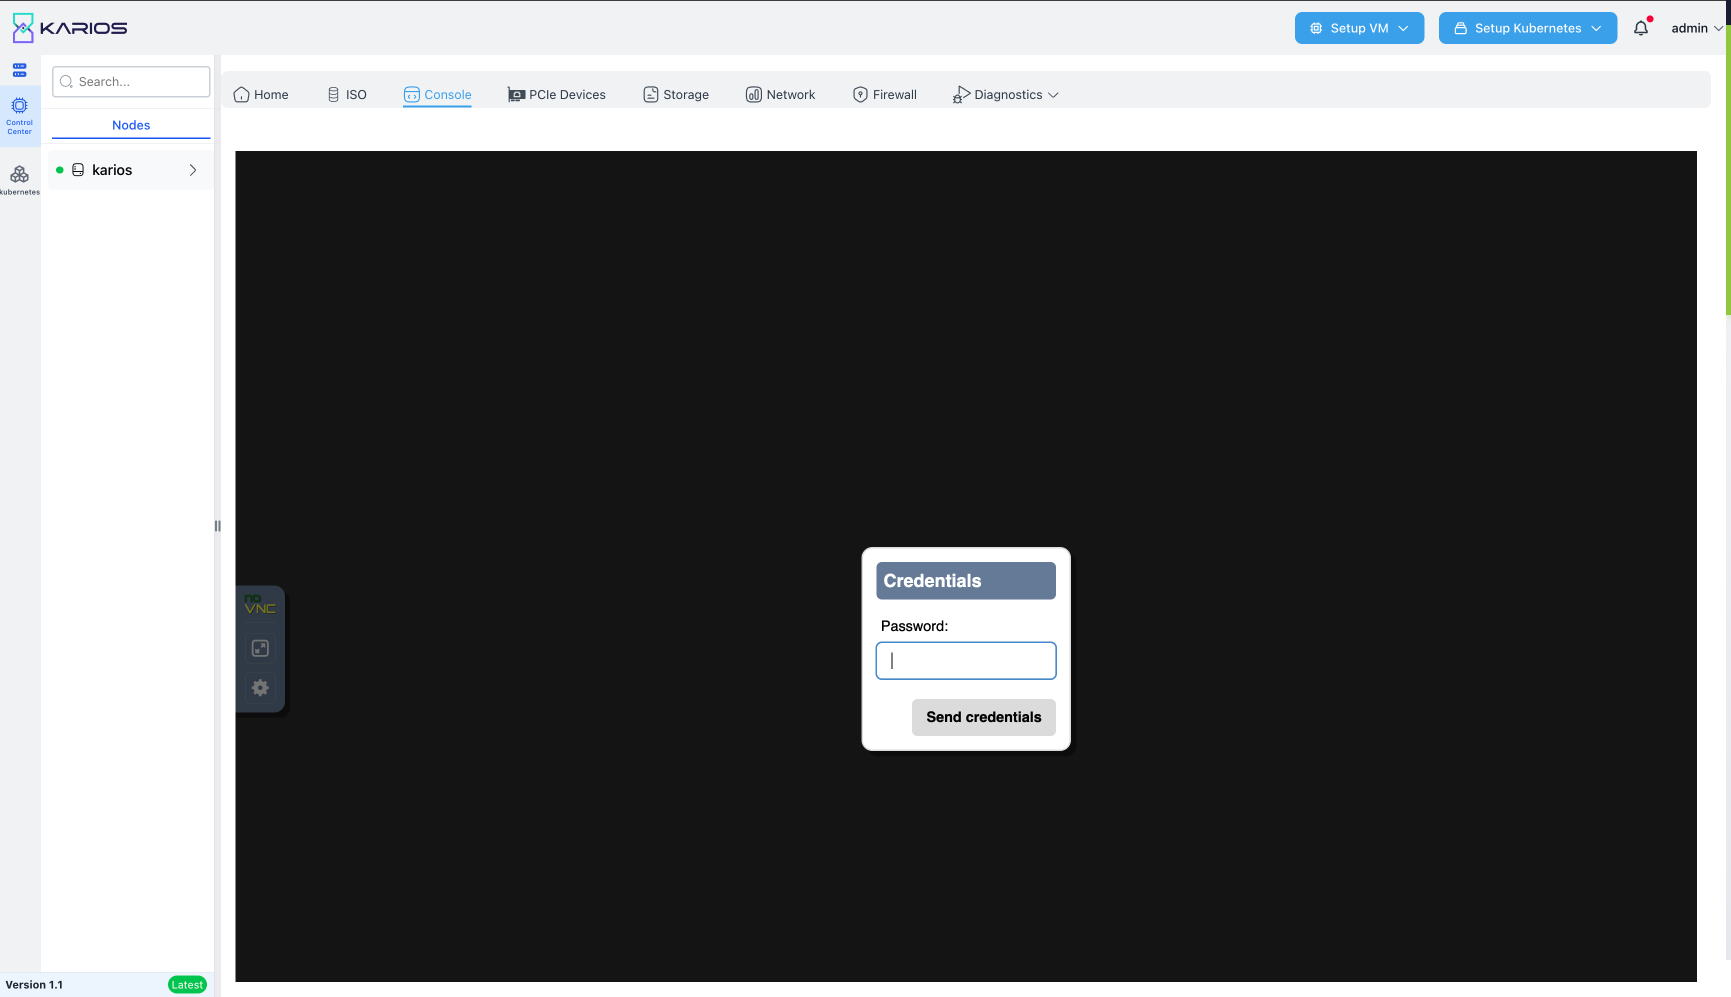
Figure: Node Console Authentication Prompt
Console Operations and Commands
FreeBSD Command Line Access
System Administration Commands:
Once authenticated, administrators have full access to FreeBSD system commands:
System Monitoring:
# System status and resource monitoring
top                    # Display running processes and system usage
ps aux                 # List all running processes
df -h                  # Display filesystem disk usage
free -h                # Show memory usage statistics
uptime                 # Display system uptime and load average
Service Management:
# FreeBSD service management
service -e             # List enabled services
service <name> status  # Check service status
service <name> start   # Start a service
service <name> stop    # Stop a service
service <name> restart # Restart a service
Network Configuration:
# Network interface and connectivity
ifconfig              # Display network interface configuration
netstat -rn           # Show routing table
ping <host>           # Test network connectivity
sockstat -l           # Display listening sockets
Log Analysis:
# System log examination
tail -f /var/log/messages    # Monitor system messages in real-time
grep "error" /var/log/messages # Search for errors in system logs
dmesg                        # Display kernel boot messages
logger "test message"        # Add custom message to system log
Advanced Console Operations
File System Operations:
# File and directory management
ls -la                # List files with detailed information
cd /path/to/directory # Change directory
pwd                   # Display current directory
mkdir directory_name  # Create new directory
rm -rf directory      # Remove directory and contents
System Configuration:
# System configuration files
cat /etc/rc.conf      # View system startup configuration
sysctl -a             # Display all system variables
mount                 # Show mounted filesystems
zpool status          # Check ZFS pool status (if applicable)
Package Management:
# FreeBSD package management
pkg info              # List installed packages
pkg search <package>  # Search for packages
pkg install <package> # Install new package
pkg update            # Update package repository
Process Management:
# Process control and monitoring
killall <process>     # Kill processes by name
kill -9 <pid>         # Force kill process by PID
jobs                  # Display active jobs
nohup <command> &     # Run command in background
Console Best Practices
Operational Considerations
Console Access:
Authentication Required: All console access requires valid system credentials
Session Management: Secure handling of console sessions and authentication
Command Logging: System logs record console activity for audit purposes
Access Control: Restrict console access to authorized administrators only
Session Timeout: Implement appropriate session timeout policies
Safe Console Practices:
Command Verification: Verify commands before execution, especially destructive operations
Backup Before Changes: Create backups before making significant system modifications
Documentation: Document important configuration changes and commands
Testing Environment: Test critical changes in non-production environments first
Change Management: Follow established change management procedures
Console Support and Documentation
Getting Help
Console Documentation:
FreeBSD Handbook: Reference comprehensive FreeBSD documentation for command usage
Man Pages: Use man pages within the console for detailed command documentation
System Help: Access built-in help functions for commands and utilities
Community Resources: Leverage FreeBSD community resources and forums
Support Resources:
Platform Documentation: Refer to Karios platform documentation for integration guidance
Knowledge Base: Access knowledge base articles for common console operations
Training Resources: Utilize available training resources for FreeBSD administration
Command Reference:
# Get help for any command
man <command>         # Display manual page for command
<command> --help      # Display command help (if available)
which <command>       # Show path to command executable
whereis <command>     # Locate command binary, source, and manual
ISO Management
ISO Operations:
Download ISO: Download ISO files using FQDN URL with appended ISO file path
Upload ISO: Upload valid ISO files to the data center storage
RAW File Support: Upload and manage RAW disk image files
File Selection: Browse and select from available ISO and RAW files
Availability Tracking: Real-time view of available ISO and RAW files
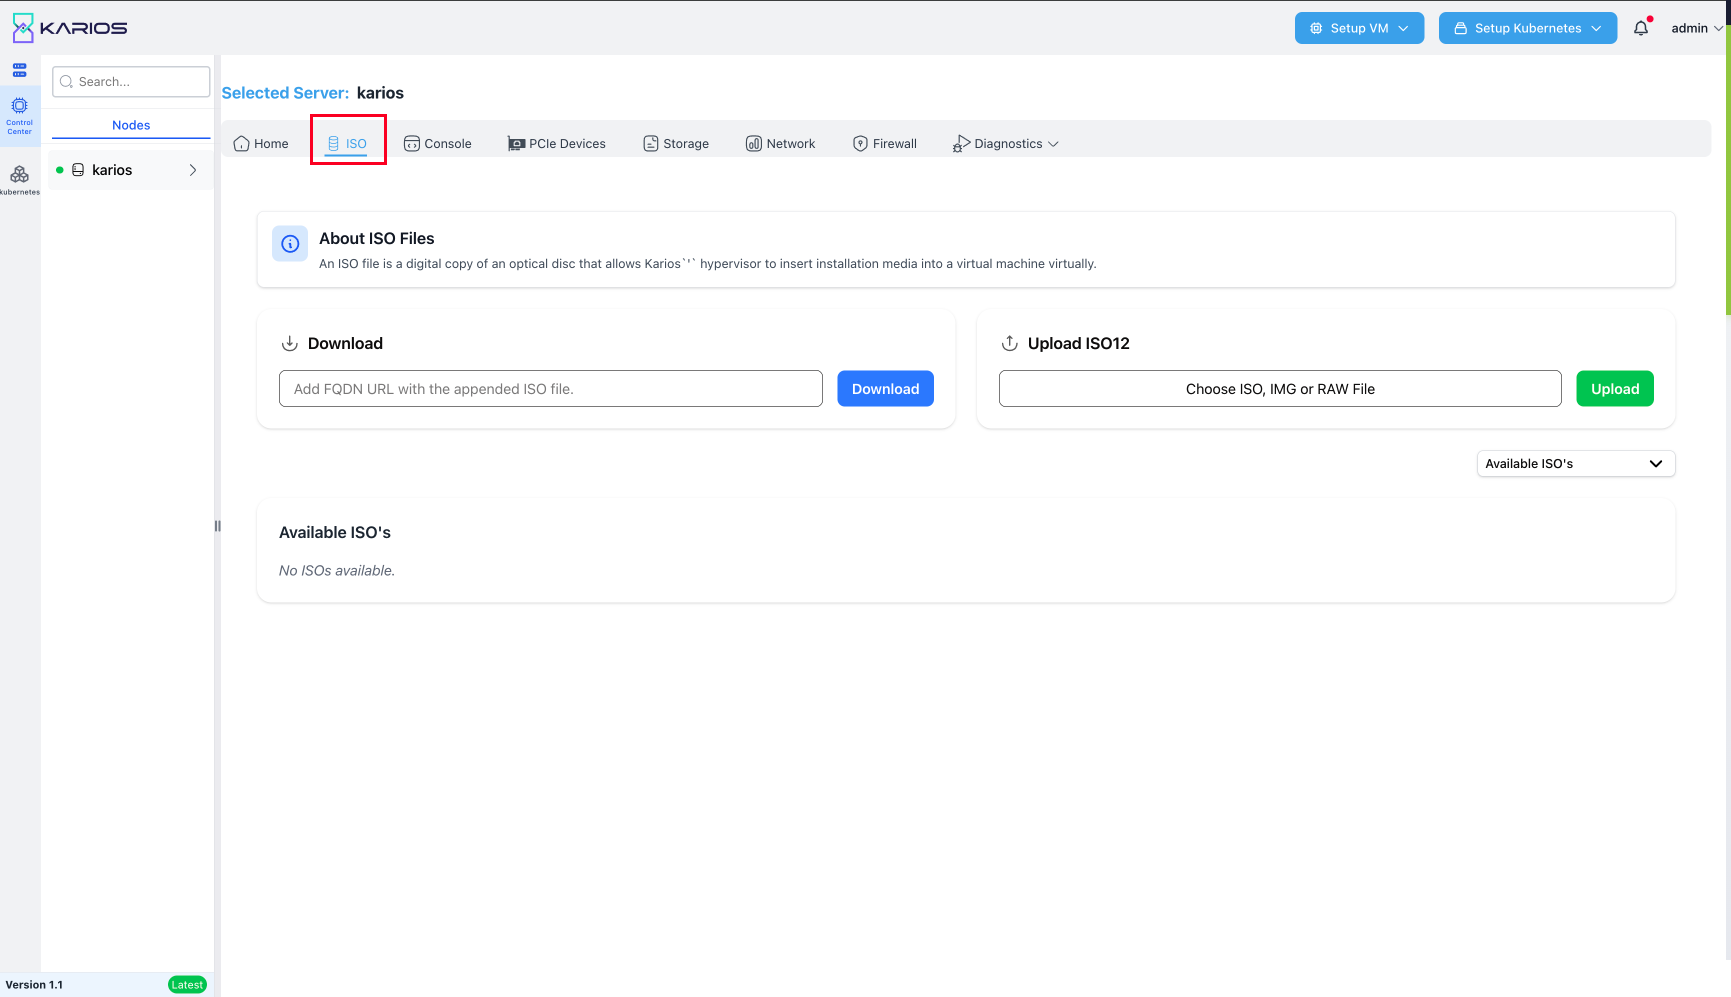
ISO Management Features:
Dual Upload Support: Support for both ISO and RAW file formats
URL-based Downloads: Download ISO files directly from FQDN URLs
File Browser Integration: Integrated file selection interface
Availability Dropdown: Dropdown menu displaying all available ISO and RAW files
Upload Status Monitoring: Real-time upload progress and completion status
File Validation: Automatic validation of uploaded ISO and RAW files
ISO Management Interface:
Download Section: FQDN URL input field with download button for remote ISO retrieval
Please provide a valid FQDN url and click “Download”. The downloaded iso can be viewed in the Available ISOs section.
Upload Section: File selection interface with upload button for local ISO/RAW files
Please select the appropriate ISO/RAW files from your system and click “Upload”. The uploaded file will be in the available ISO/Cloud images section.
Available Files Dropdown: Comprehensive list of all available ISO and RAW files
Status Indicators: Visual indicators for file availability and upload status
File Management Controls: Direct access to file operations and management functions
Supported File Types:
ISO Files: Standard ISO 9660 disk image files
RAW Files: Raw disk image files and virtual machine disk formats
Validation: Automatic file format validation during upload process
PCIe Devices
Overview
The PCIe Devices interface allows you to view and manage all PCIe (Peripheral Component Interconnect Express) devices installed in your server. PCIe is the modern standard for connecting hardware components like graphics cards, network cards, and storage devices to your computer’s motherboard.
Think of PCIe devices as the various pieces of hardware that plug into slots on your computer’s motherboard to give it different capabilities - like adding graphics processing, network connectivity, or storage functions.
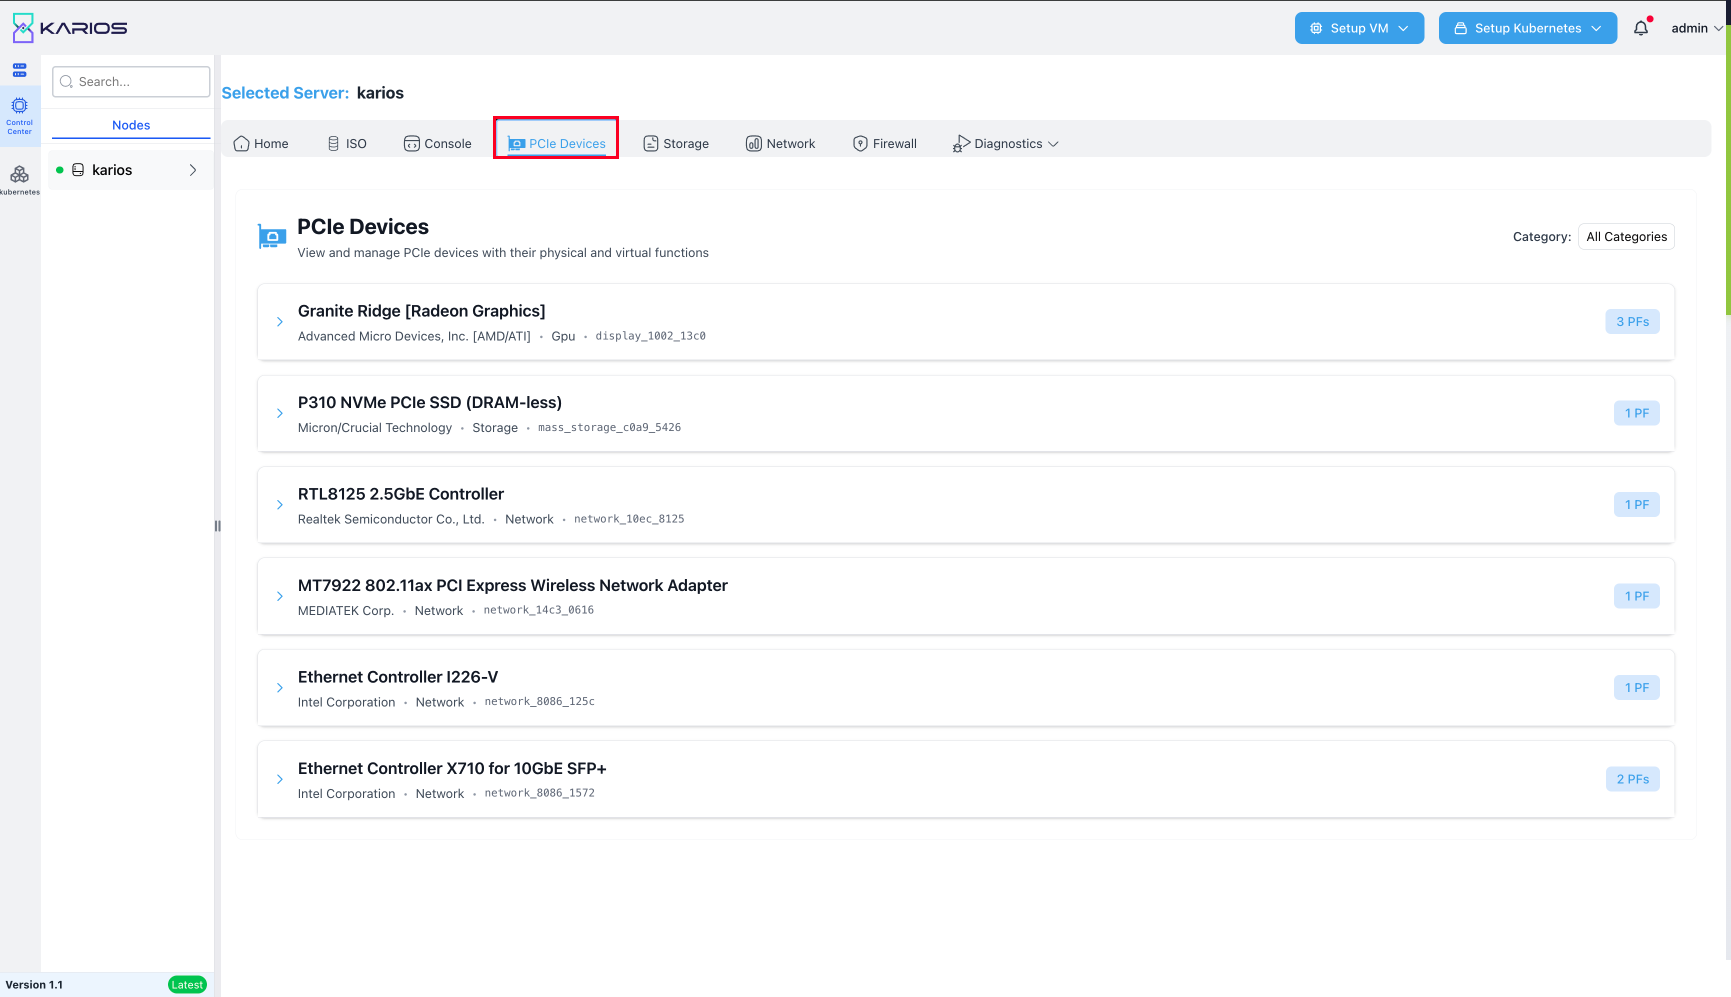
What is PCIe?
- PCIe Definition
PCIe stands for “Peripheral Component Interconnect Express.” It’s a high-speed connection standard that allows different hardware components to communicate with your computer’s processor and memory.
- Why PCIe Matters
Speed: Much faster than older connection types
Flexibility: Supports many different types of devices
Expandability: Allows you to add new capabilities to your server
Physical vs Virtual Functions
Understanding PFs and VFs
- Physical Functions (PFs)
Definition: The actual, physical network ports on the hardware card
Use: Direct hardware access for maximum performance
- Virtual Functions (VFs)
Definition: Software-created network interfaces that share the physical hardware
Use: Allows multiple virtual machines to share one physical network card
Virtual Function Management
Creating Virtual Functions
The interface allows you to create VFs (Virtual Functions) for SRIOV supported devices:
- Step 1: Identify Capable Devices
Look for devices showing “PFs” and “VFs” counters (like the X710 showing “2 PFs” and “4 VFs”). Click the device to expand details.
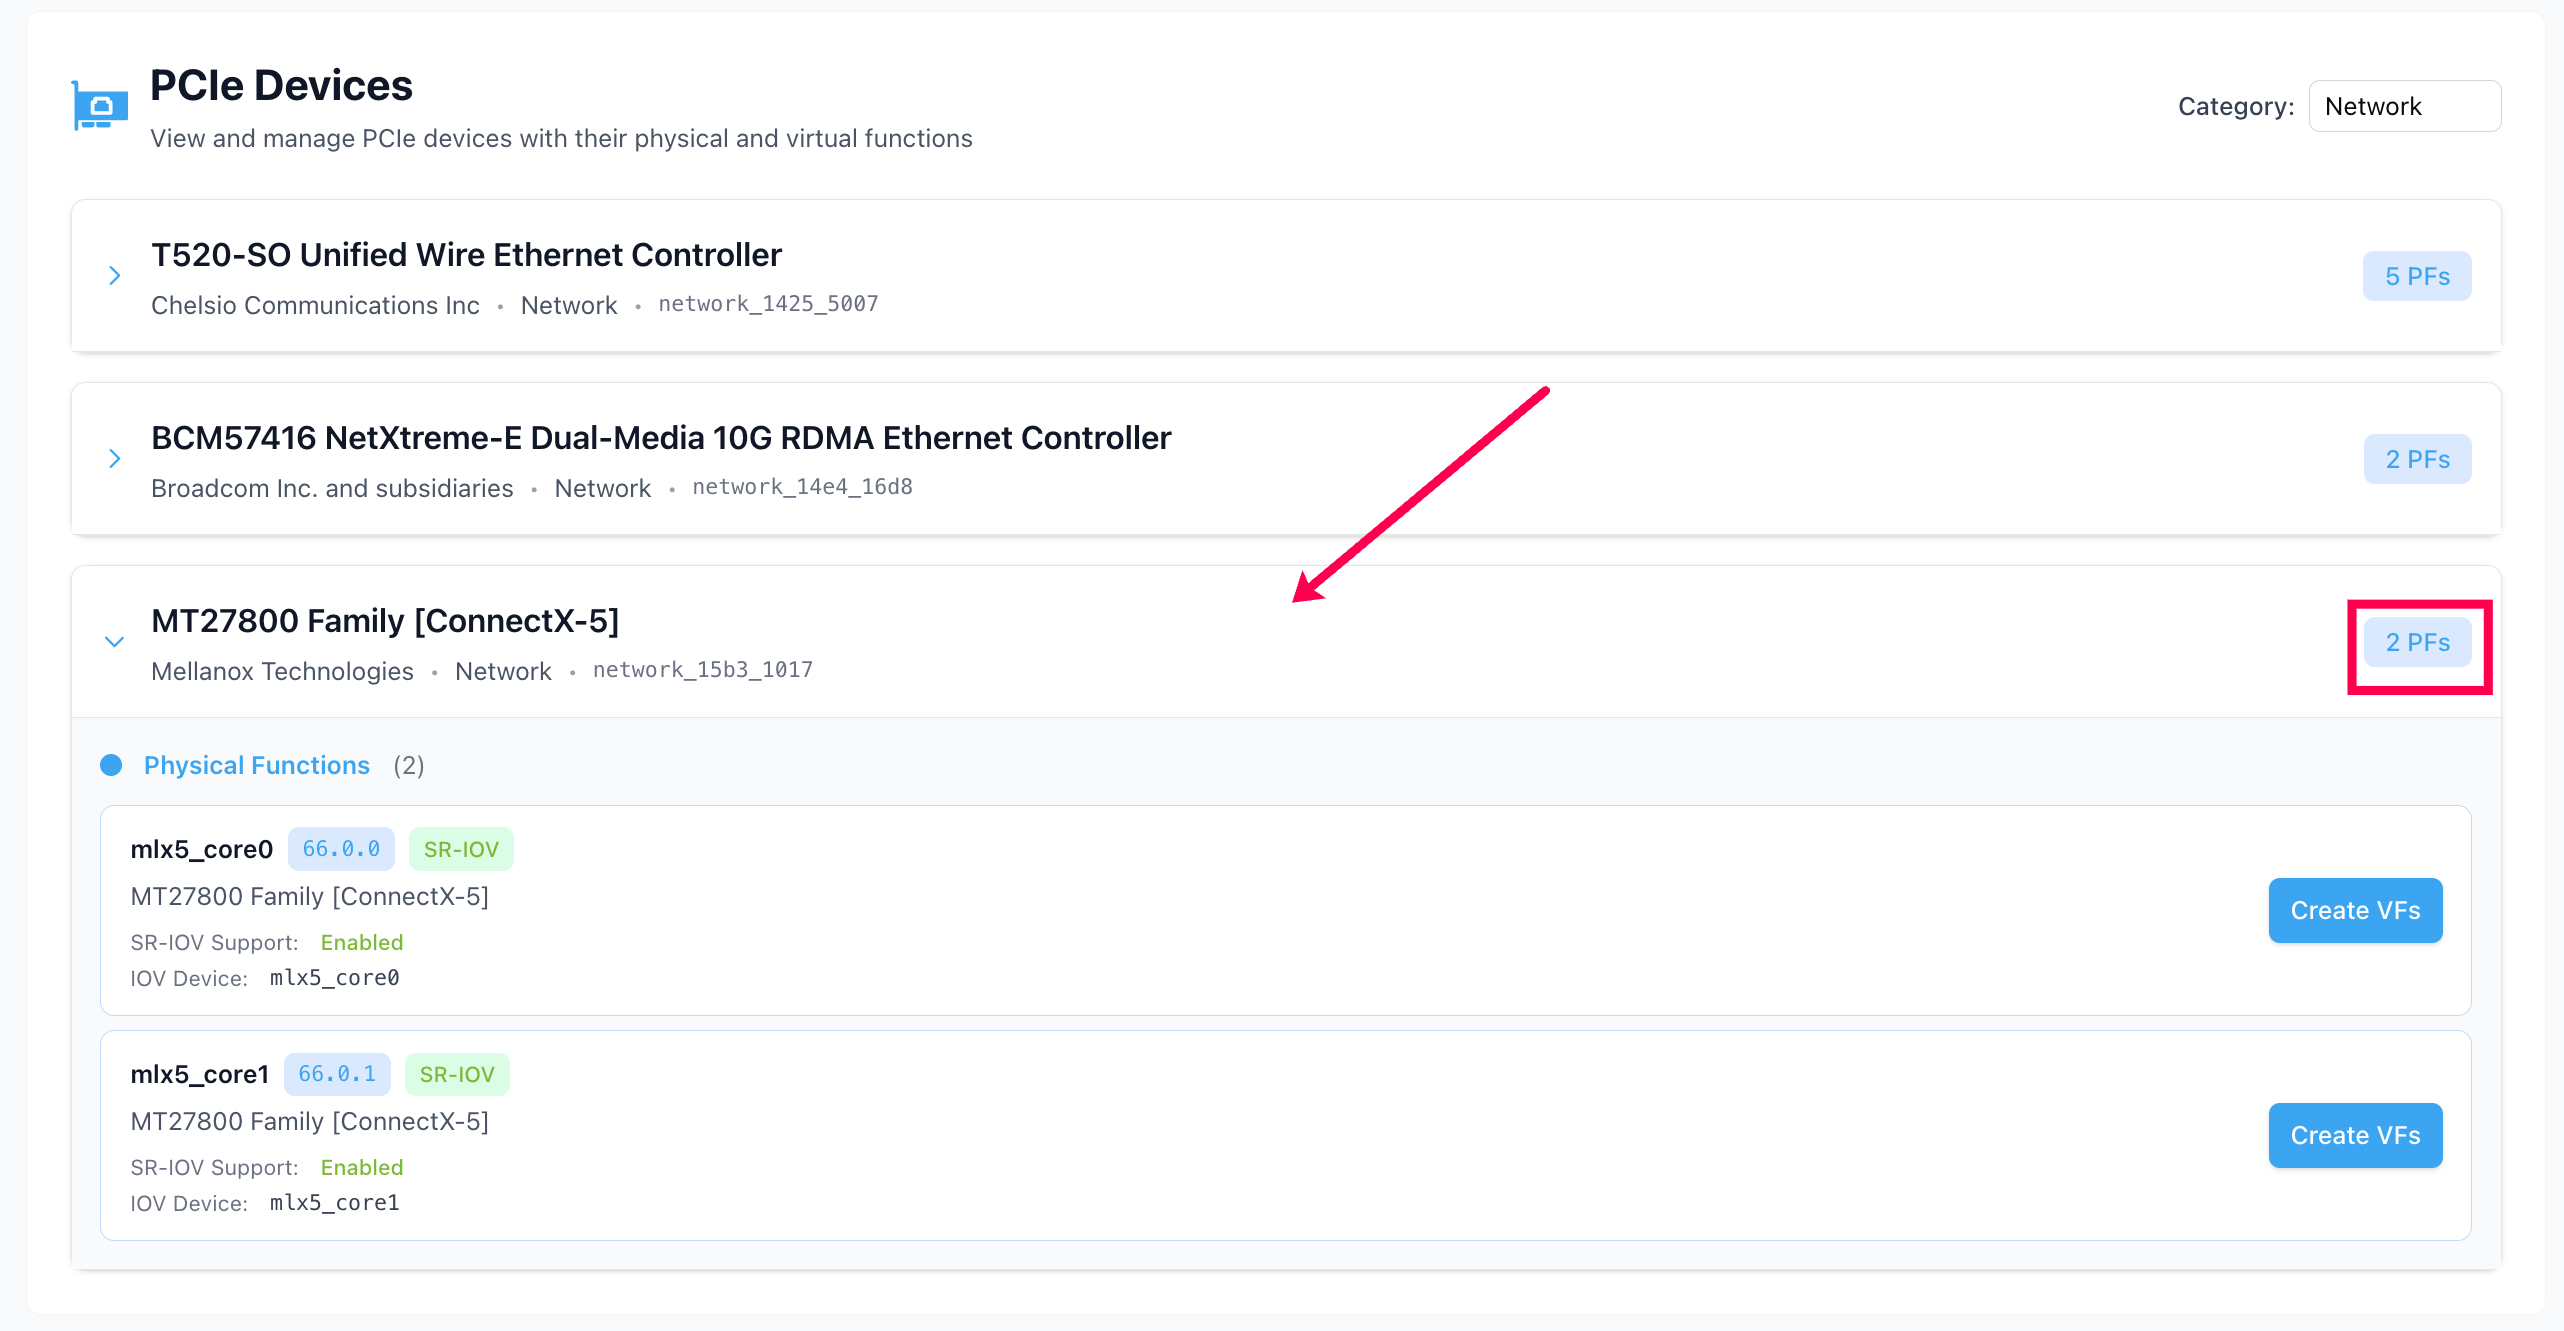
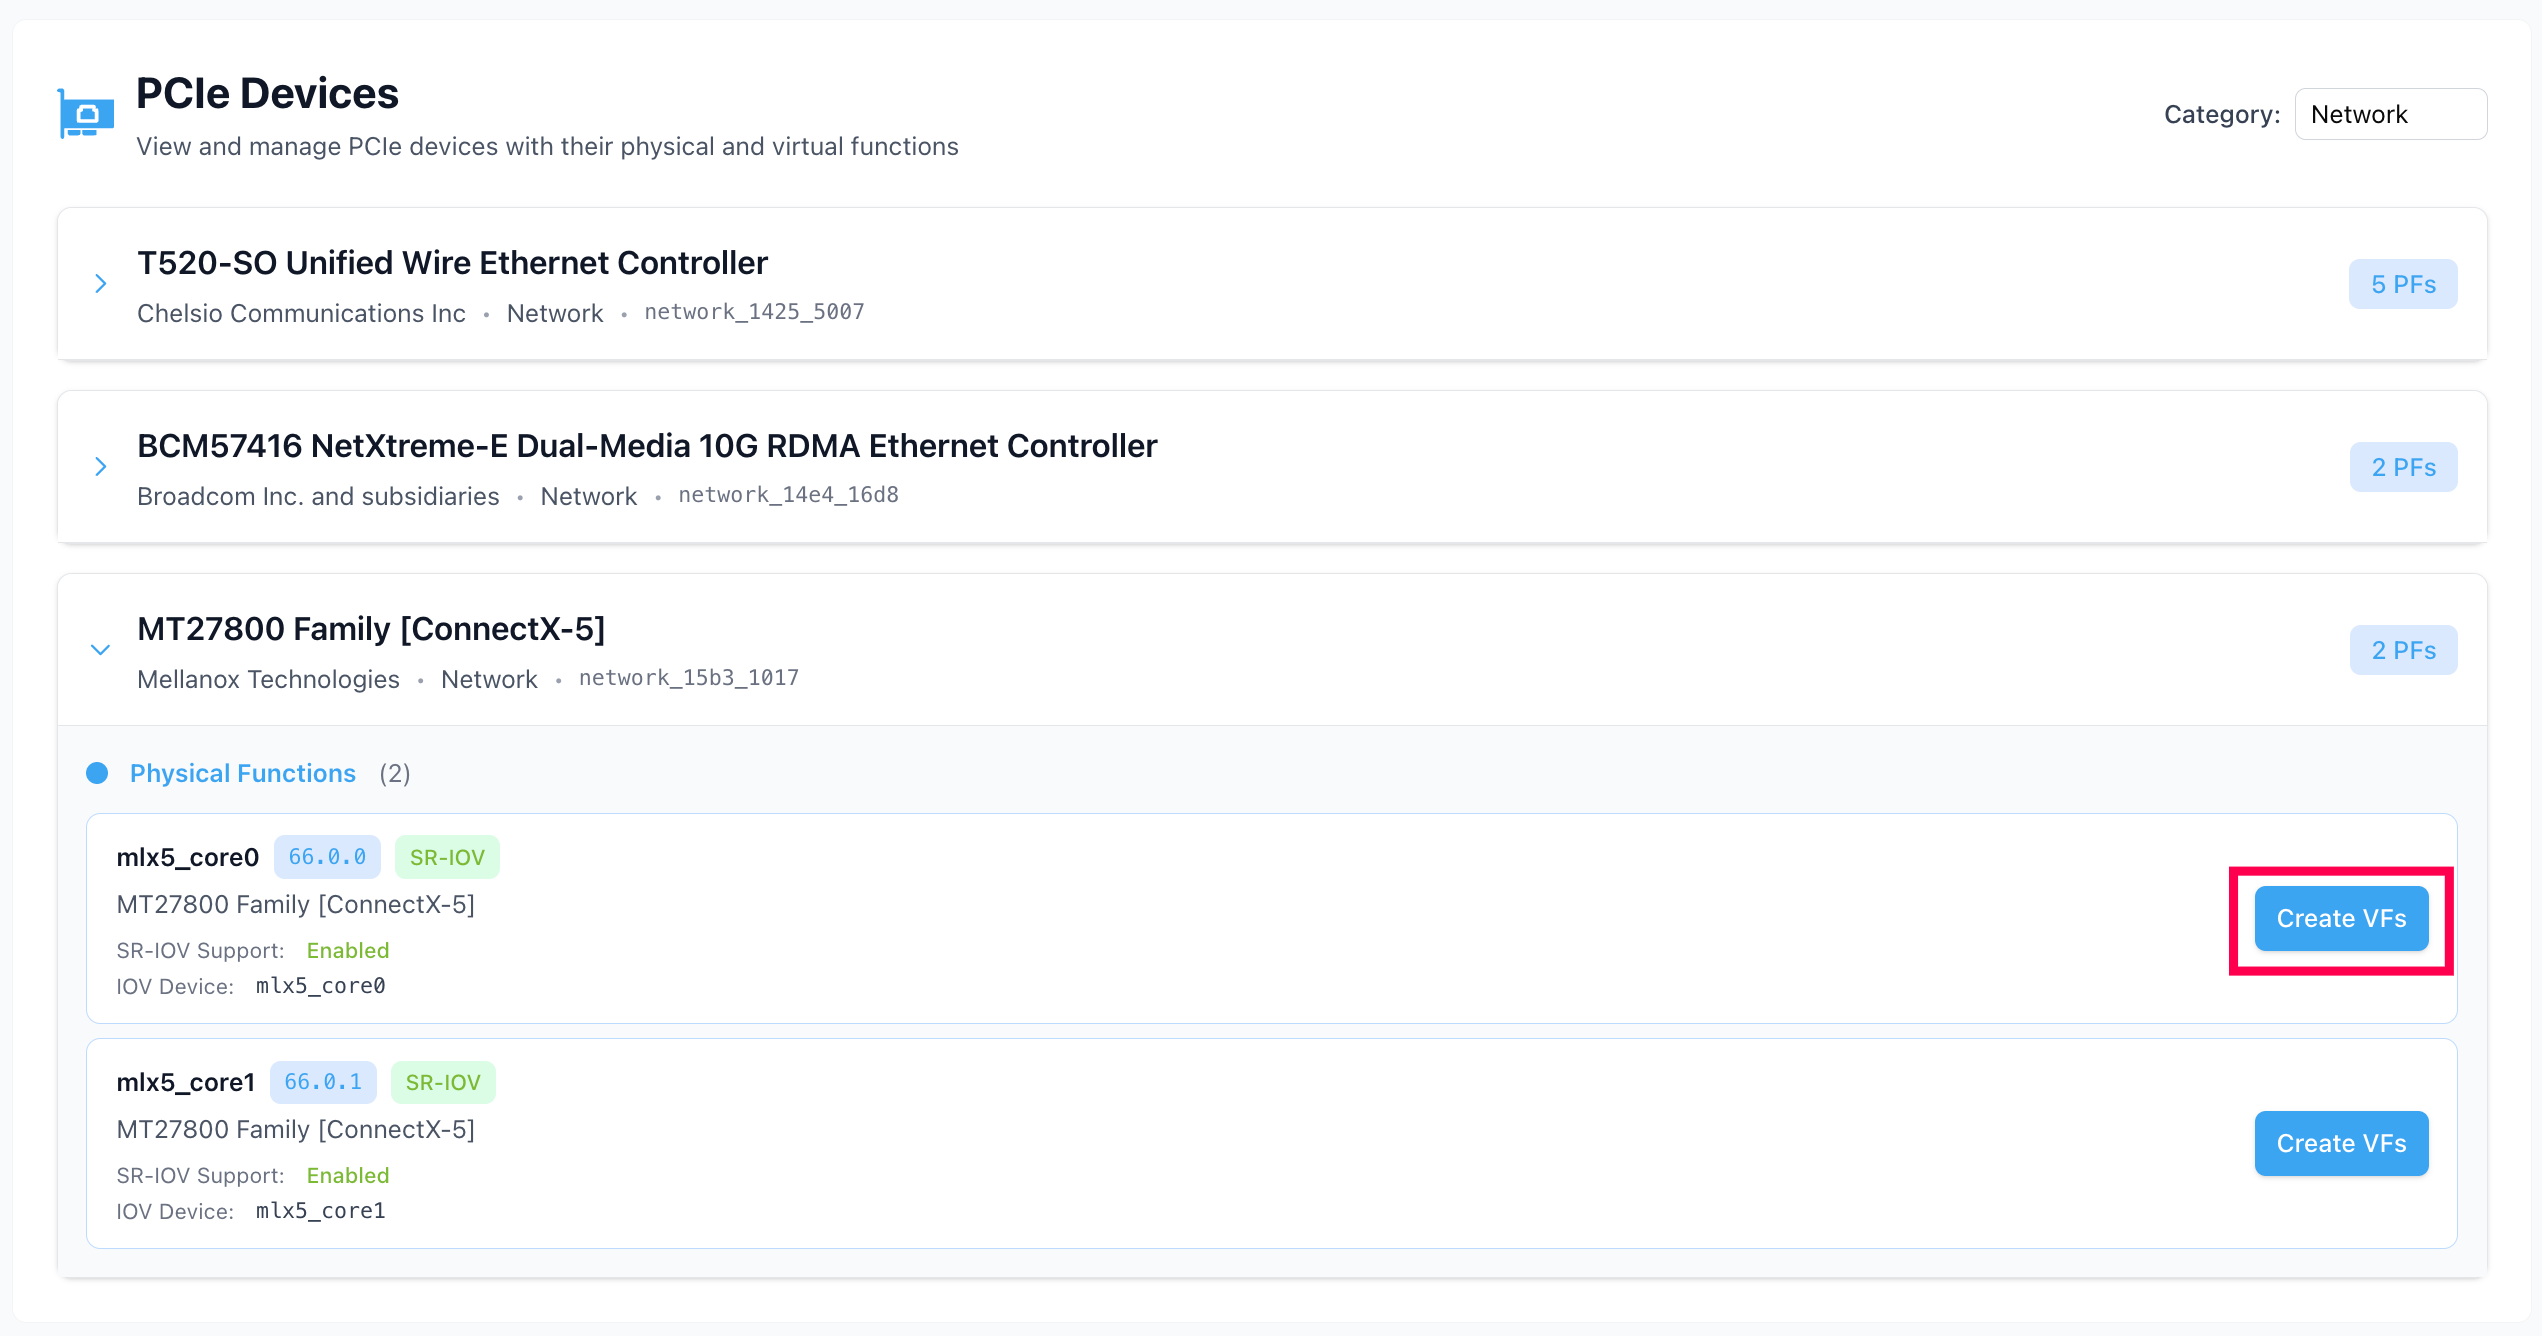
- Step 2: Click Create VFs Button
Click the blue “Create VFs” button next to supported devices.
- Step 3: Configure Virtual Functions
A dialog box appears with the following options:
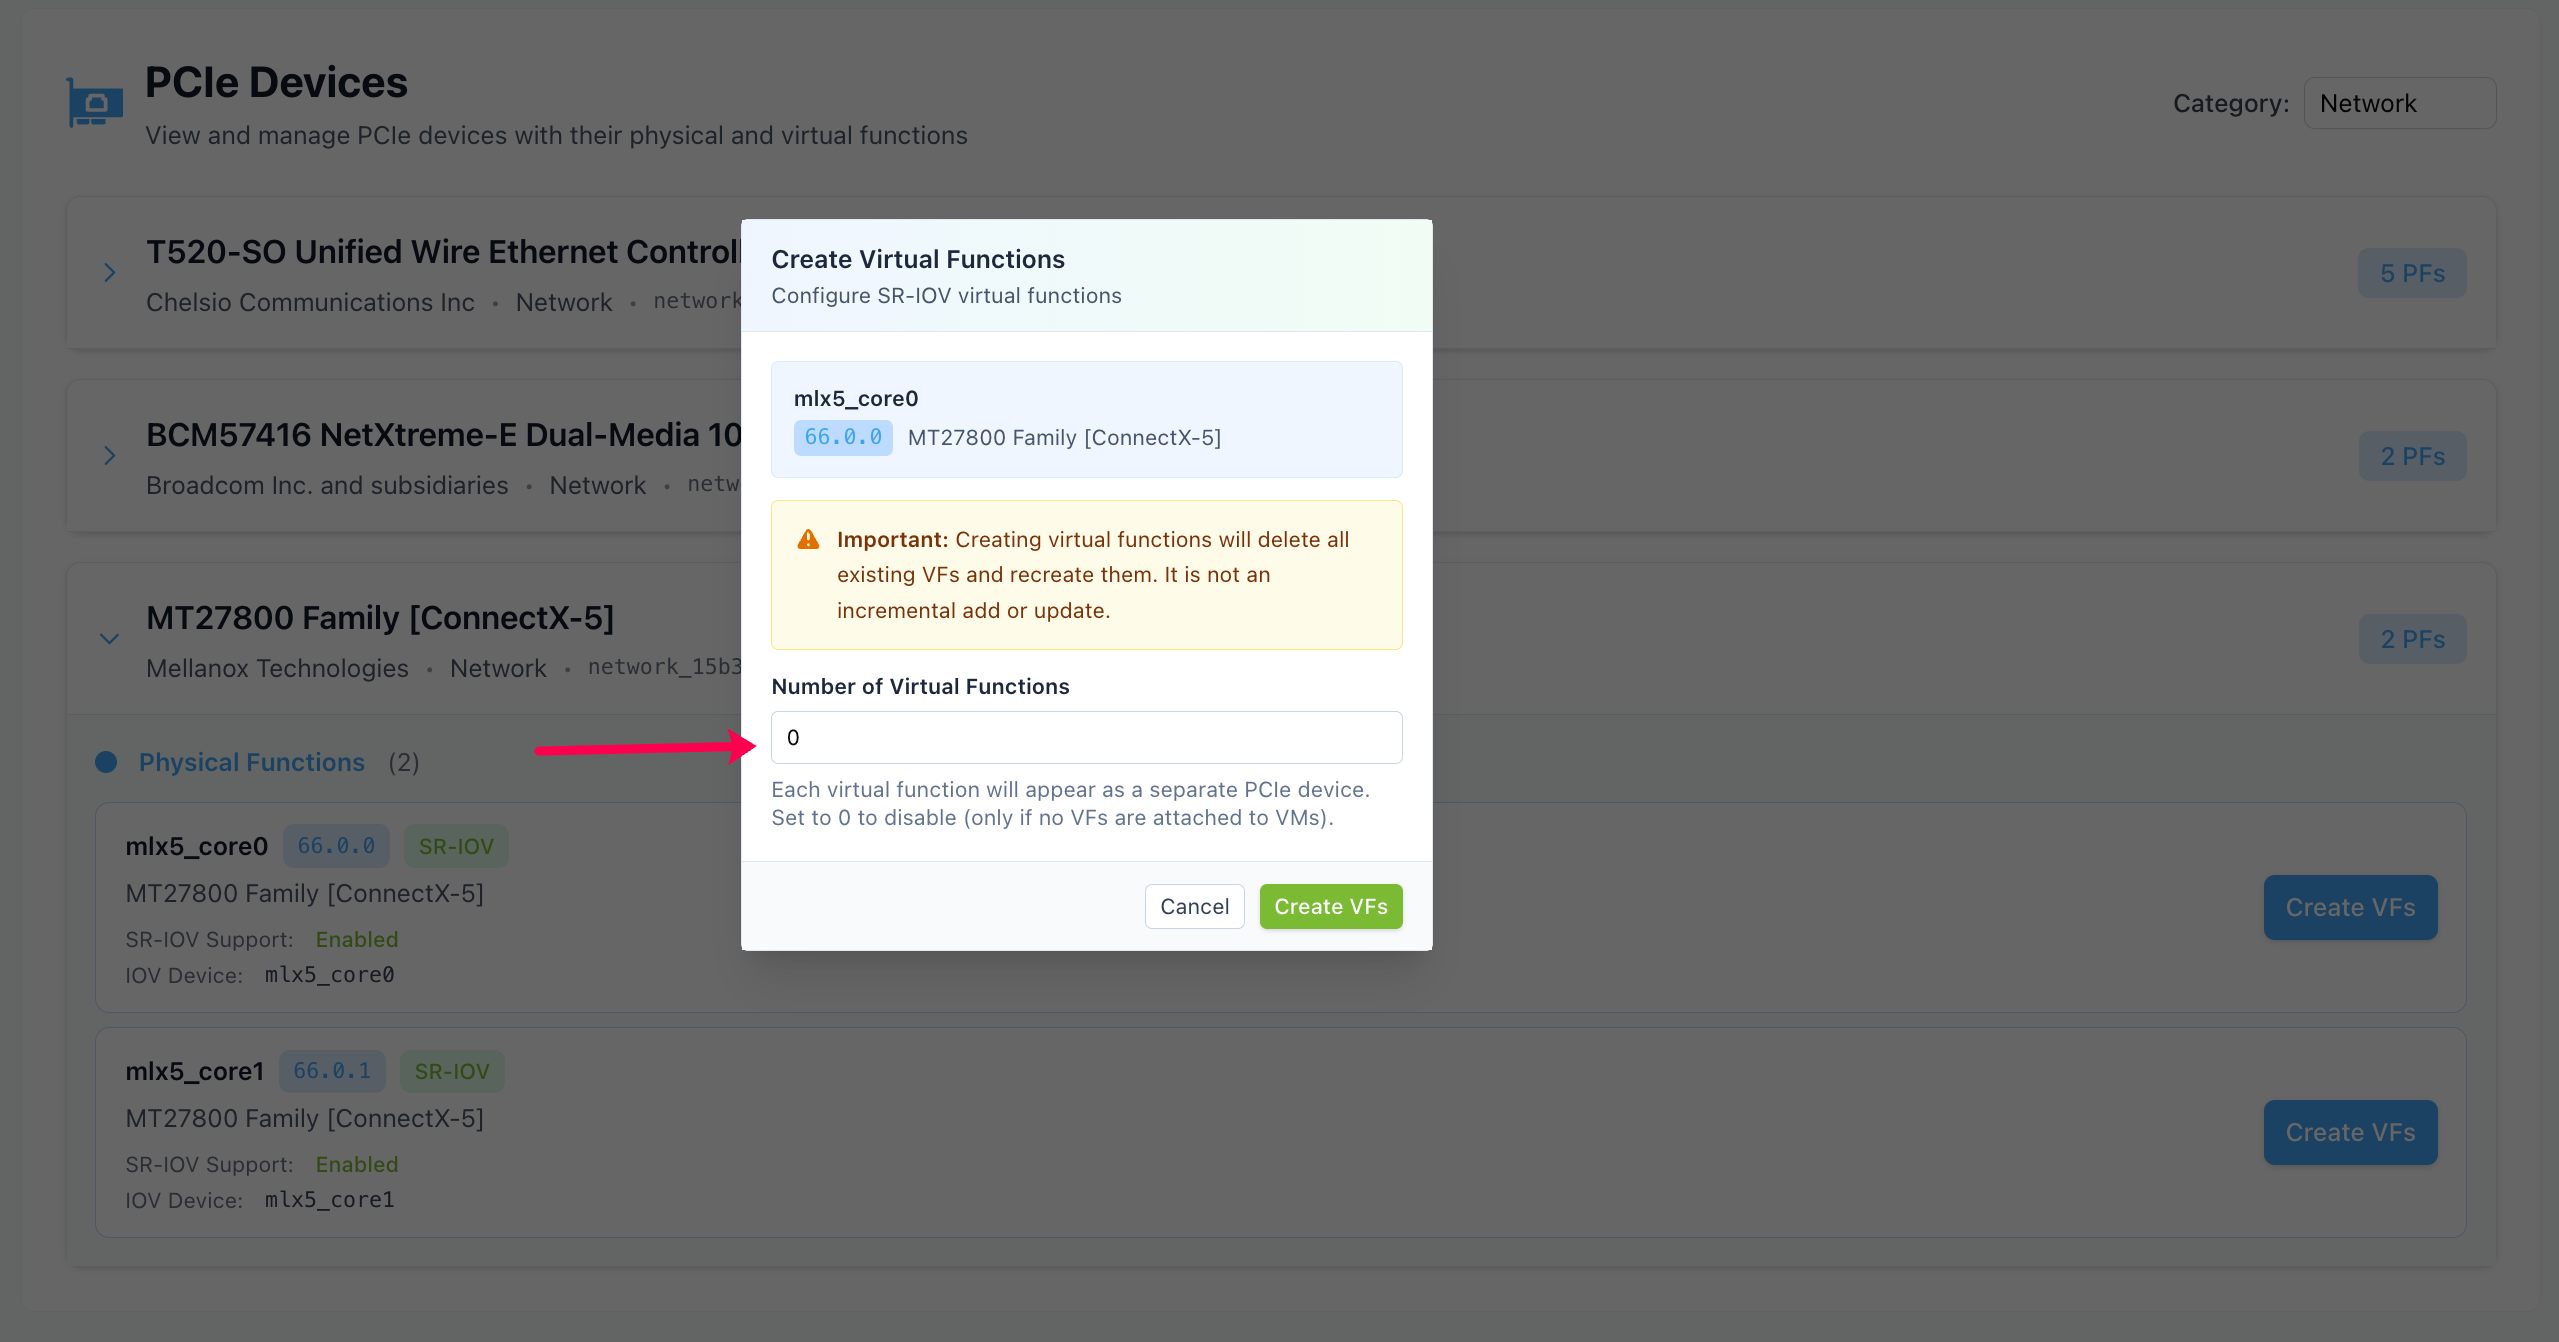
Device Selection: Shows the selected device (e.g., “ix1 - Ethernet Controller X710 for 10GbE SFP+”)
Number of Virtual Functions: Enter how many VFs to create (e.g., 4)
Information: “Each virtual function will appear as a separate PCIe device”
- Step 4: Create VFs
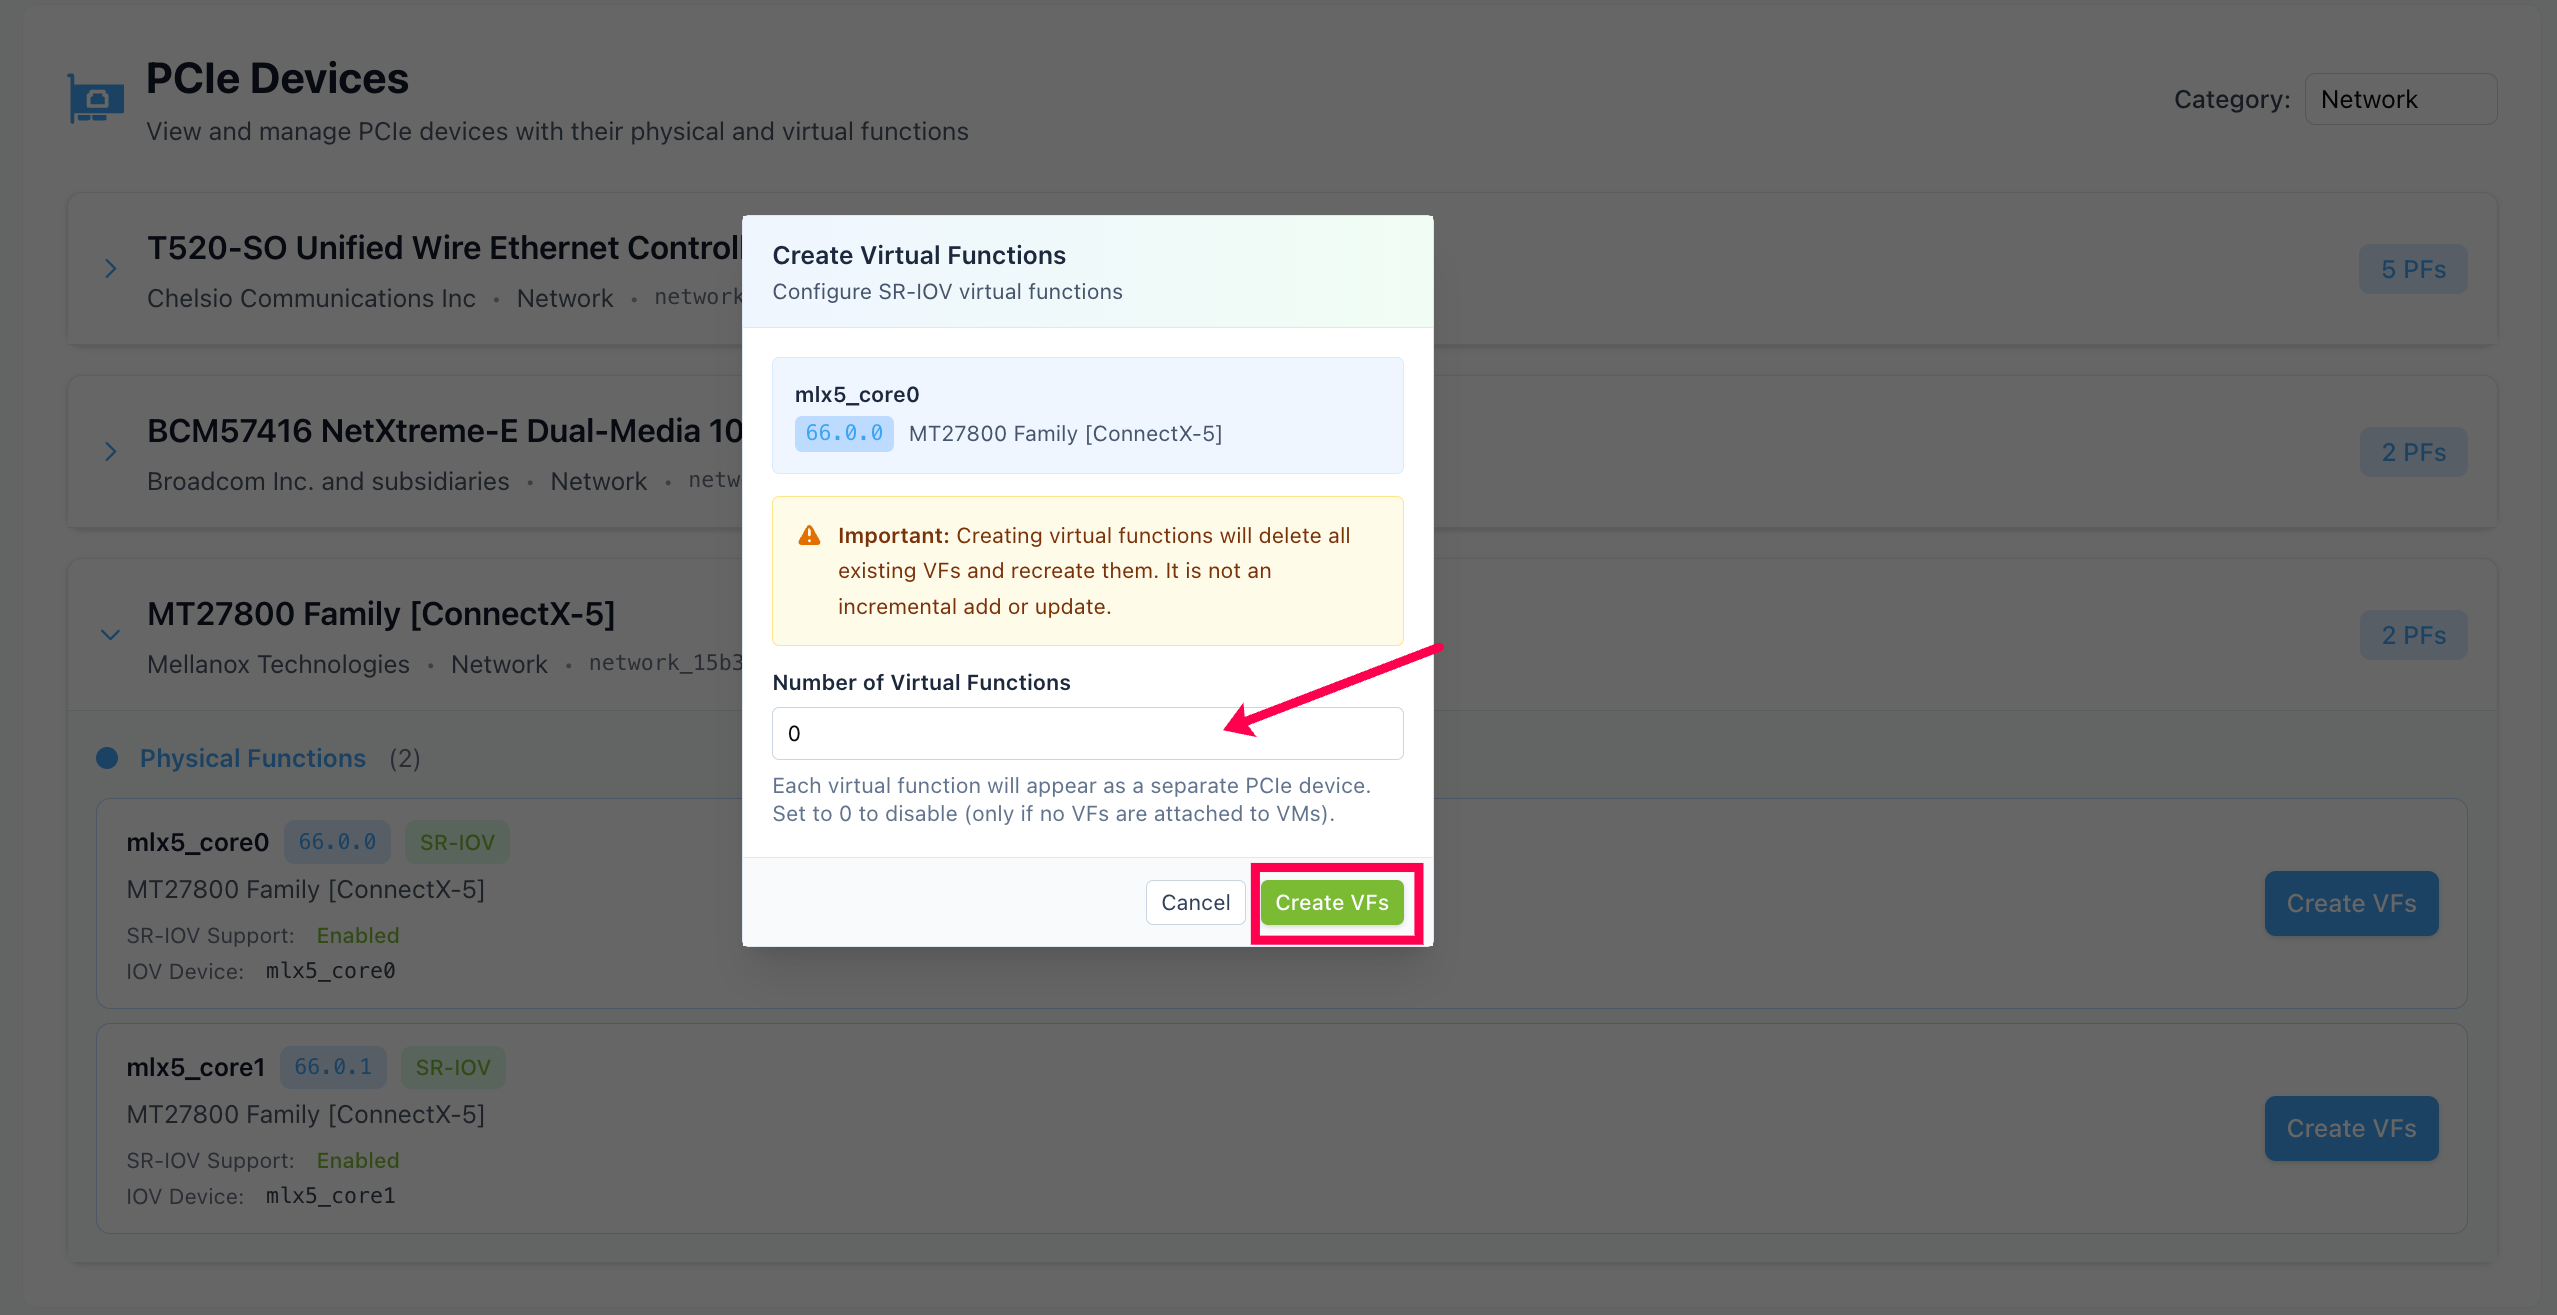
Click “Create VFs” to generate the virtual functions.
- What Happens Next
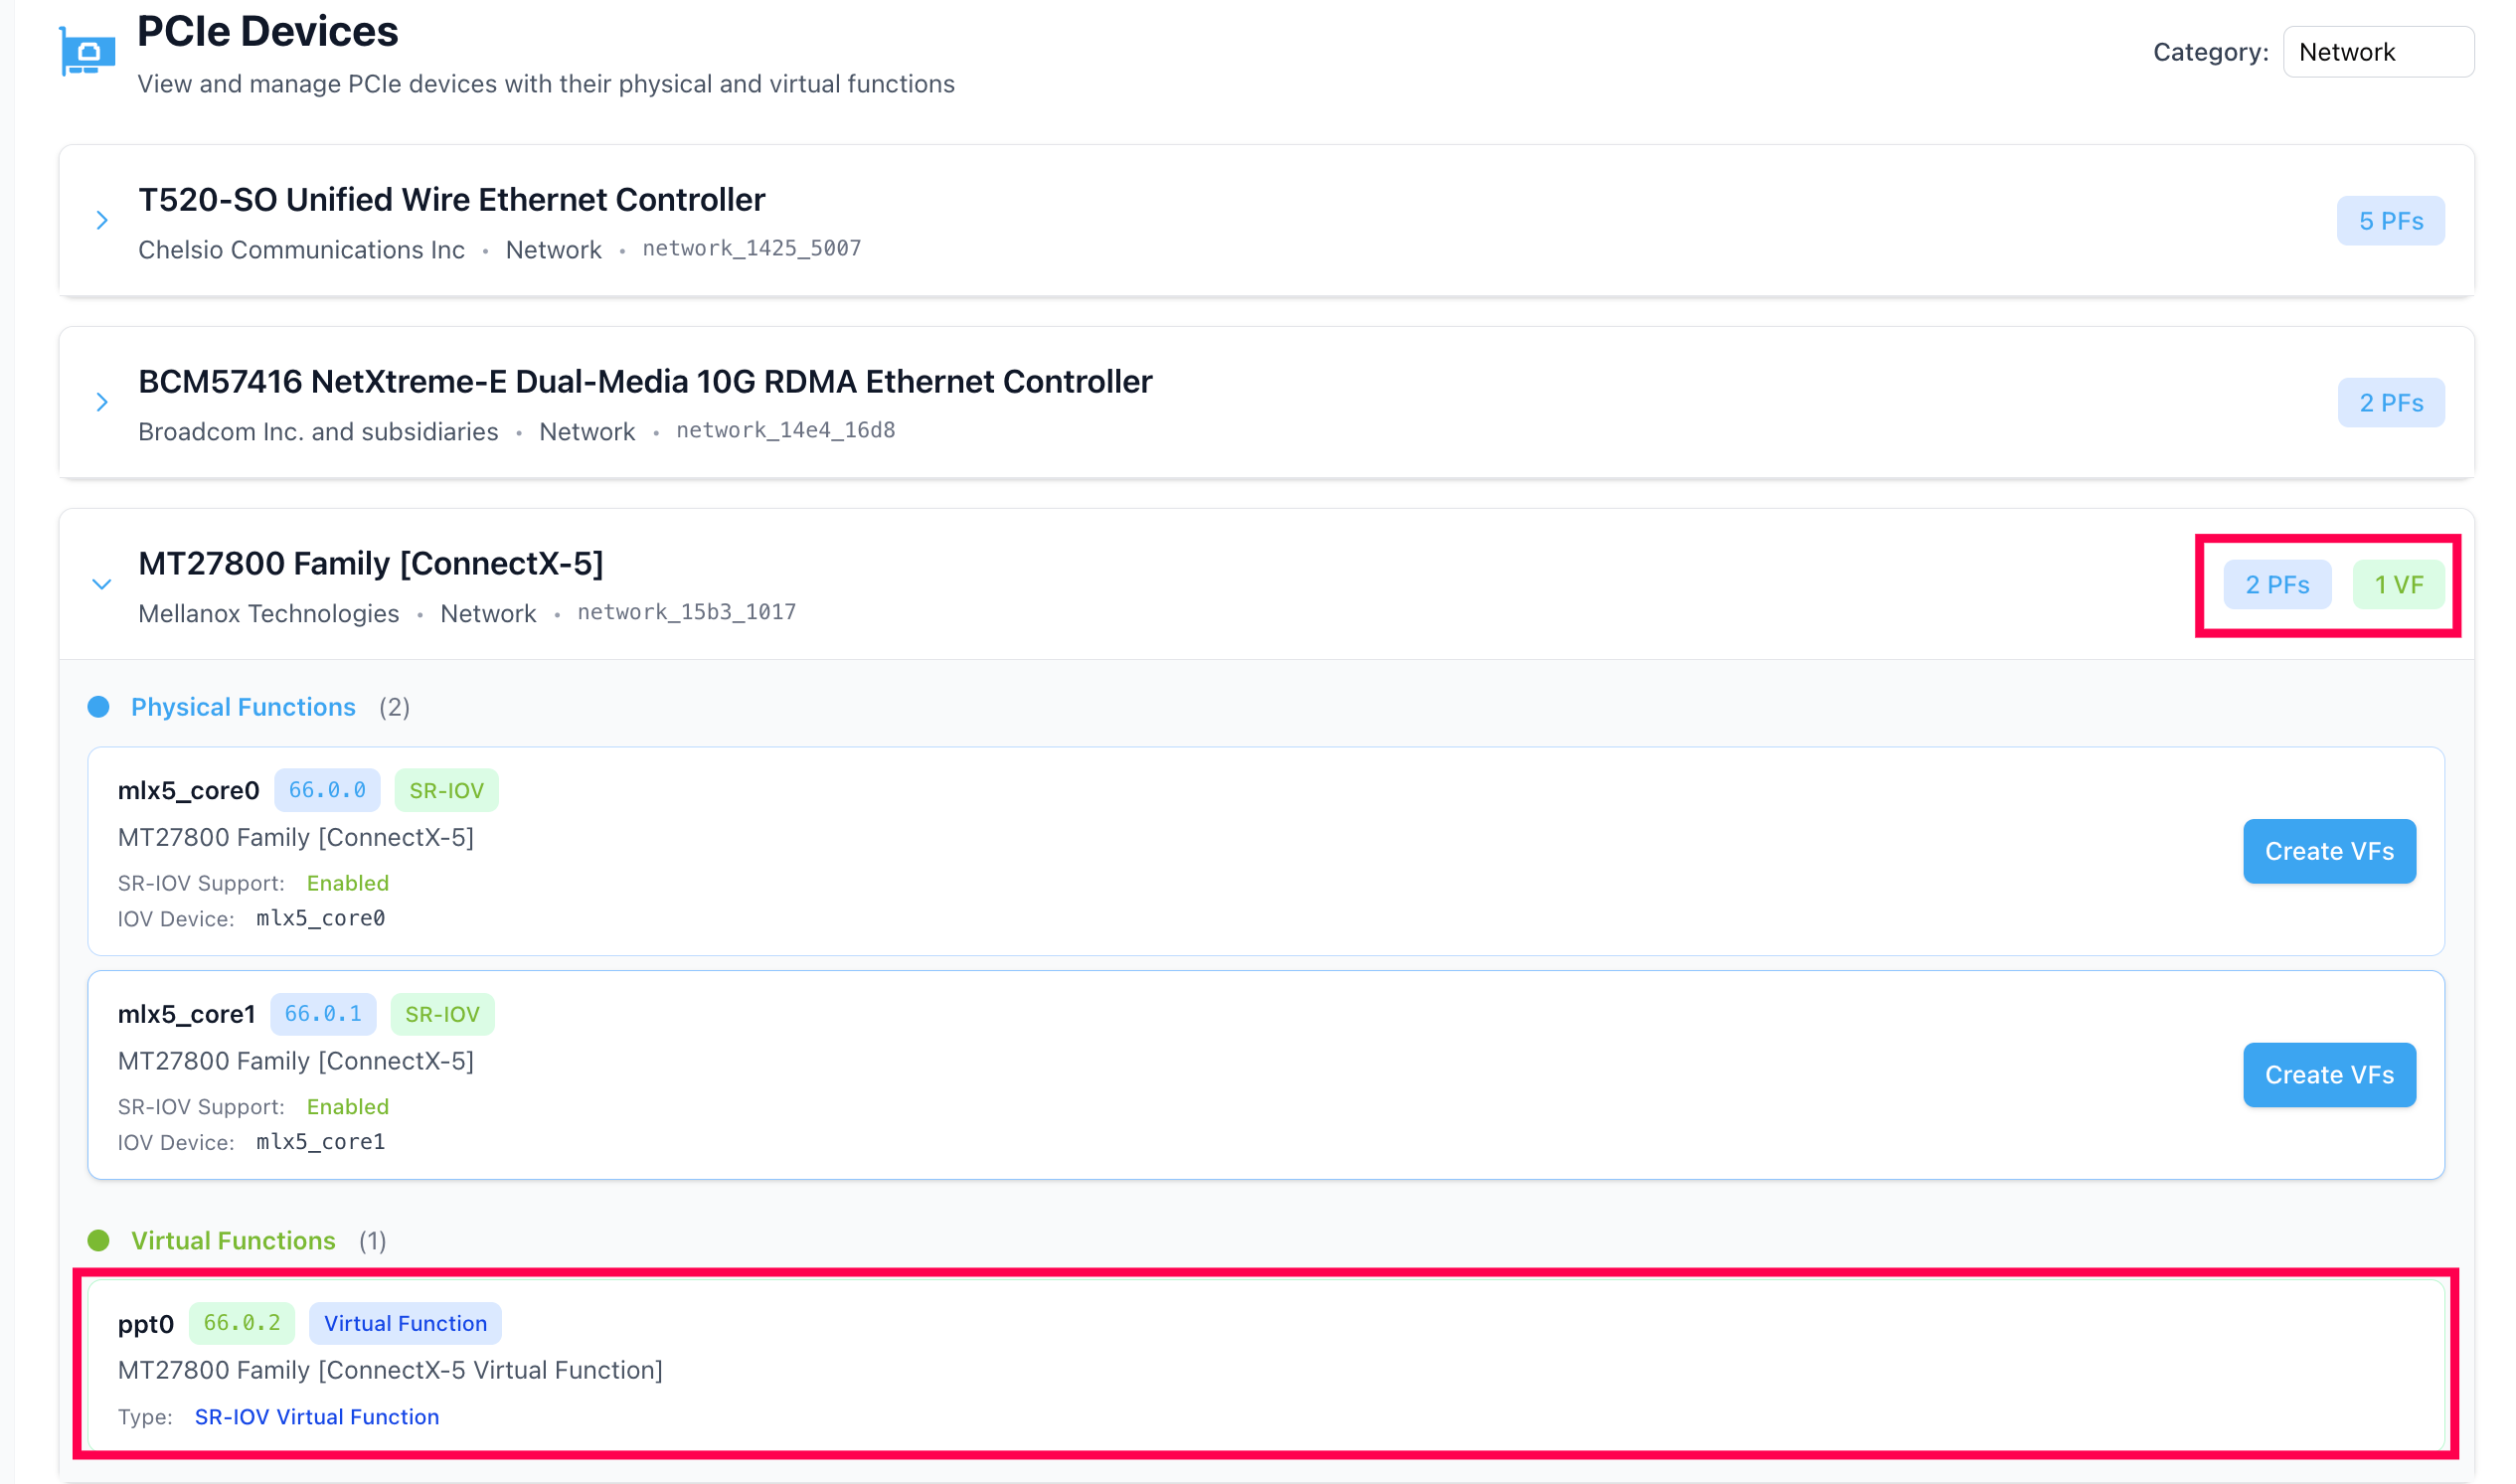
New virtual network interfaces are created
Each VF appears as a separate device in your system
Virtual machines can use these VFs for dedicated network access
Virtual Function Details
Once created, VFs appear in the “Virtual Functions” section:
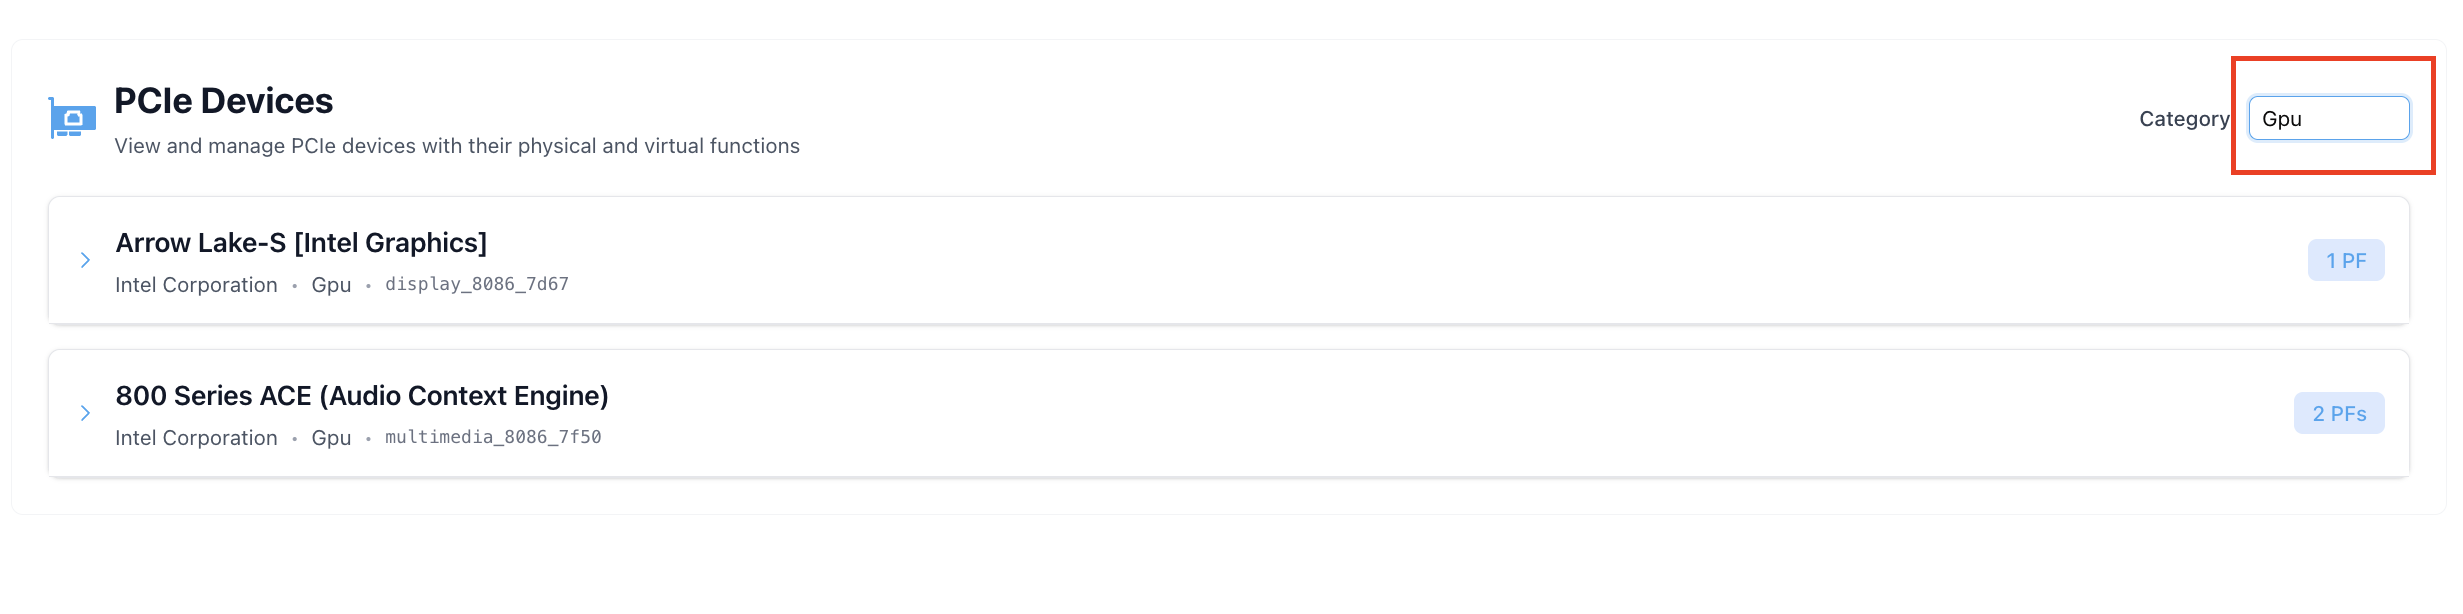
Device Categories and Filtering
The interface provides filtering to help you find specific types of devices:
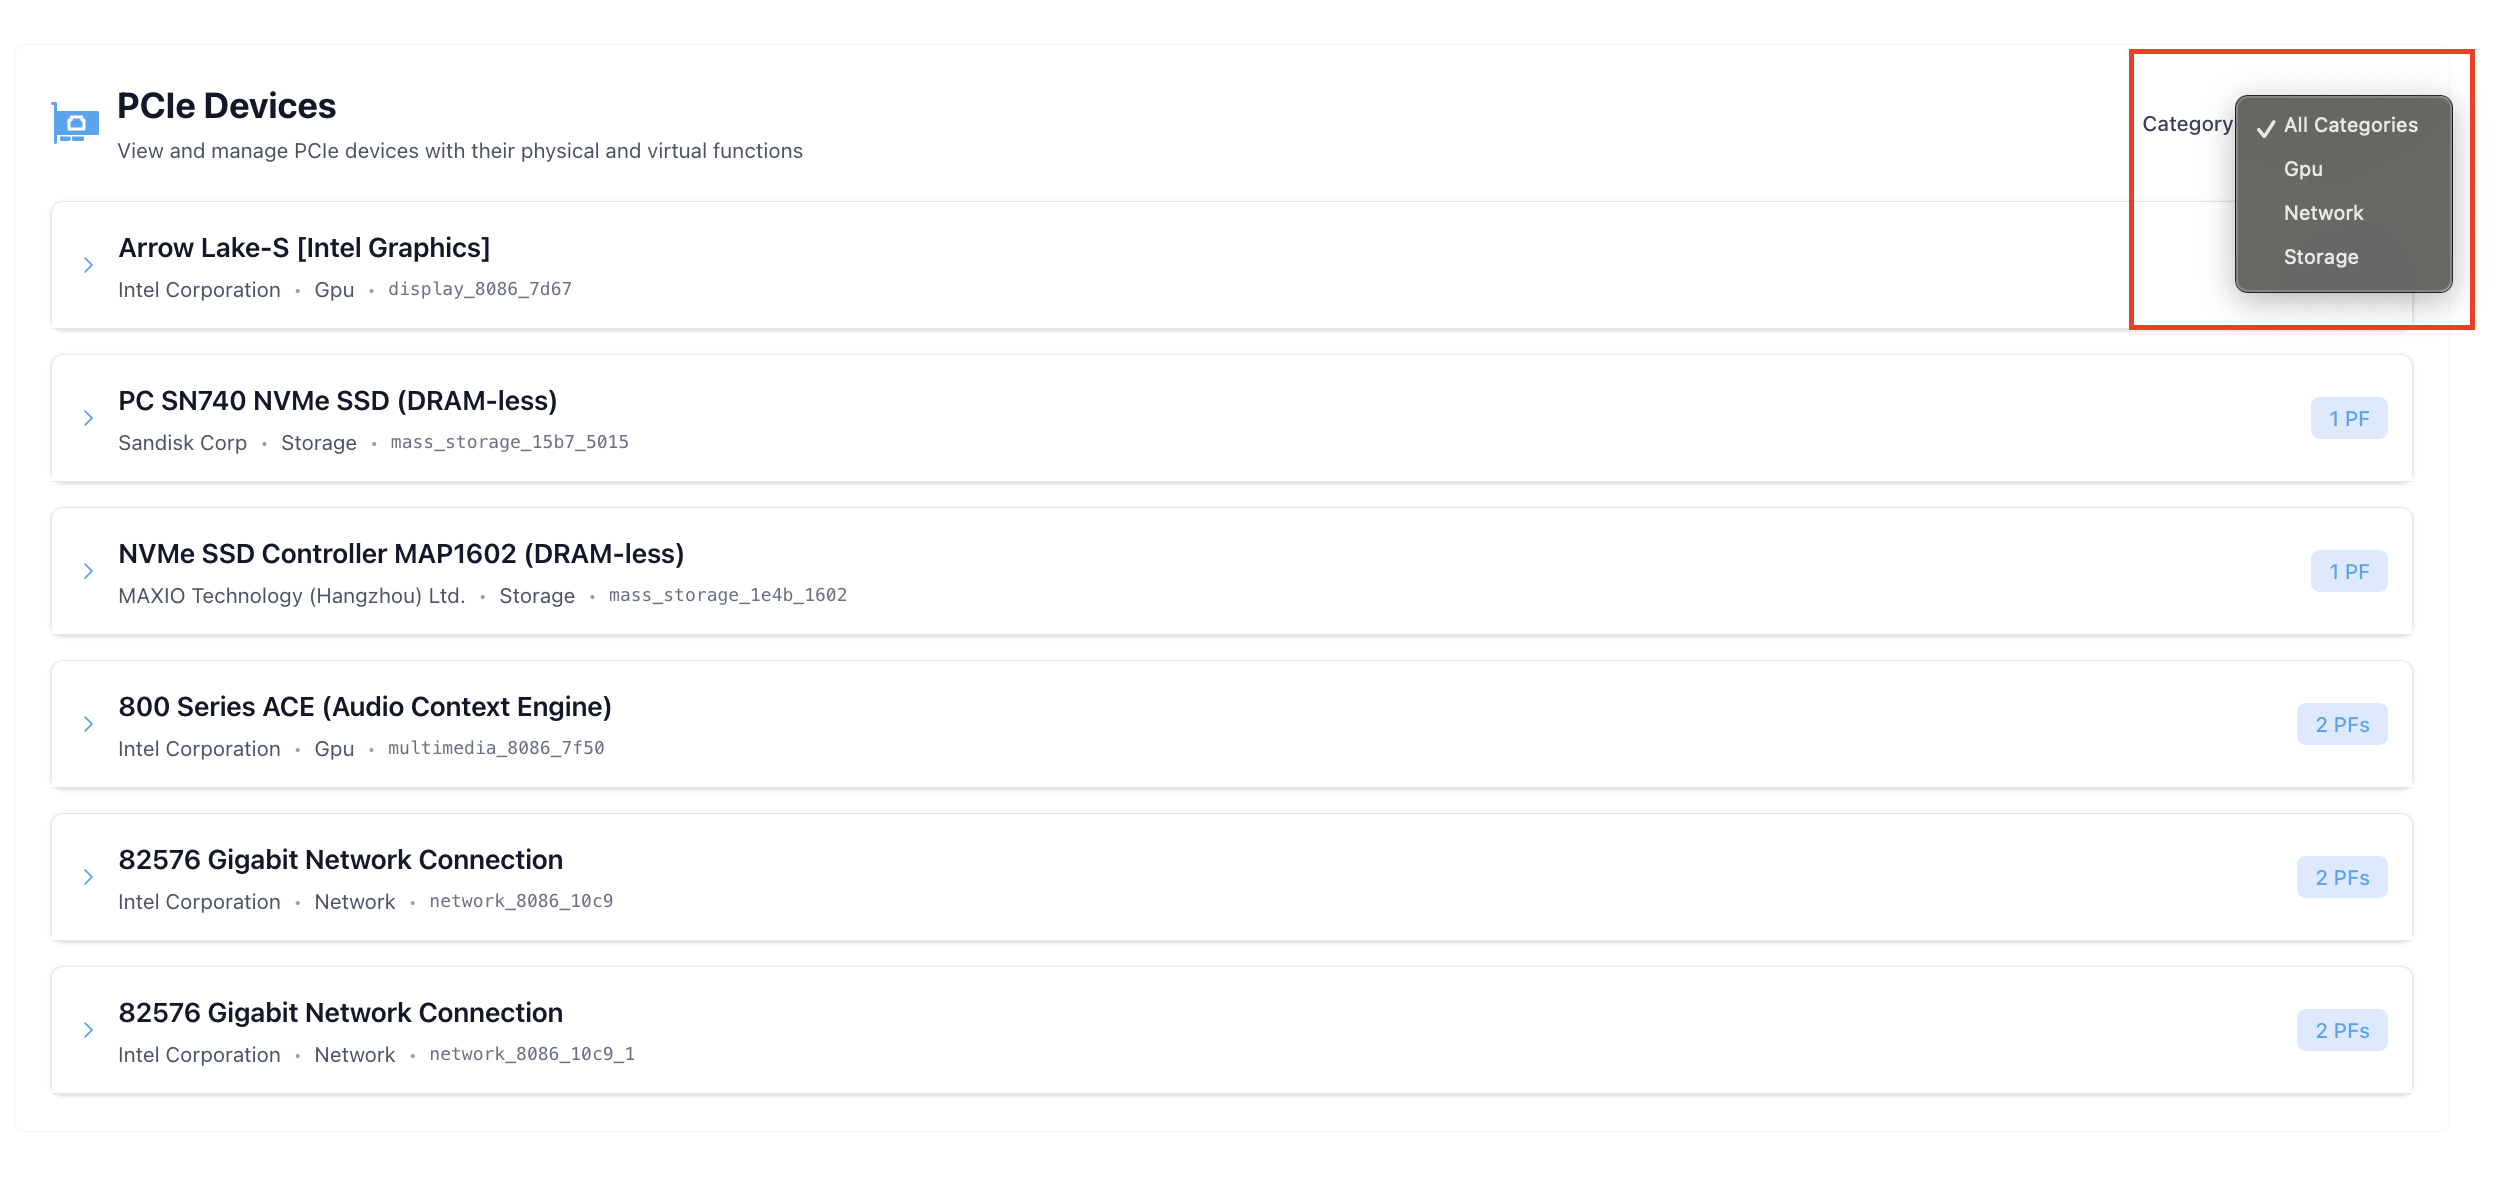
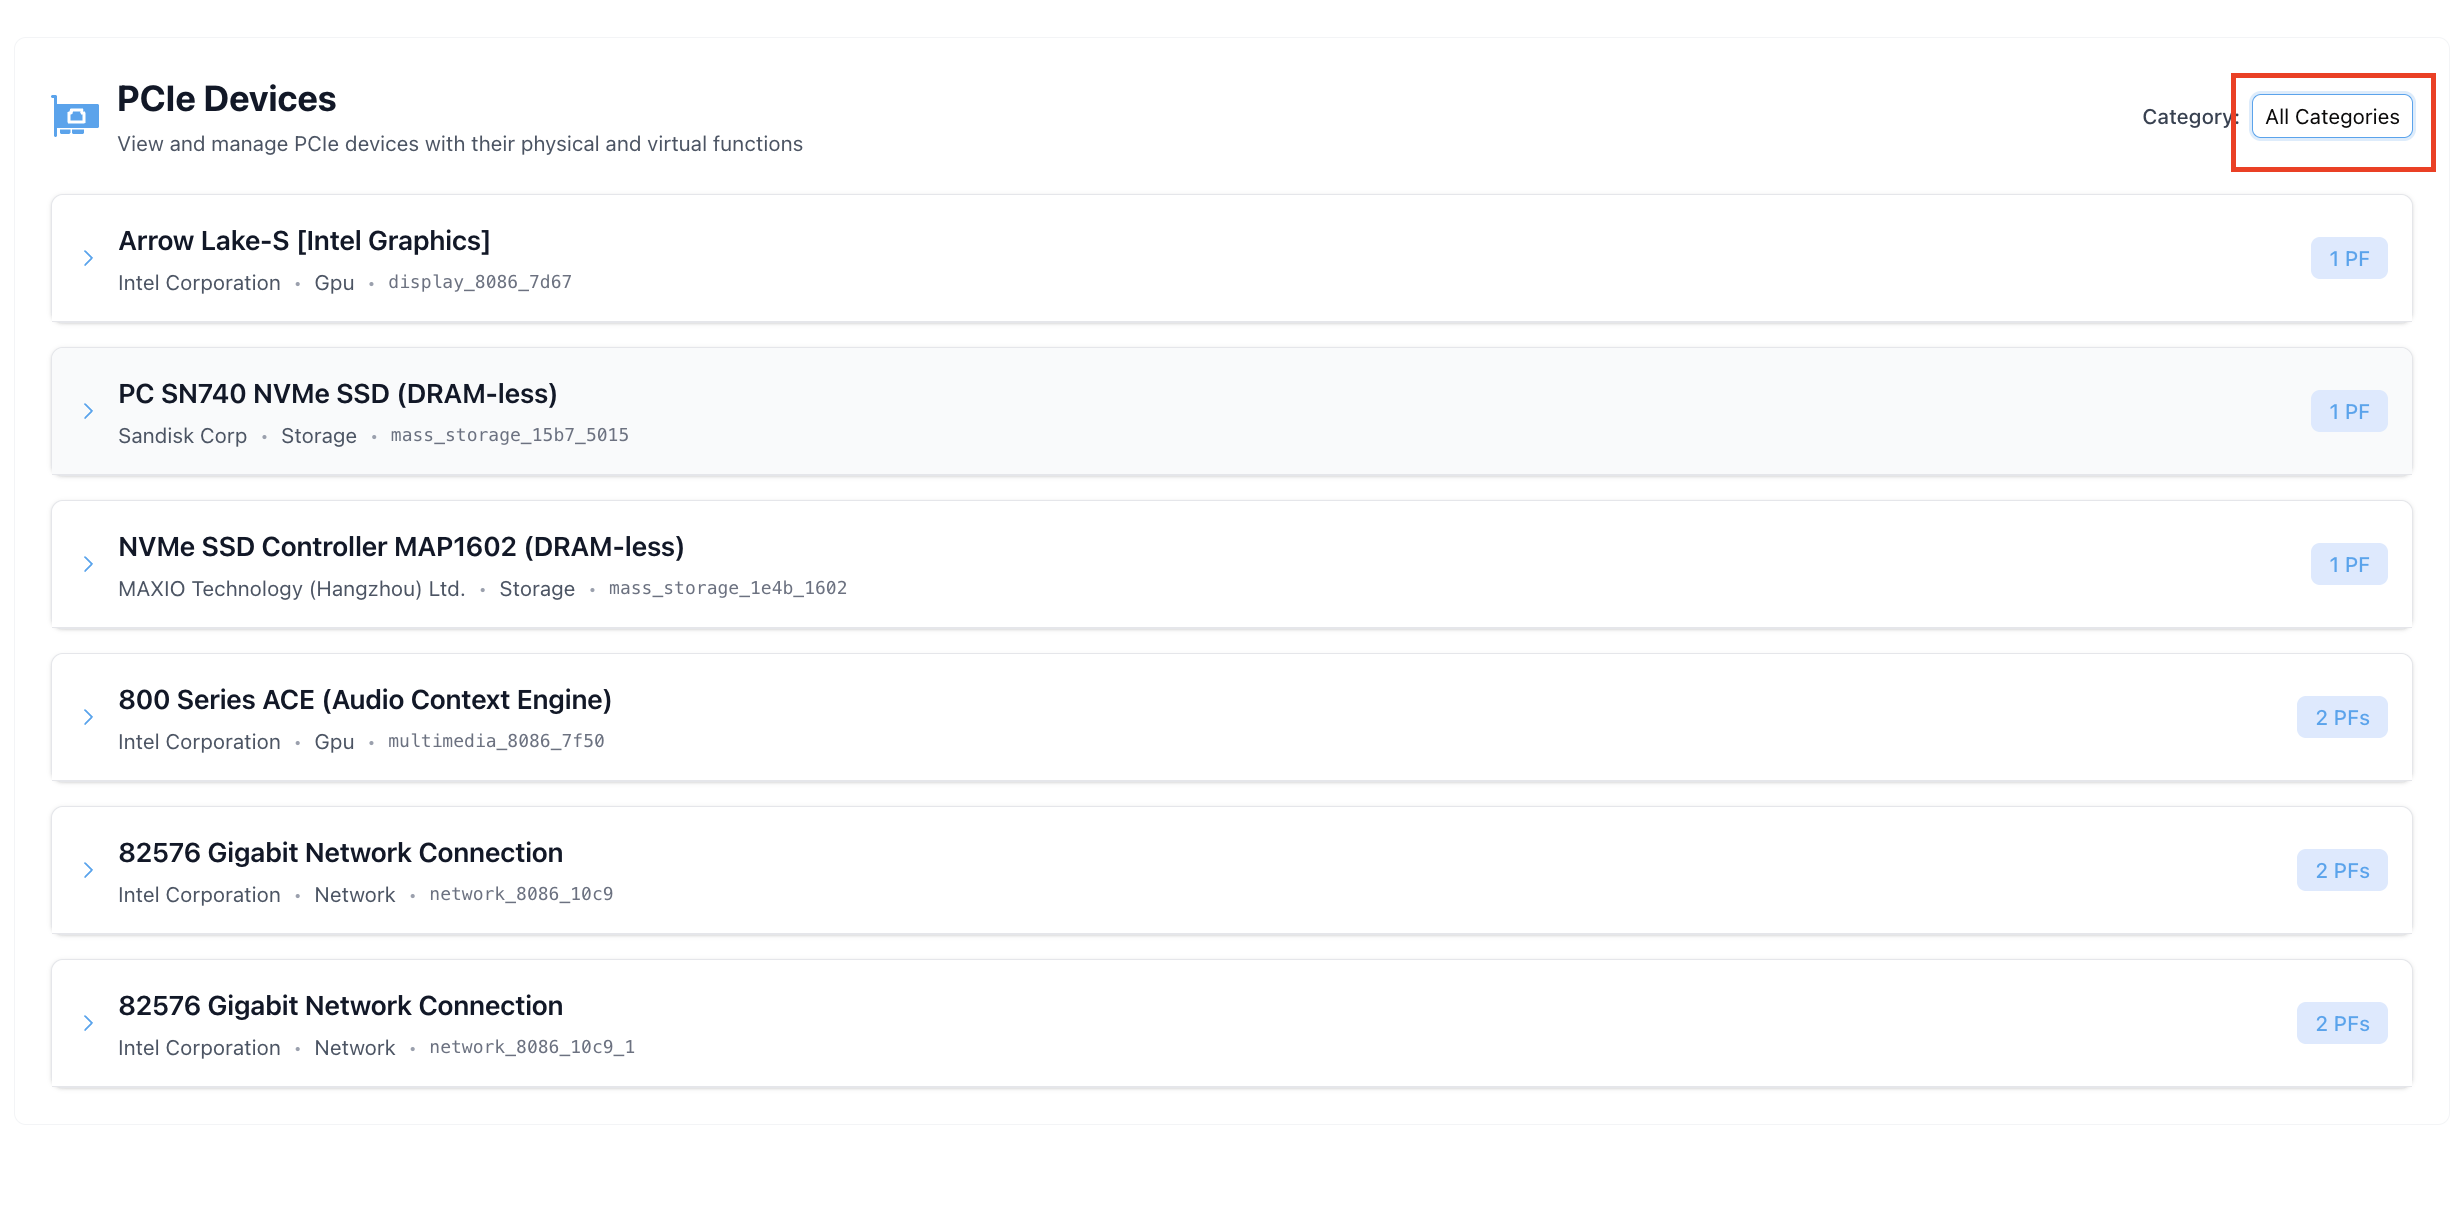
- All Categories
Shows every PCIe device installed in the system, regardless of type.
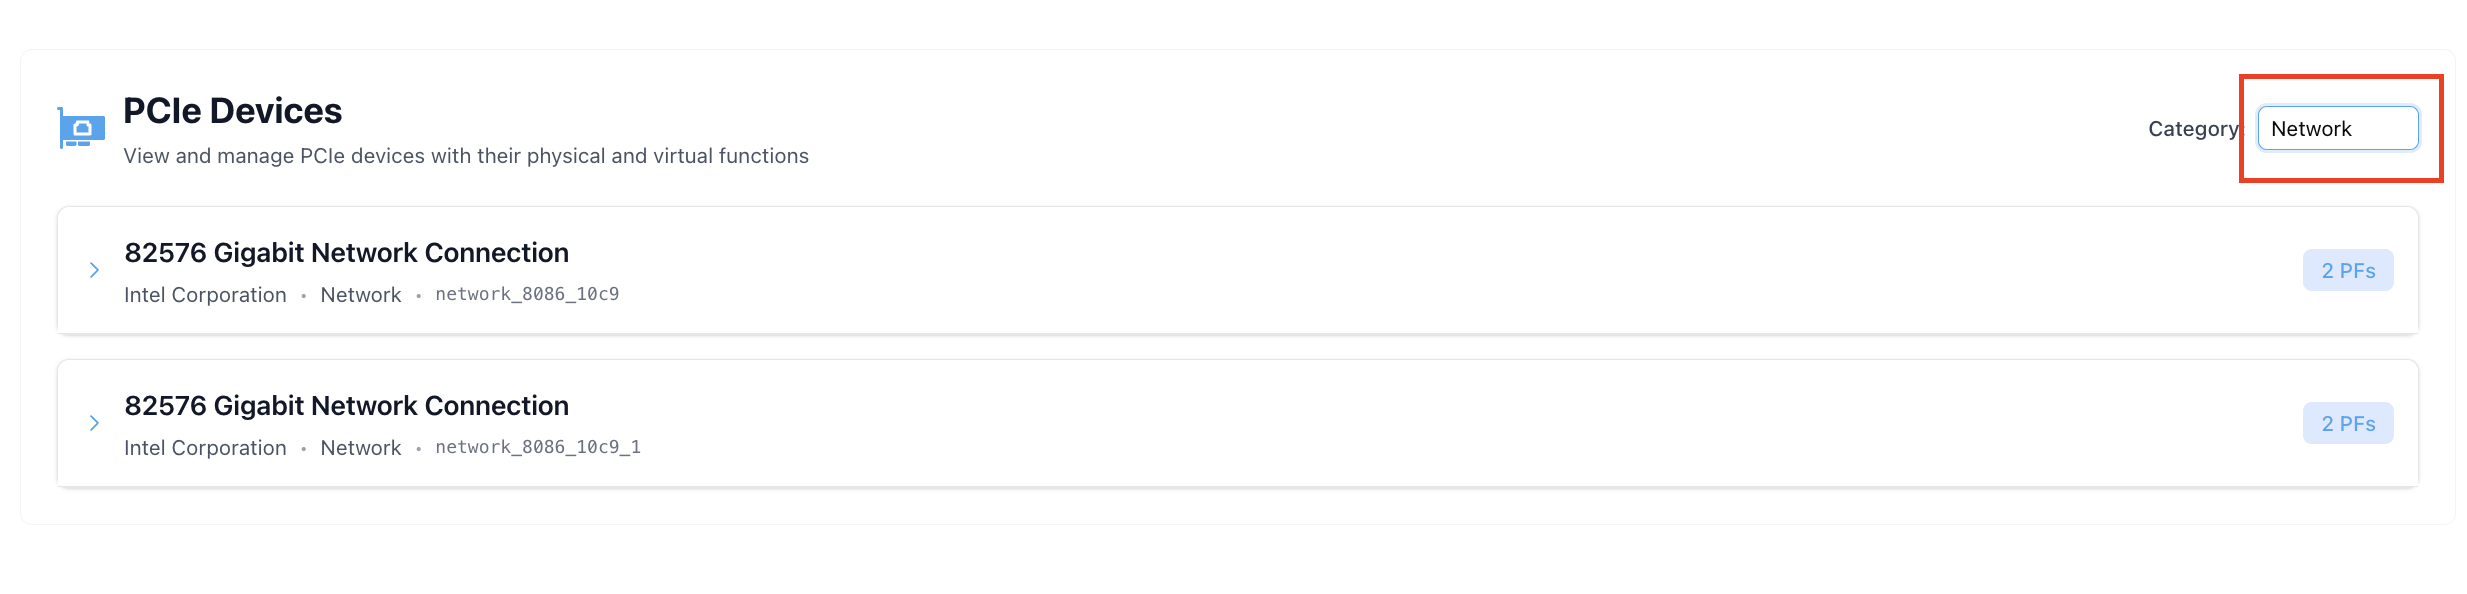
- Network
Displays only networking-related devices such as: * Ethernet controllers * Wireless network adapters * Network interface cards
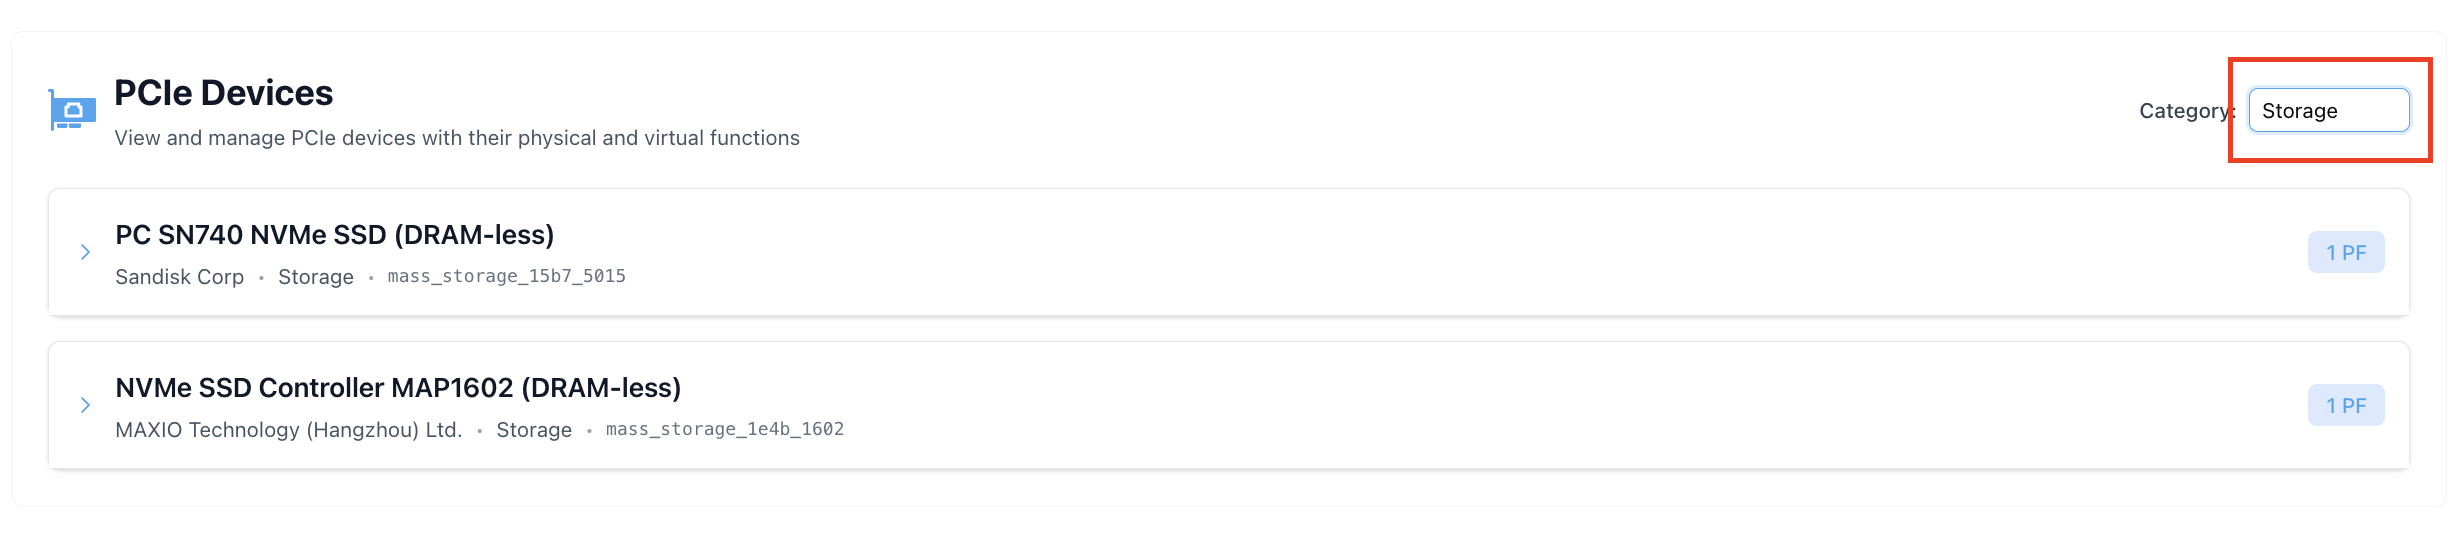
- Storage
Shows only storage-related devices such as: * NVMe SSDs * RAID controllers * Storage host adapters
- GPU
Shows only graphics processing devices such as: * Dedicated graphics cards * Integrated graphics processors * GPU compute accelerators * Professional workstation graphics cards
Common Use Cases
Typical PCIe Device Scenarios
- Storage Expansion
Scenario: Need more or faster storage
Solution: Add NVMe PCIe SSDs for high-speed storage
Benefit: Much faster than traditional hard drives
- Network Performance
Scenario: Need faster network connections
Solution: Install 10GbE or higher speed network cards
Benefit: Faster data transfer for server applications
- Virtualization
Scenario: Multiple virtual machines need dedicated network access
Solution: Create Virtual Functions (VFs) on capable network cards
Benefit: Each VM gets its own virtual network interface
- Wireless Connectivity
Scenario: Server needs Wi-Fi capabilities
Solution: Install PCIe wireless network adapter
Benefit: Wireless connectivity without external dongles
Status Indicators
- 1 PF (Physical Function)
Meaning: Device has 1 physical port/interface
Color: Blue text
Usage: Shows actual hardware capabilities
- 4 VFs (Virtual Functions)
Meaning: Device can create up to 4 virtual interfaces
Color: Green text
Usage: Indicates virtualization capabilities
- Create VFs Button
Appearance: Blue button
Function: Allows creation of virtual functions
Availability: Only on SR-IOV capable devices
- Assignment Status
router-1: Green text showing VF is assigned to a virtual machine
Unassigned: VF is available for use
Troubleshooting Common Issues
Device Recognition Problems
- Issue: Device not appearing in list
Cause: Device not properly seated in PCIe slot
Solution: Check physical connection and reseat card
- Issue: Device shows but no functions available
Cause: Driver not loaded or incompatible
Solution: Install proper device drivers
Virtual Function Issues
- Issue: Cannot create VFs
Cause: Device doesn’t support SR-IOV
Solution: Verify device specifications for SR-IOV support
- Issue: VFs not appearing after creation
Cause: Insufficient system resources or BIOS settings
Solution: Check BIOS for virtualization settings
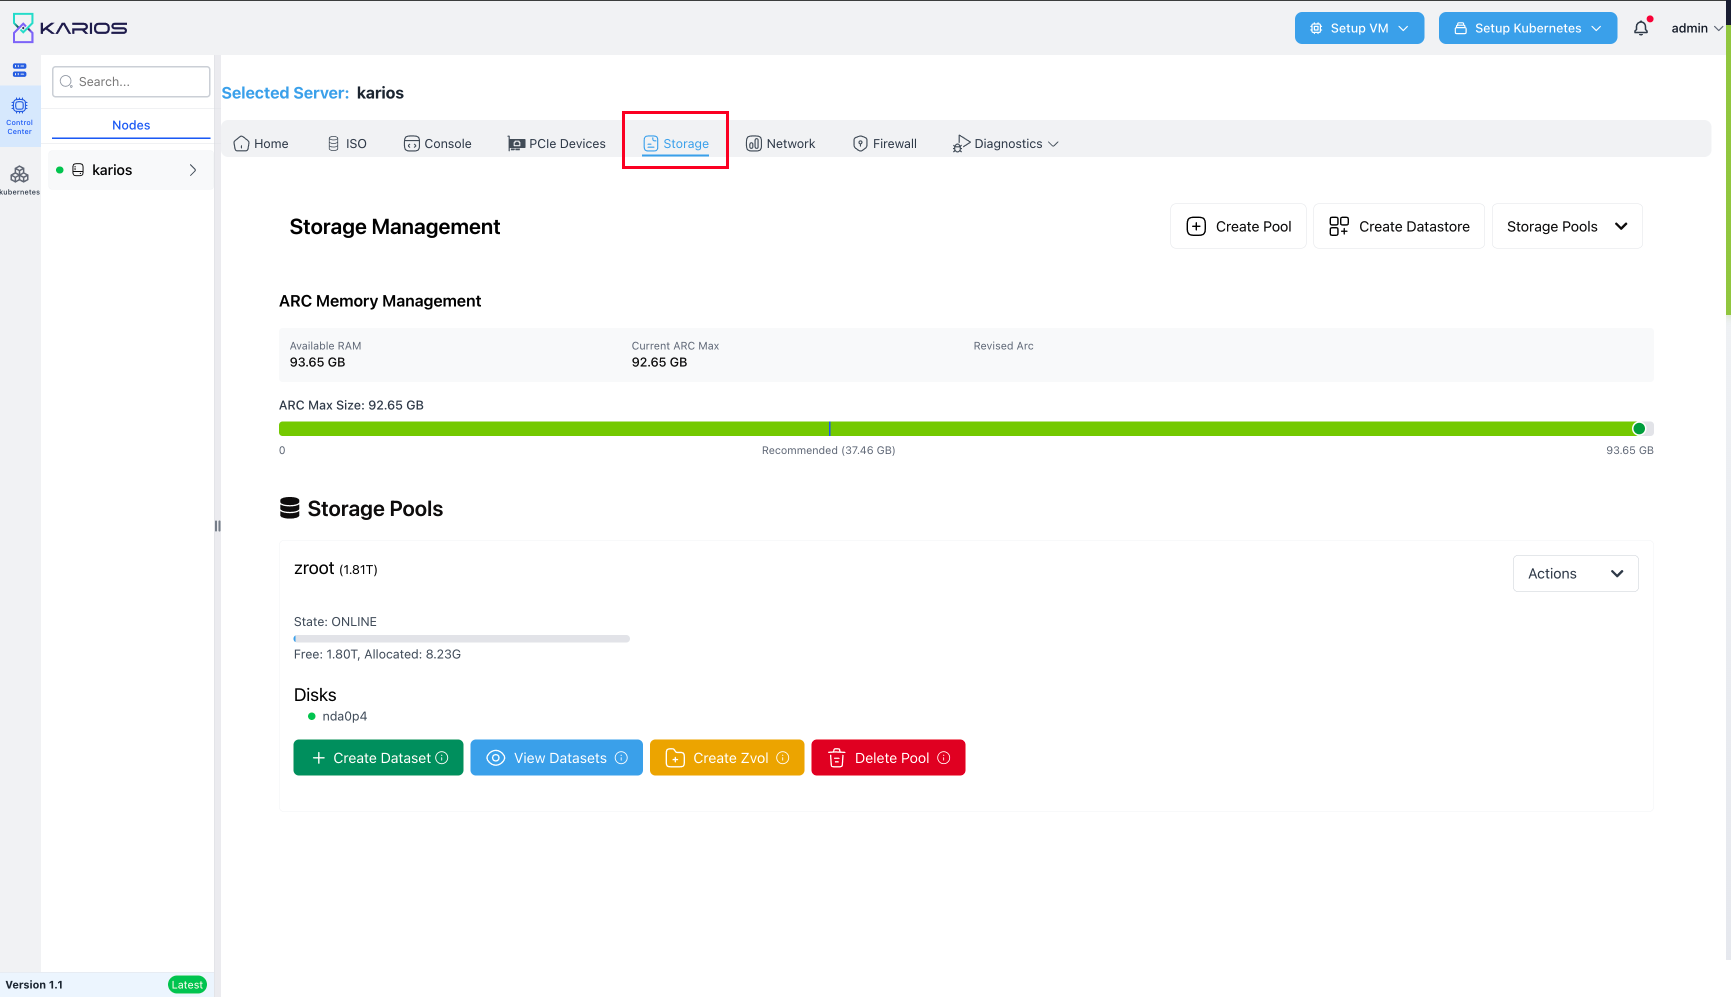
Node Storage Management
Storage Management Overview: The Storage tab provides comprehensive ZFS storage management capabilities at the node level, enabling administrators to create and manage storage pools, datasets, and volumes directly on individual servers.
ZFS (Zettabyte File System) A next-generation file system and logical volume manager originally developed by Sun Microsystems for Solaris, now widely used on FreeBSD and other operating systems. ZFS combines traditional file system functionality with volume management, providing data integrity, compression, deduplication, snapshots, and RAID-like functionality in a single integrated solution.
Storage Management Interface: The Storage Management interface offers three primary functions accessible through the top action bar:
Create Pool: Create new ZFS storage pools with configurable RAID levels
Create Datastore: Create new datastores for virtual machine storage
Storage Pools Dropdown: Select and manage existing storage pools
Tip
Pool (ZFS Pool/zpool) The top-level storage container in ZFS that consists of one or more virtual devices (vdevs) made up of physical storage devices. A pool aggregates storage capacity and provides the foundation for all ZFS file systems, volumes, and datasets. Pools can be expanded by adding more vdevs and provide redundancy through various RAID-like configurations.
Dataset A generic term in ZFS that refers to any of the following: file systems, volumes, clones, or snapshots. More commonly, it refers to a ZFS file system - a mountable unit of storage within a pool that can have its own properties, quotas, and snapshots. Datasets are hierarchical and can contain other datasets.
Storage Pool Management
ZFS Storage Pool Overview: The Storage Pools section displays comprehensive information about existing ZFS pools on the worker node:
Pool Information Display:
Pool Name: ZFS pool identifier (e.g., “zroot”)
Pool Size: Total pool capacity (e.g., “920G”)
Pool State: Current operational status (e.g., “ONLINE”)
Storage Utilization: Visual progress bar showing allocated vs. free space
Capacity Details: Specific capacity information (e.g., “Free: 848G, Allocated: 71.6G”)
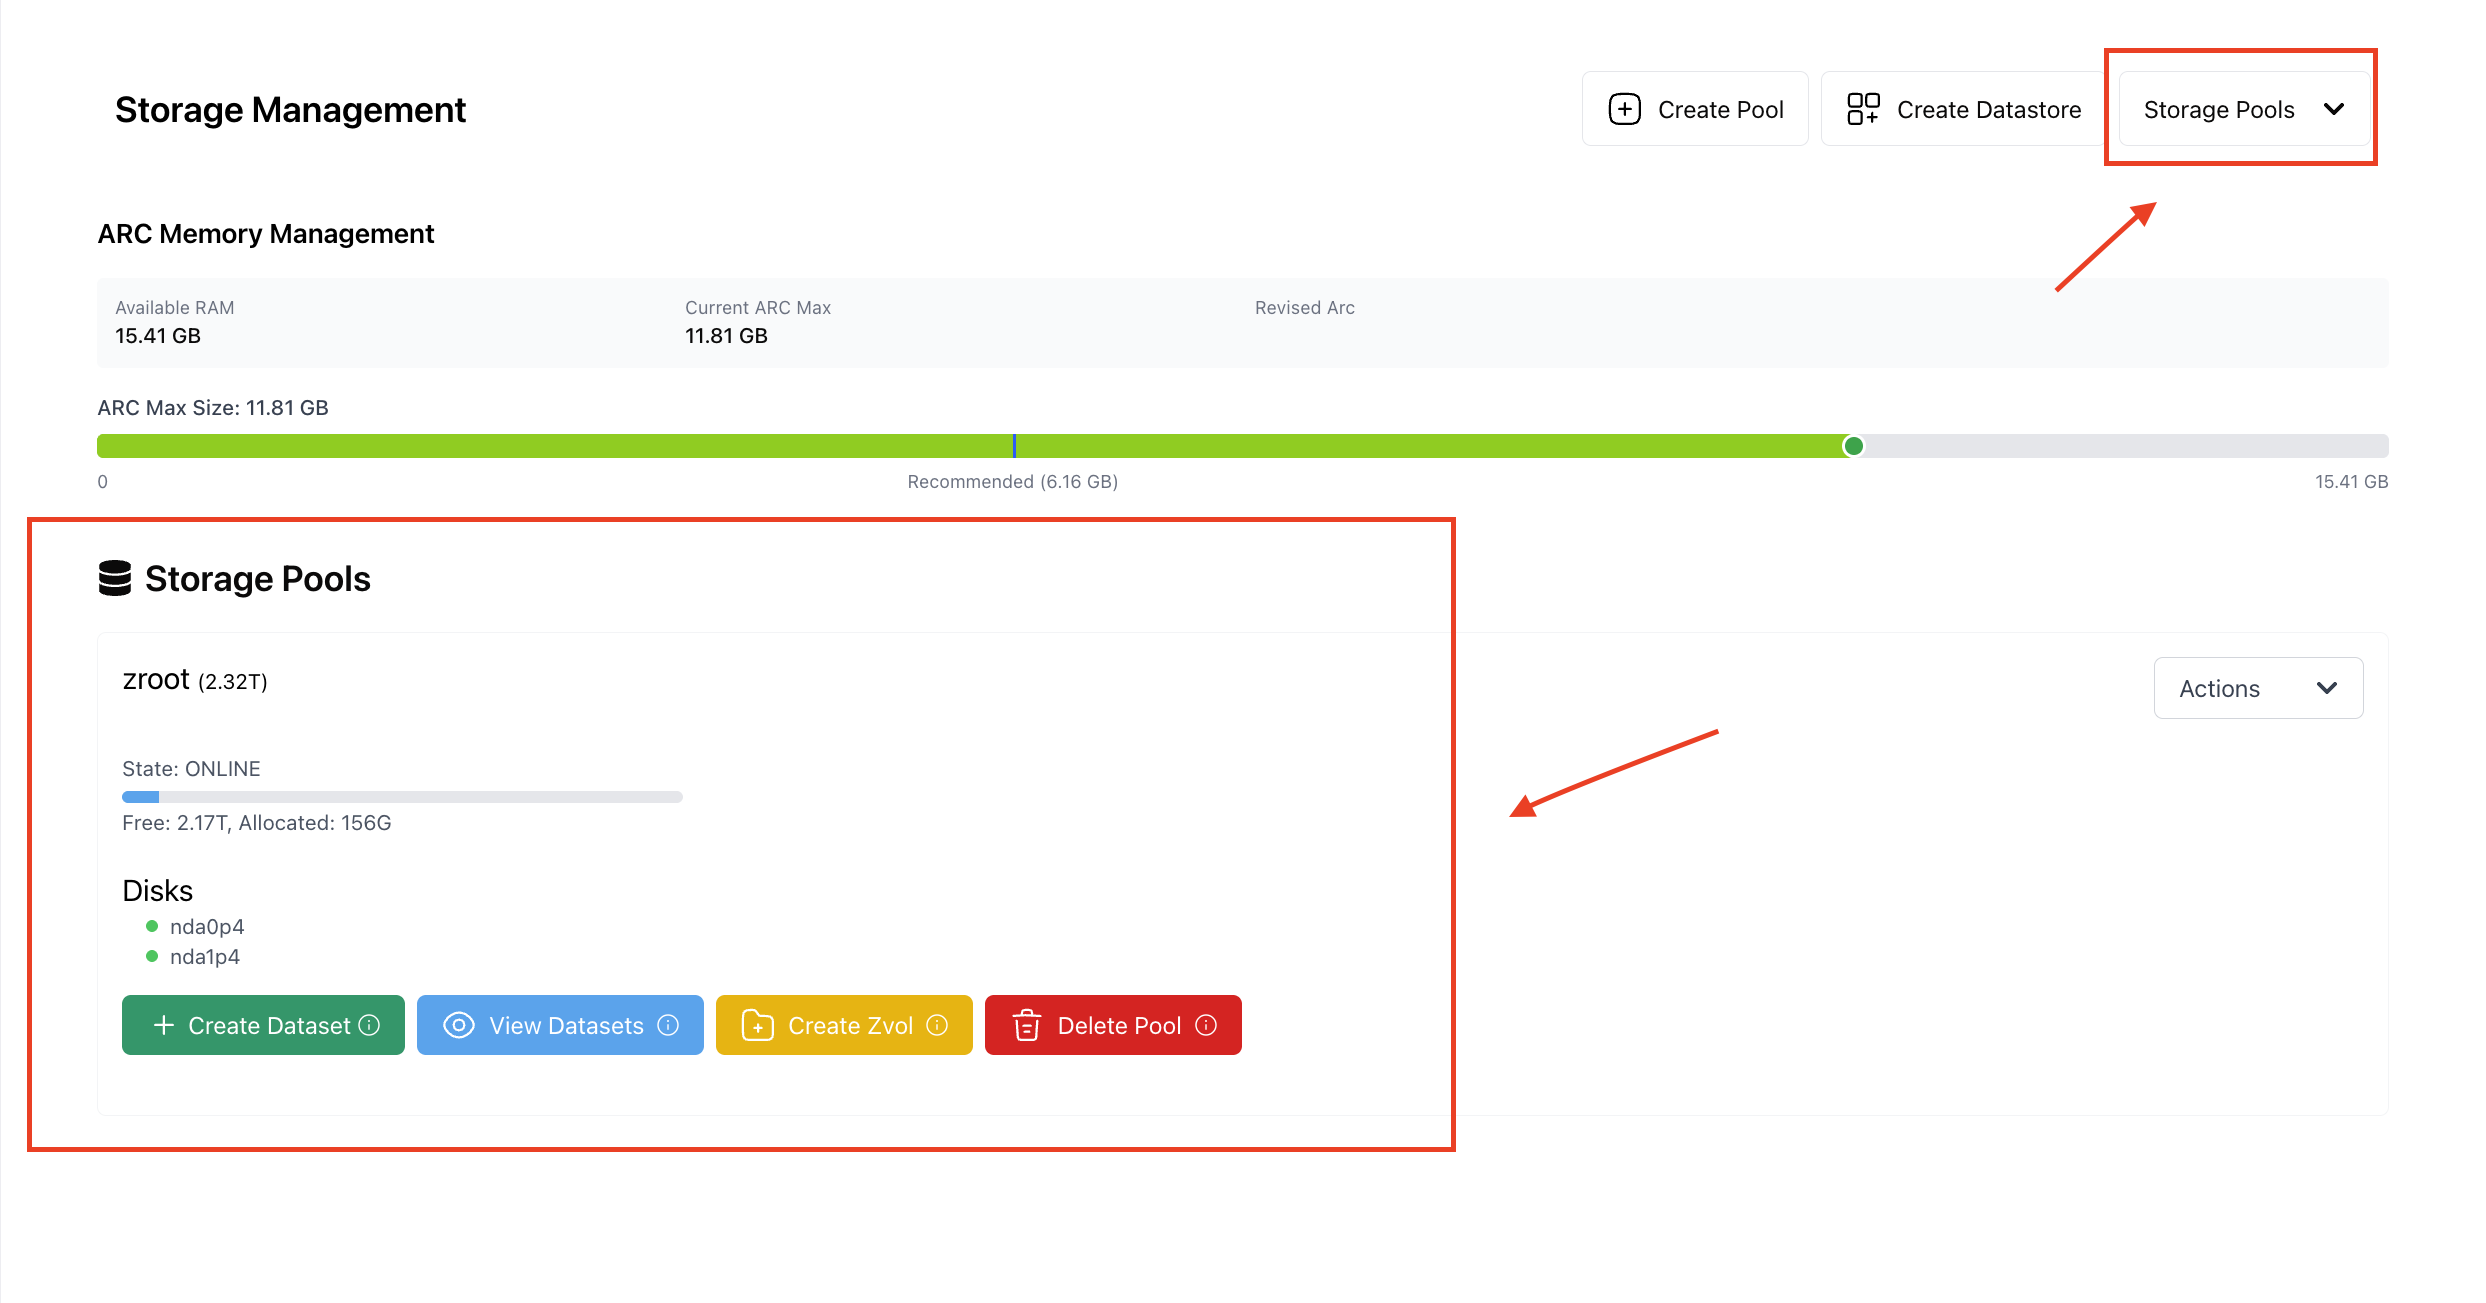
Pool Health Monitoring:
State Indicators: Real-time pool health status (ONLINE)
Capacity Monitoring: Visual and numerical capacity utilization tracking
ZFS ARC Memory Management
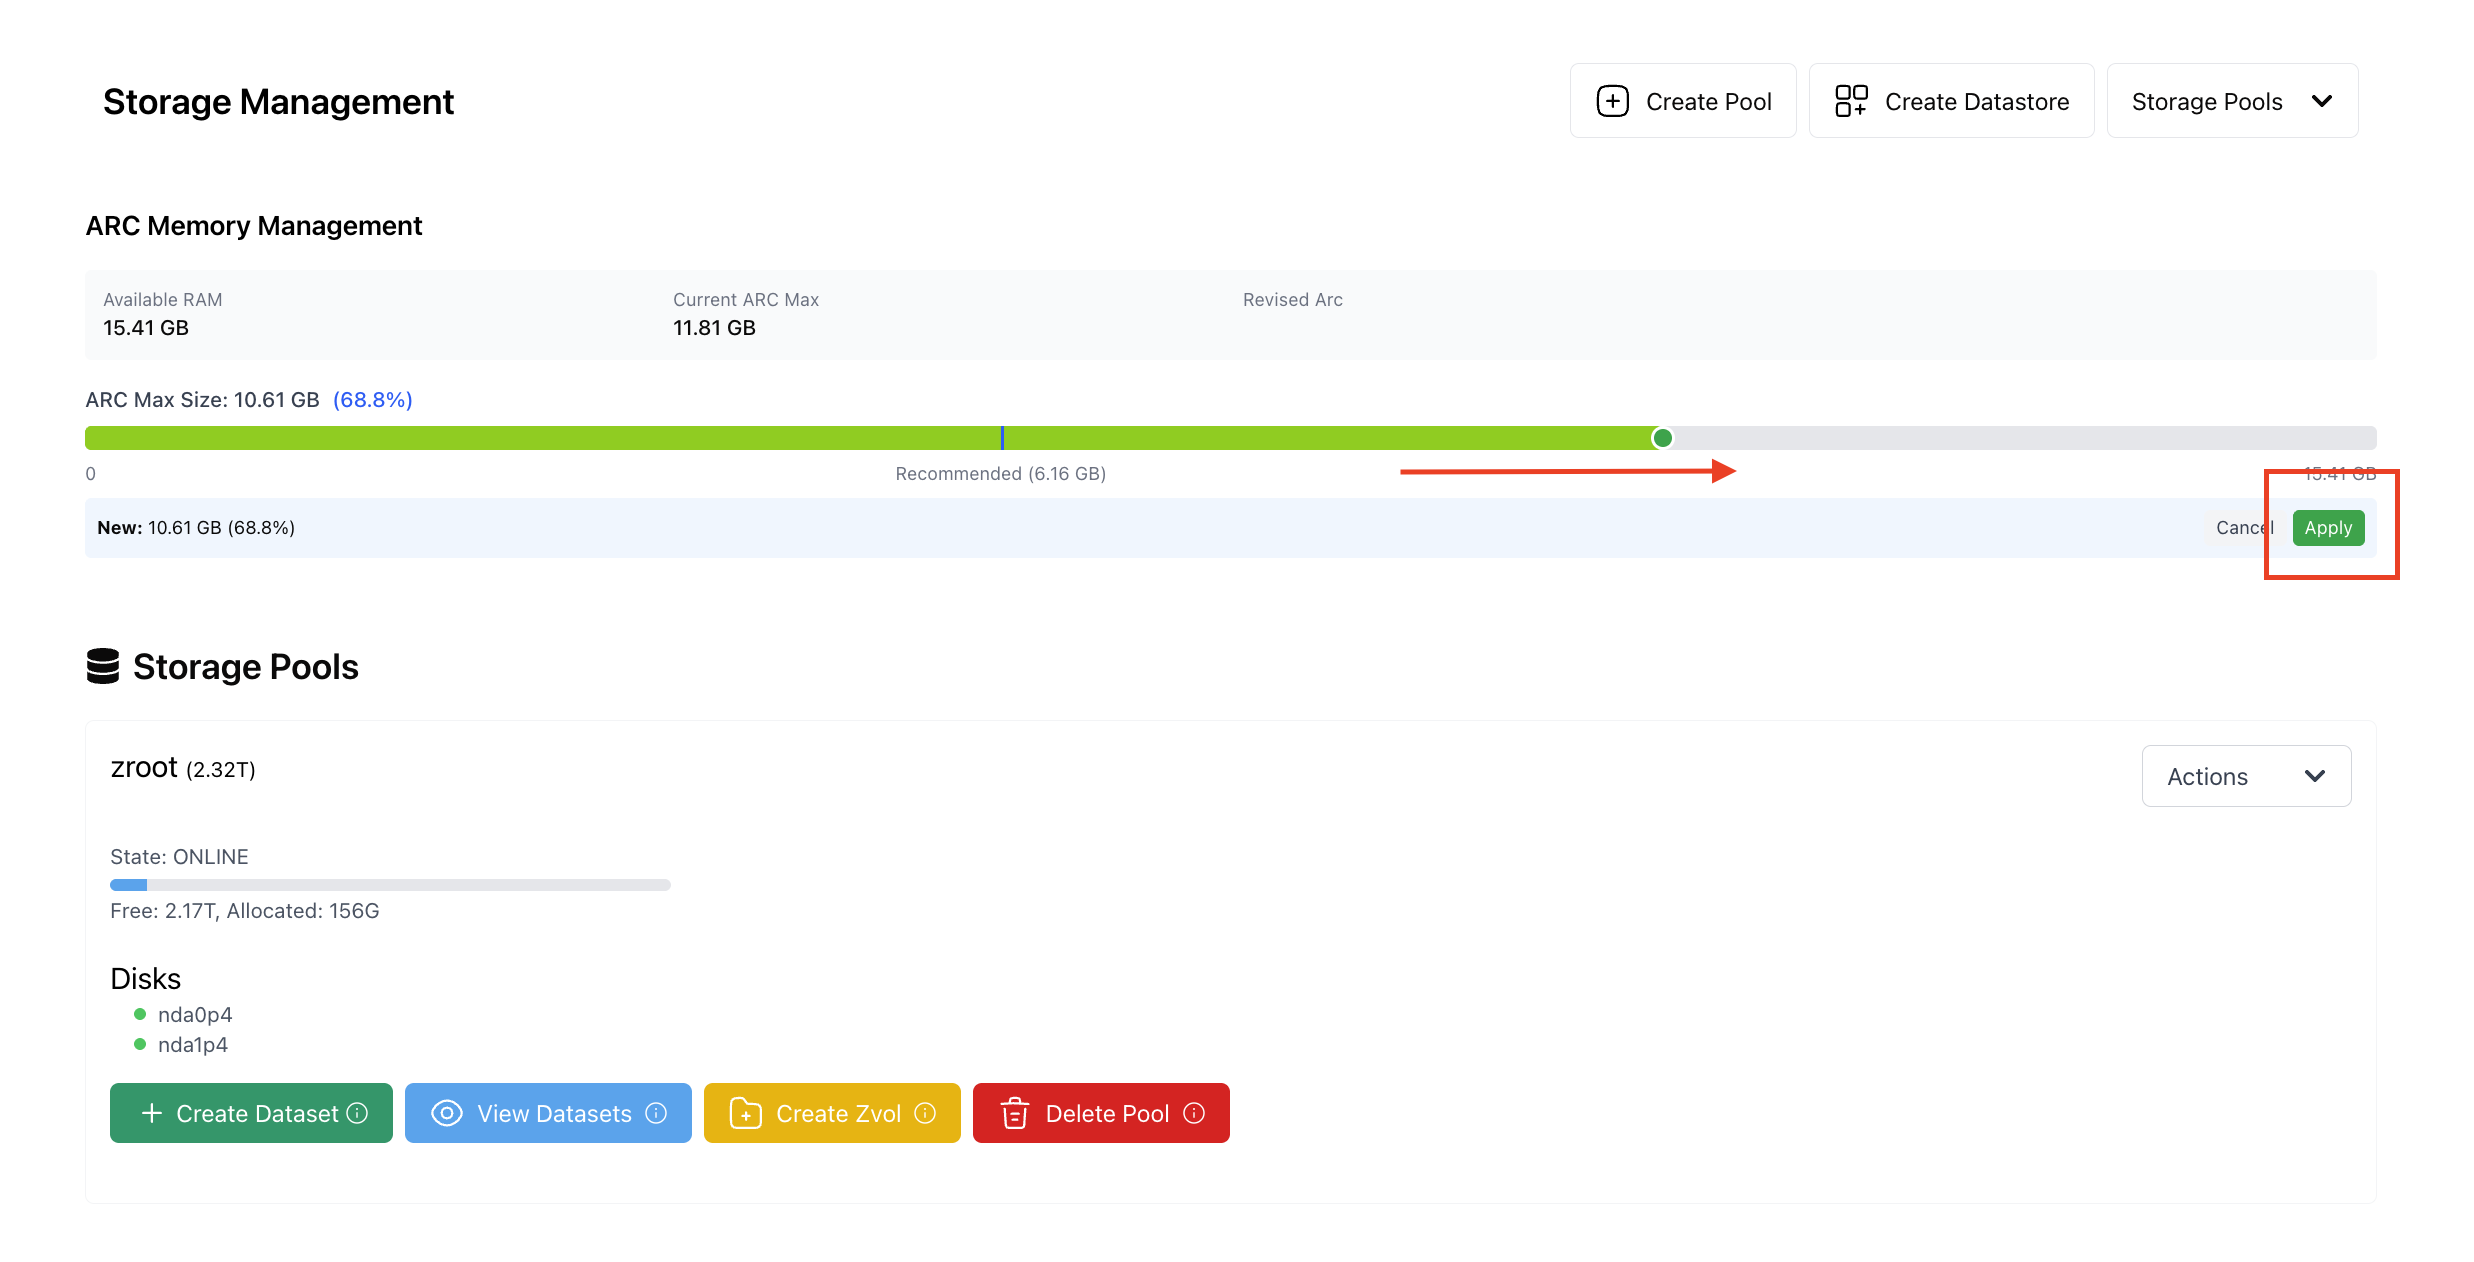
ARC (Adaptive Replacement Cache) is ZFS’s in-memory caching system. It keeps frequently accessed data and metadata in RAM, improving read performance and reducing disk I/O. The ARC Memory Management section shows: - Available: Free memory remaining on the node. - Current: The ARC size currently allocated. - Recommended: A suggested ARC allocation, based on system resources.
Adjust ARC Memory:
- Modify the Current value to the desired cache size.
You can increase it for more aggressive caching.
Or decrease it to free RAM for virtual machines and other workloads.
To save the settings, click “apply” . Changes apply dynamically
Impact of Adjustments
Increasing ARC
Pros: Higher cache hit rates, improved read performance, reduced latency on repeated operations.
Cons: Less memory left for VMs or applications; risk of memory pressure if set too high.
Decreasing ARC
Pros: Frees RAM for VMs and services, preventing out-of-memory scenarios.
Cons: Lower cache hit rates, more disk access, possible performance dips for repeated reads.
Disk Management
Physical Disk Information: The Disks section provides detailed information about physical storage devices within the pool:
Disk Status Display:
Disk Identifier: Physical disk designation (e.g., “nda1p3”)
Disk State: Current operational status (e.g., “ONLINE”)
Disk Performance: Read, write, and checksum statistics
Disk Health Monitoring:
Performance Tracking: Monitor disk I/O performance and statistics
Error Detection: Track and report disk errors and failures
Health Status: Visual indicators for disk health and reliability
Predictive Maintenance: Early warning indicators for disk replacement
Storage Pool Operations
Pool Management Actions: The Storage Pool interface provides four primary operational buttons:
Purpose
Create a new ZFS dataset within an existing storage pool for file storage and organization.
Functionality
Datasets allow you to create structured storage areas inside a pool. They can be managed independently with properties such as quotas, compression, and optional encryption.
Organization
Datasets are organized hierarchically (like directories) under the pool name.
for example: zroot/mydataset
Usage
Ideal for organizing file-based storage into logical, isolated datasets.
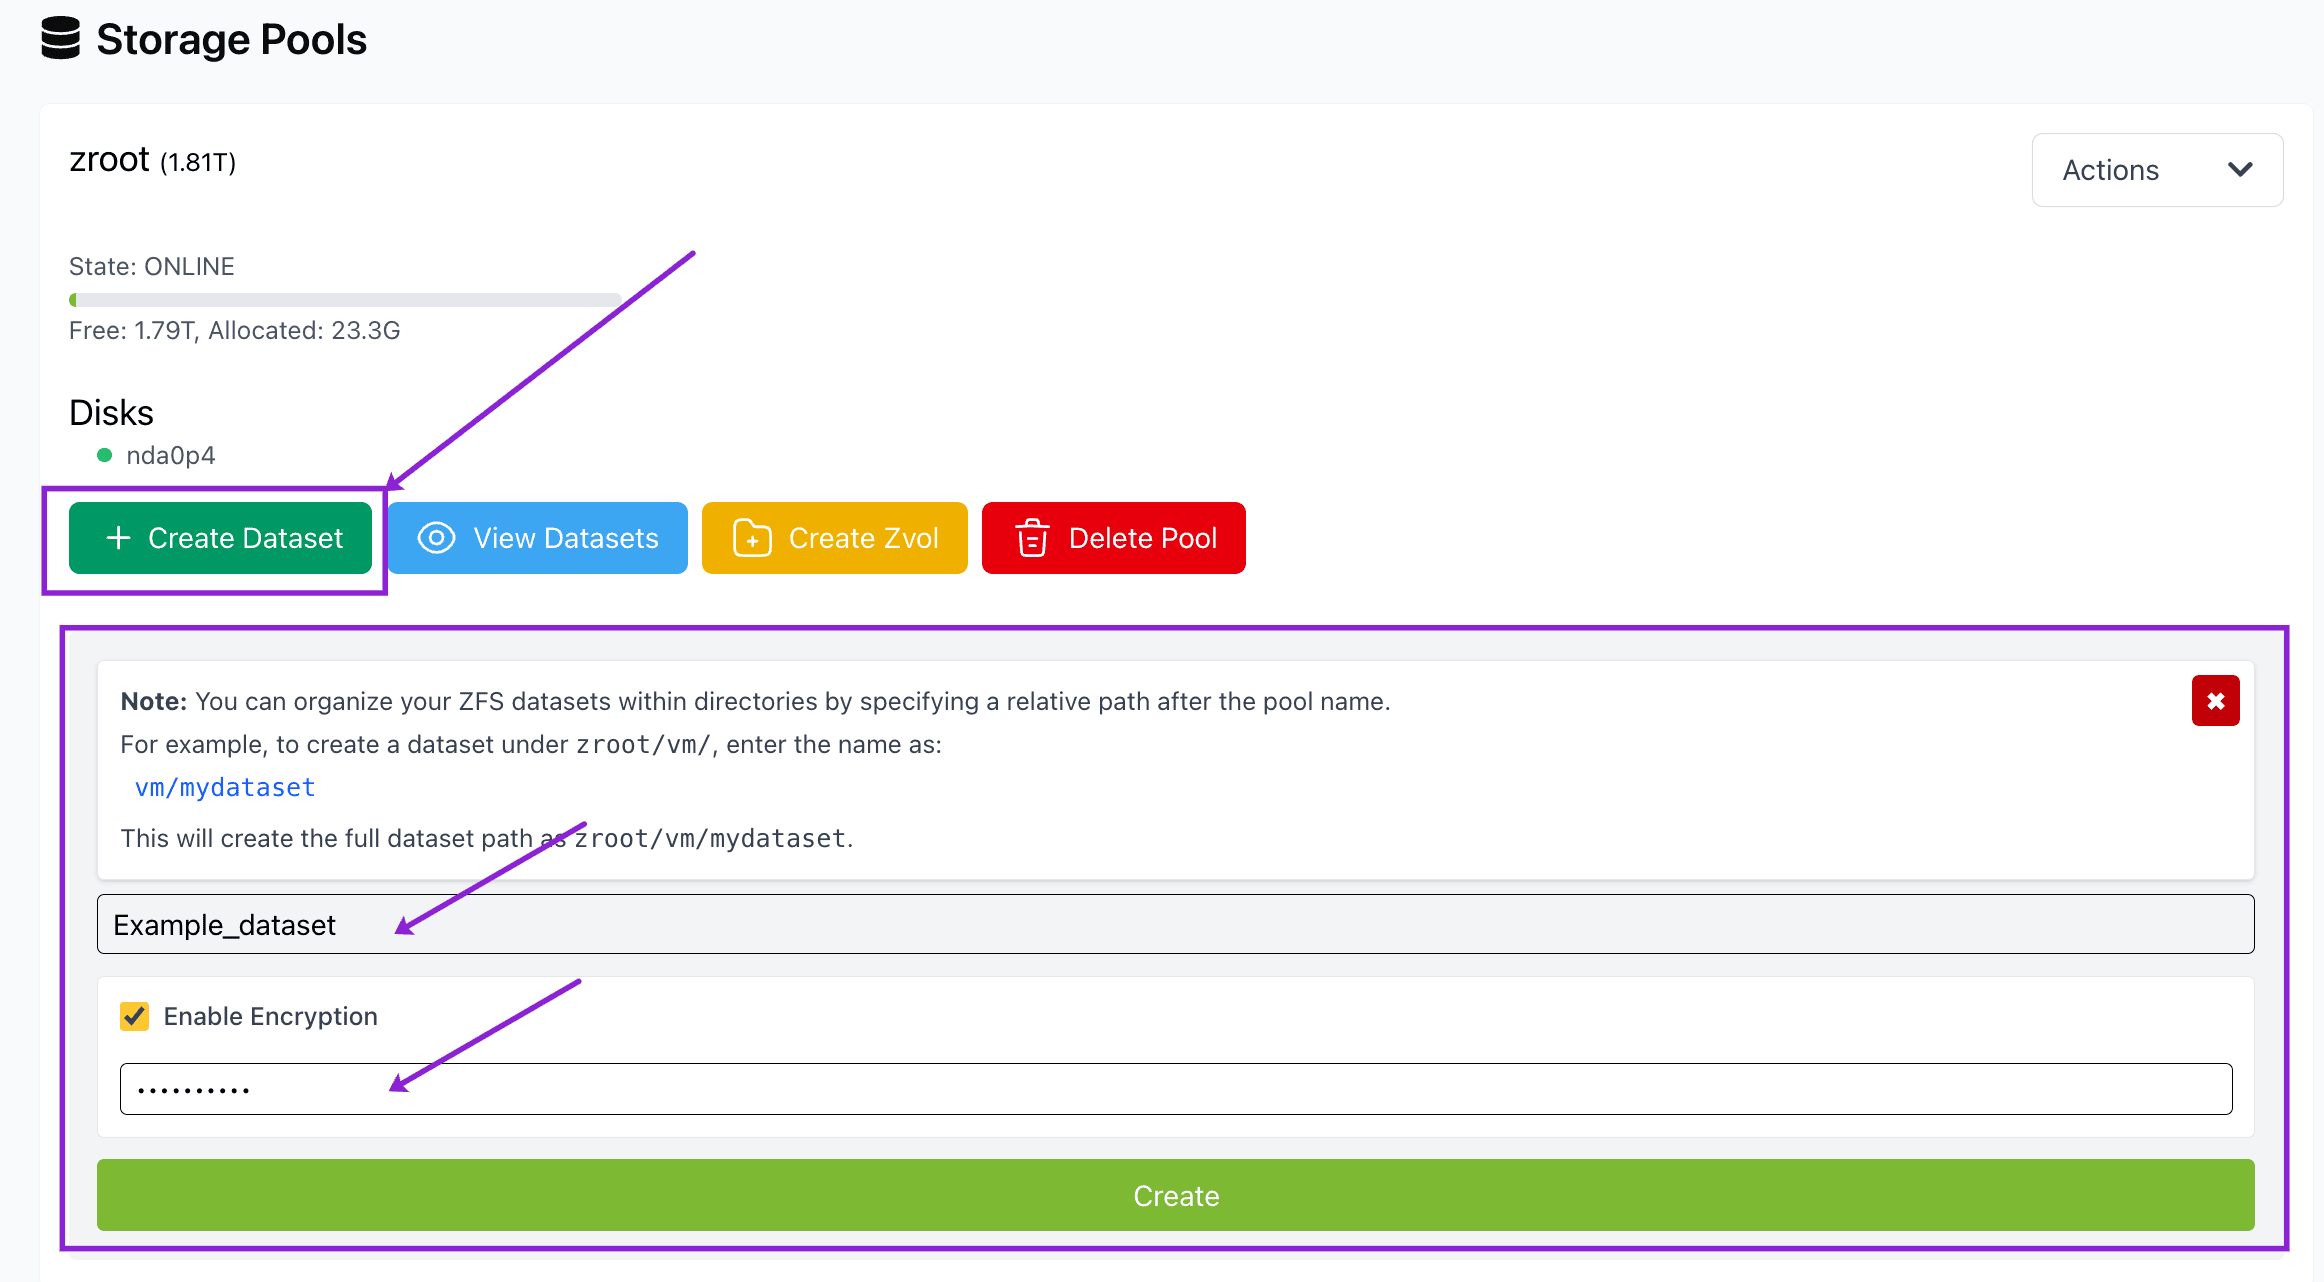
Steps to create a dataset:
Step 1: Please click on “Create dataset” on any of the available pools (e.g., zroot)
Step 2: Please provide an appropriate dataset name(e.g., dataset-1)
Step 3: Enable encryption if required and provide a passphrase (min 8 characters)
Step 4: Click “Create”
Tip
ZFS Encryption Provides data-at-rest protection by encrypting datasets at the storage level, ensuring that sensitive data remains unreadable even if physical drives are compromised, stolen, or improperly disposed of. This native encryption feature supports regulatory compliance requirements (HIPAA, PCI-DSS, GDPR) while maintaining high performance through hardware acceleration and granular control over different datasets.
View Datasets:
Purpose: Display and manage existing datasets within the pool
Functionality: Comprehensive dataset viewing and management
Dataset Information: Usage statistics, compression settings, and configurations
Filter Options: Filter datasets by type (All Types, Filesystem, Volume, Snapshot
Click on “View datasets” to display and manage your datasets within the pool.
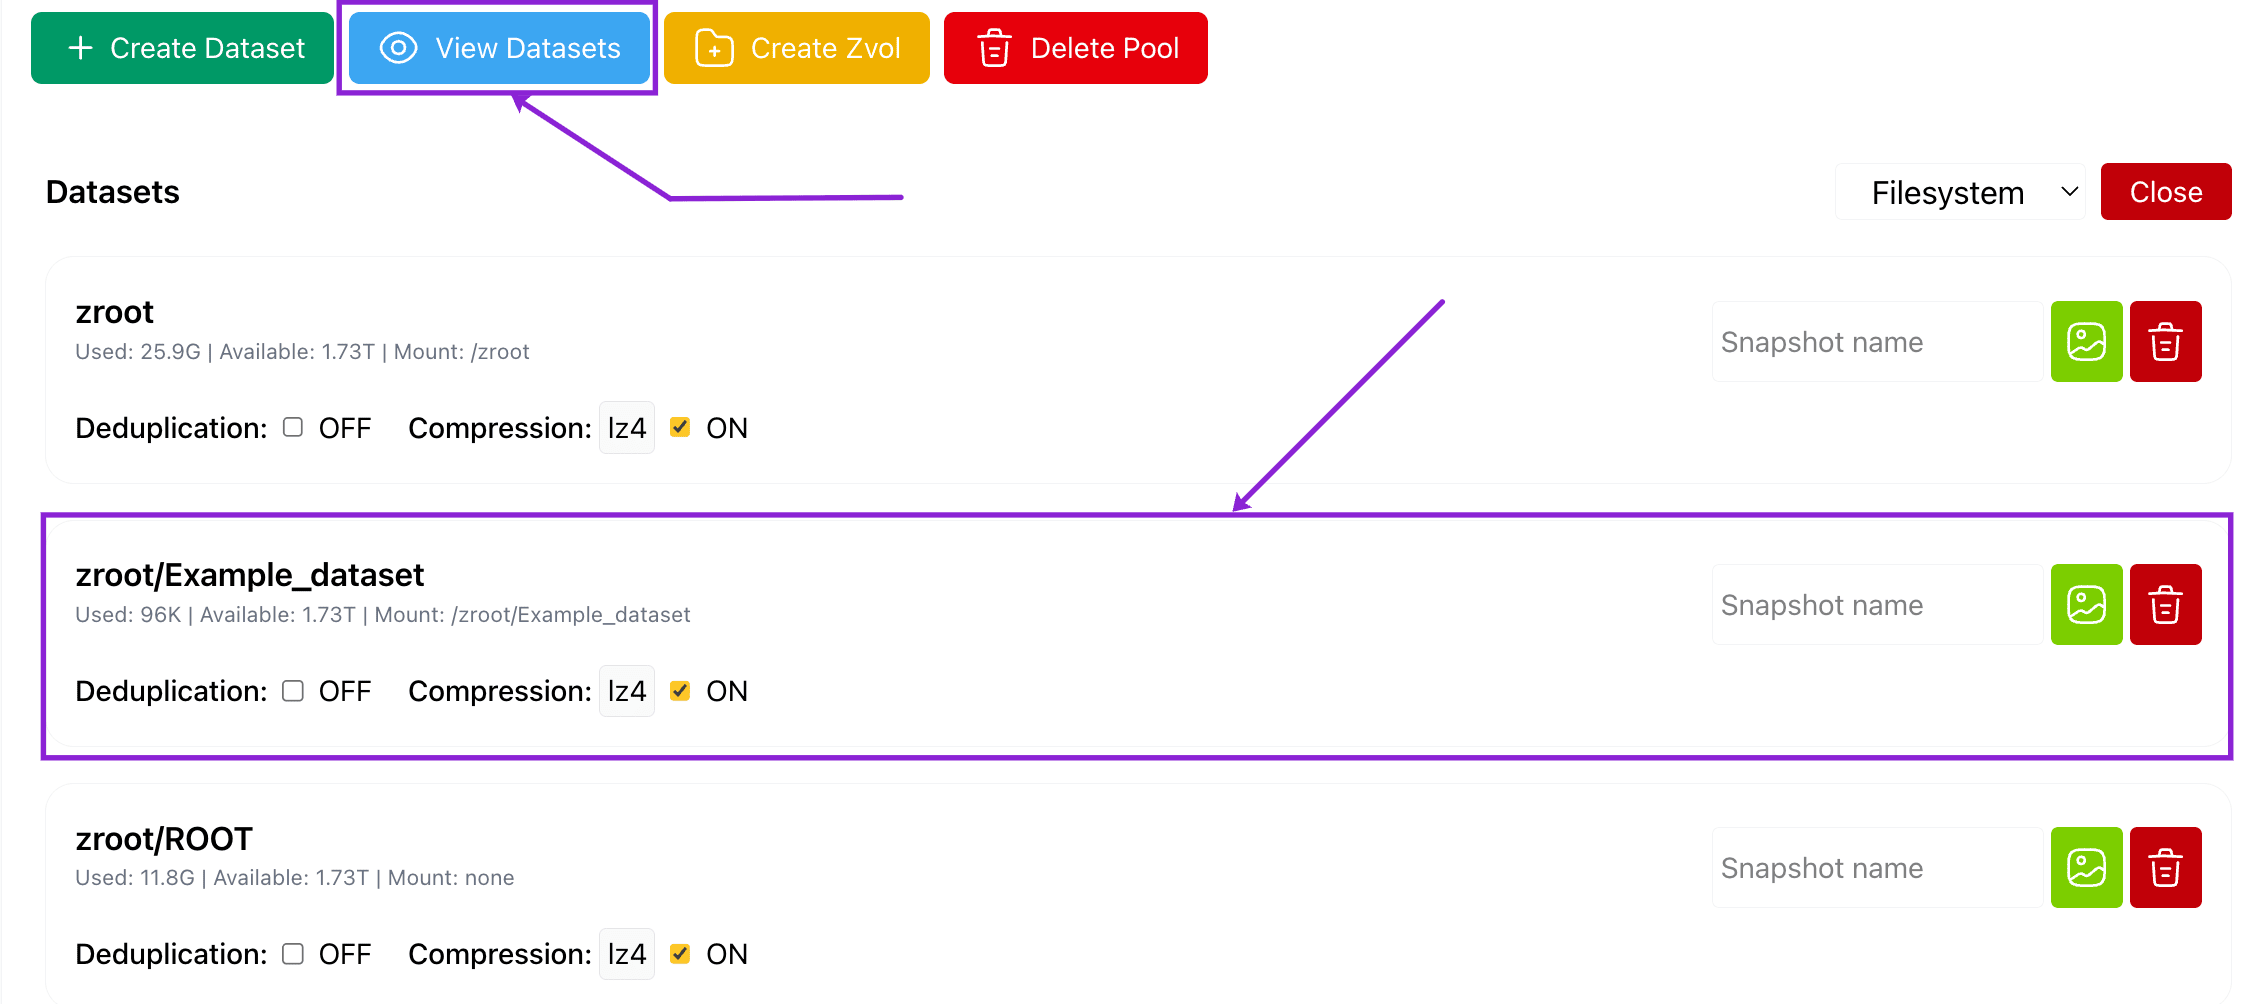
Create Zvol:
Purpose: Create ZFS volumes for block storage
Tip
Block Level Storage Refers to a data storage method where data is stored and accessed in fixed-size blocks (typically 512 bytes to several KB), with each block having a unique address that the operating system can directly access.
Functionality: Block-level storage for virtual machines and applications
Configuration: Specify volume name and size with unit selection (GB, TB)
Usage: Ideal for virtual machine storage and database applications
Provide an appropriate name for the zvol and select “Create Zvol”
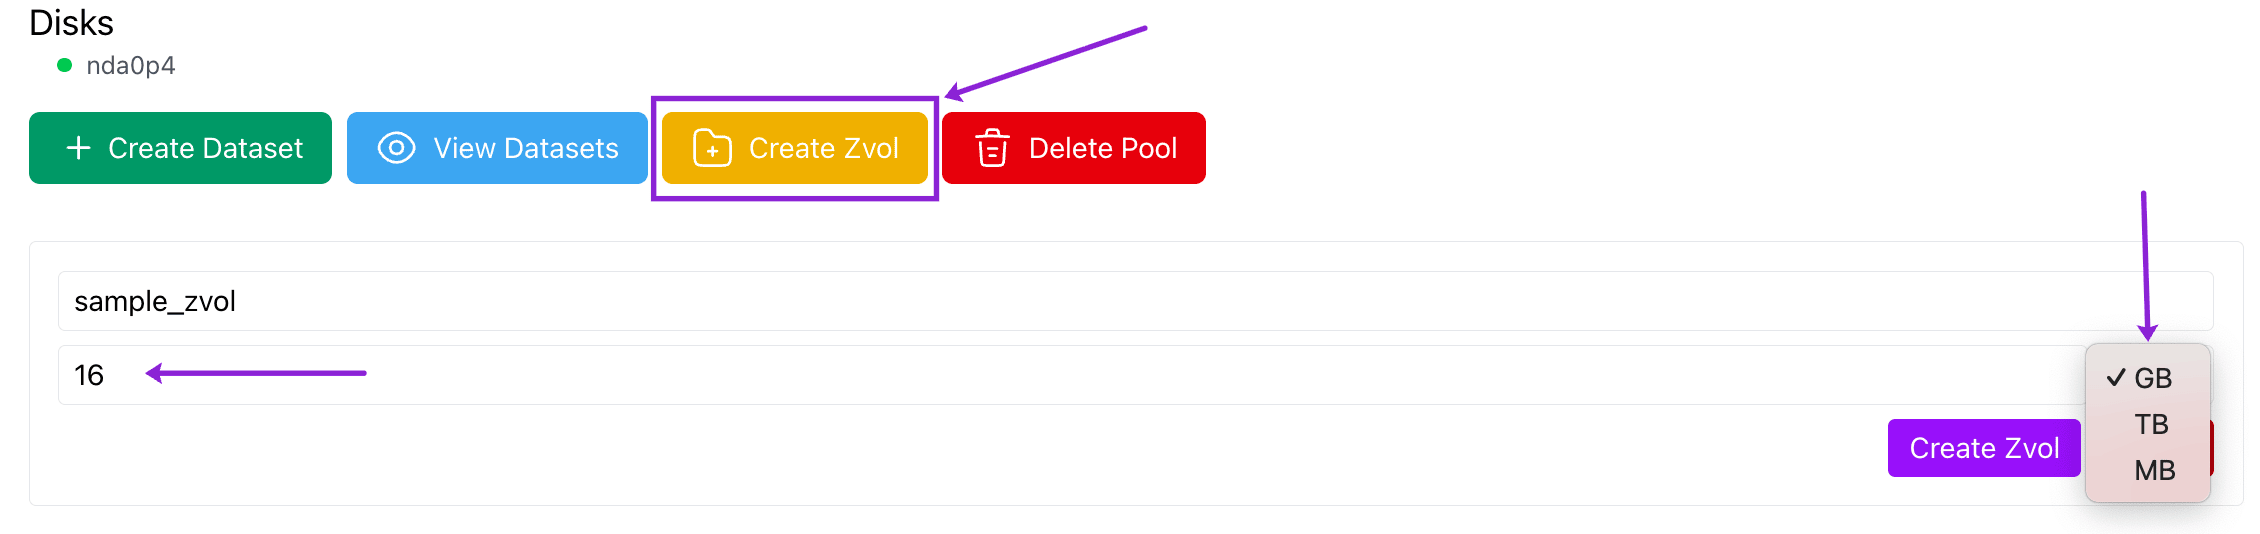
Delete Pool:
Purpose: Remove storage pools from the system
Functionality: Complete pool deletion with data removal
Safety: Confirmation required before permanent deletion
Impact: Permanent removal of all pool data and configurations
Please navigate to the appropriate pool and select “Delete Pool”
Warning: Performing this action will delete all the datasets, volumes, snapshots and it cannot reversed.
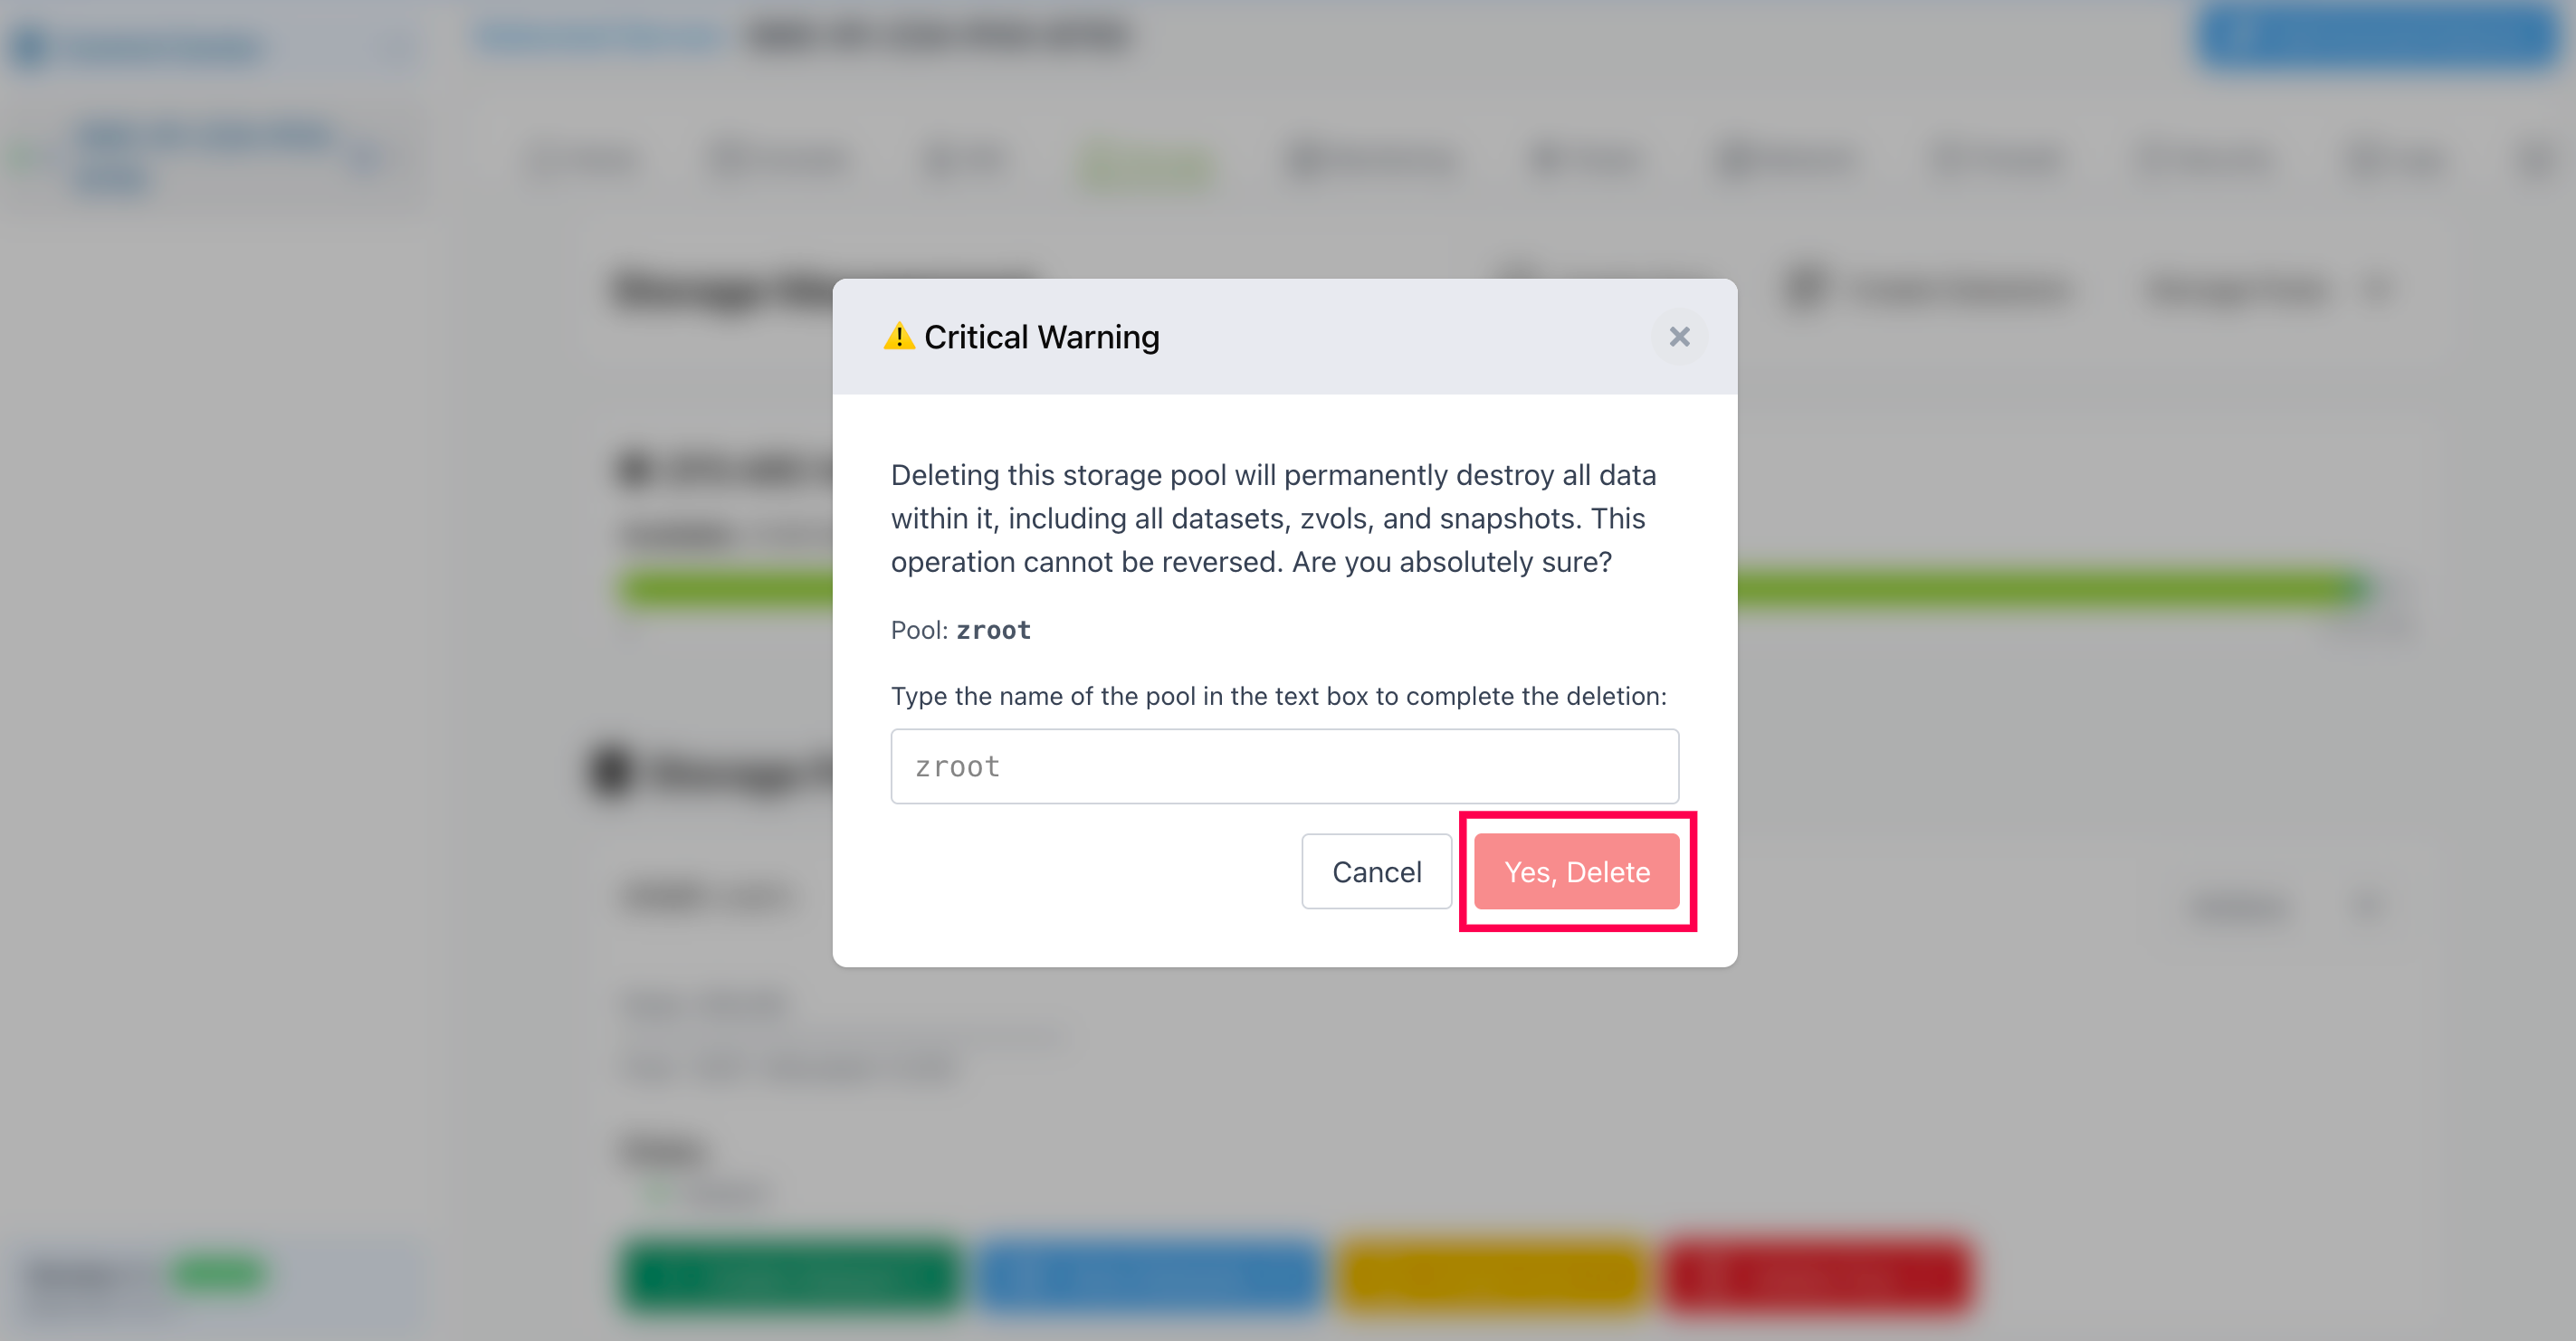
ZFS Pool Creation
Create ZPool Interface: The Create ZPool dialog provides comprehensive options for creating new ZFS storage pools:
Pool Configuration Options:
Pool Name: Specify unique pool identifier
RAID Type Selection: Choose from multiple RAID configurations: - raidz1: Single parity RAID-Z (similar to RAID 5) - raidz2: Double parity RAID-Z (similar to RAID 6) - raidz3: Triple parity RAID-Z (maximum fault tolerance) - mirror: Mirrored configuration (similar to RAID 1) - striped: Striped configuration (similar to RAID 0)
Disk Selection:
Available Disks: Display of available physical disks for pool creation
Disk Status: Real-time availability status of storage devices
Disk Validation: Verification of disk suitability for pool creation
No Disks Available: Clear indication when no disks are available for pool creation
Steps to create a zpool:
Step 1: Provide an appropriate pool name
Step 2: Select the desired RAID type and available disks based on the RAID type.
Step 3: Click “Create ZPool” to provision the ZFS pool.
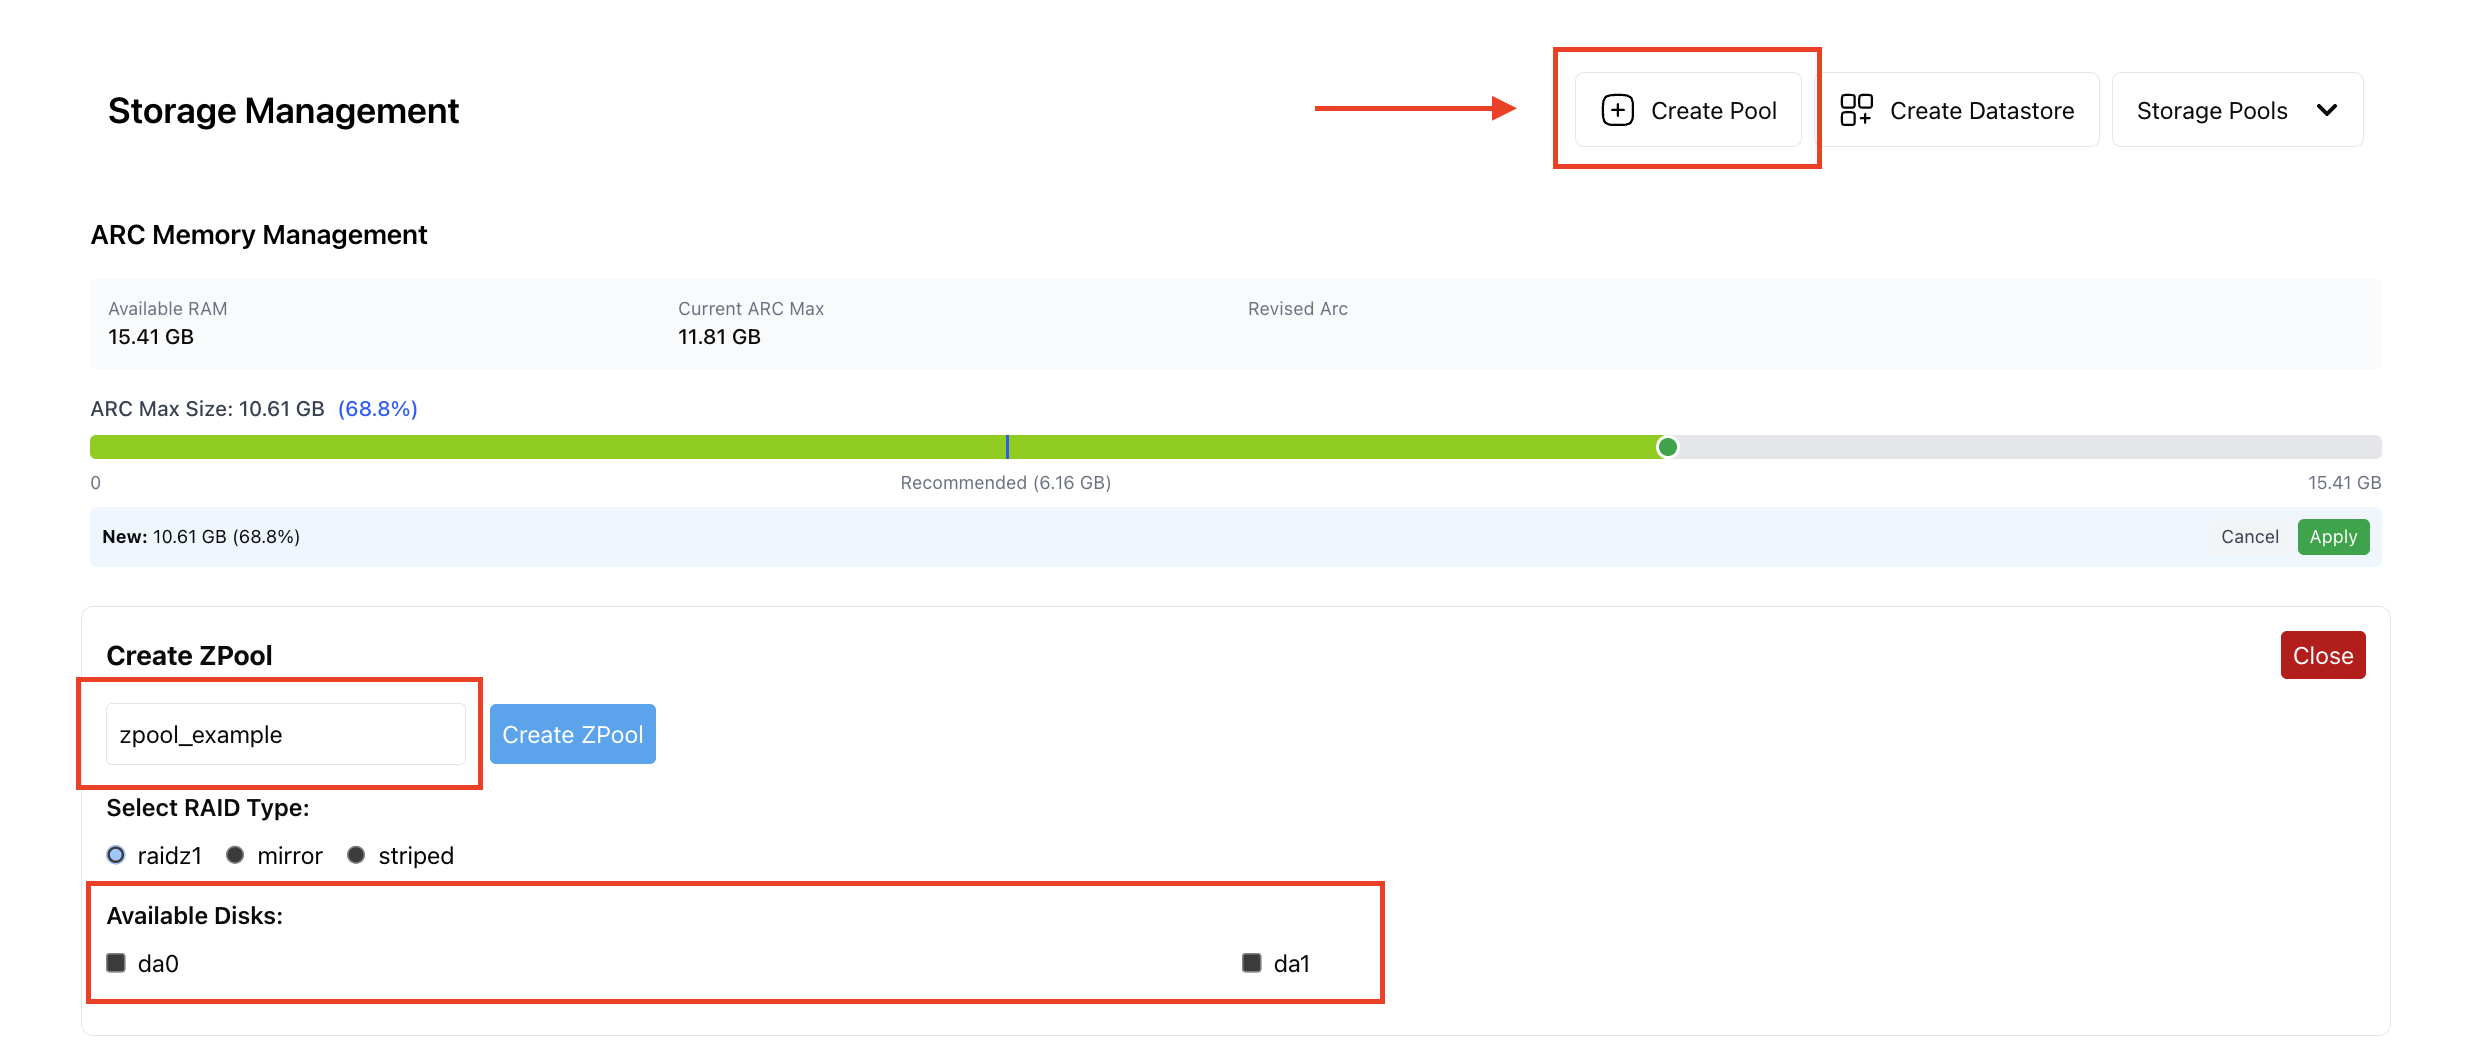
Tip
RAID-Z Levels
RAID-Z1 A ZFS implementation similar to RAID-5, using single-parity protection across multiple drives (minimum 3 drives). Can tolerate the failure of one drive while maintaining data integrity, providing a balance between storage capacity and redundancy.
RAID-Z2 A ZFS implementation similar to RAID-6, using double-parity protection across multiple drives (minimum 4 drives). Can tolerate the failure of up to two drives simultaneously, offering higher redundancy than RAID-Z1 at the cost of additional storage overhead.
RAID-Z3 A ZFS implementation using triple-parity protection across multiple drives (minimum 5 drives). Can tolerate the failure of up to three drives simultaneously, providing the highest level of redundancy in the RAID-Z family, ideal for large storage arrays where maximum data protection is critical.
Mirror A ZFS configuration similar to RAID-1, where data is duplicated across two or more drives. Provides excellent read performance and can tolerate the failure of all but one drive in the mirror group, offering the fastest rebuild times but using 50% or more of available storage capacity for redundancy.
Striped A ZFS configuration similar to RAID-0, where data is distributed across multiple drives without any redundancy. Provides maximum storage capacity and improved performance through parallel I/O operations, but offers no fault tolerance - the failure of any single drive results in complete data loss.
Datastore Management
Create Datastore Interface: The Create Datastore dialog enables creation of datastores for virtual machine storage:
Tip
Datastore
A logical storage container that abstracts and manages underlying physical storage resources (hard drives, SSDs, storage arrays) into a unified pool of storage capacity.
Datastore Configuration:
Datastore Name: Specify unique datastore identifier
Tip
Datastore name - Logical identifiers assigned to datastores for easy identification and management within storage systems.
Pool Selection: Choose from available ZFS pools (e.g., “zroot”)
Storage Integration: Integration with existing storage pools
VM Storage: Optimized for virtual machine storage requirements
Datastore Benefits:
VM Integration: Seamless integration with virtual machine storage
Performance: Optimized for virtualization workloads
Management: Simplified virtual machine storage management
Flexibility: Easy expansion and modification of storage allocation
Steps to create a datastore:
Step 1: Provide an appropriate name
Step 2: Select the pool from the available list
Step 3: click “Create Datastore”
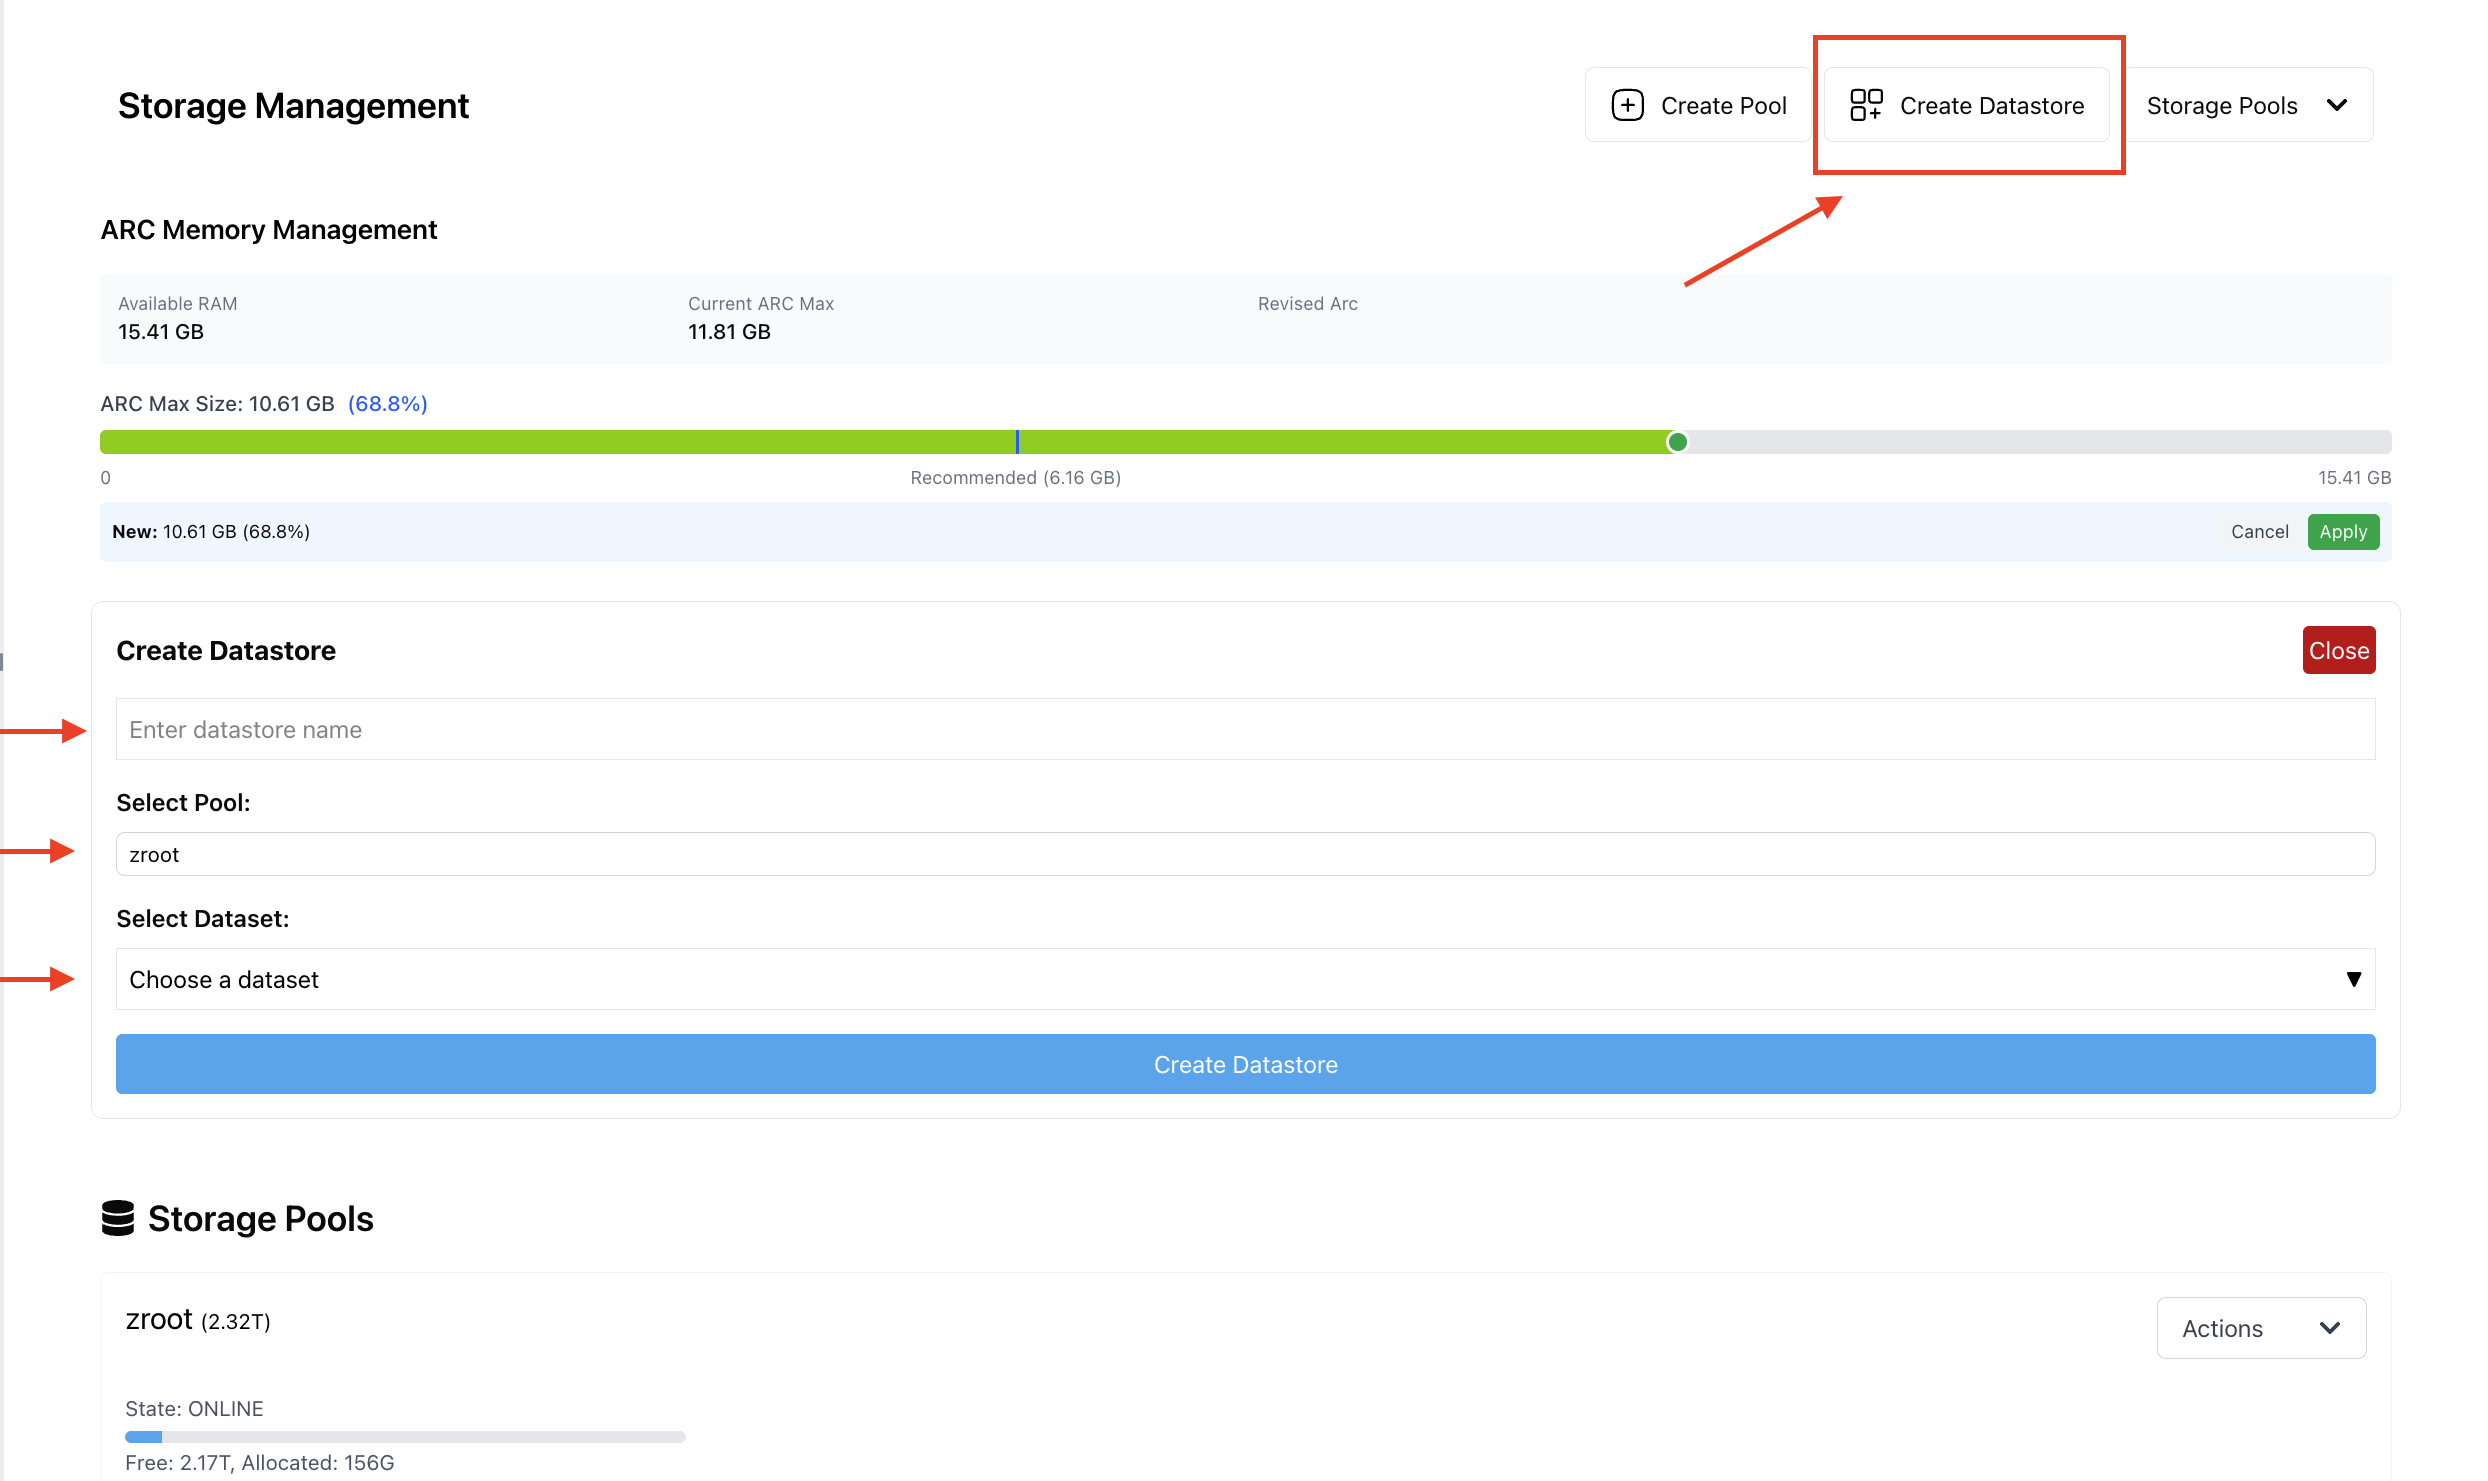
Dataset Management
Dataset Overview: The View Datasets interface provides comprehensive dataset management capabilities:
Dataset Information Display:
Dataset Name: Hierarchical dataset naming (e.g., “zroot”, “zroot/Load-test-1-disk-1”)
Usage Statistics: Detailed usage information (Used, Available, Mount point)
Compression Settings: ZFS compression configuration (lz4 ON/OFF)
Deduplication Settings: Data deduplication configuration (ON/OFF)
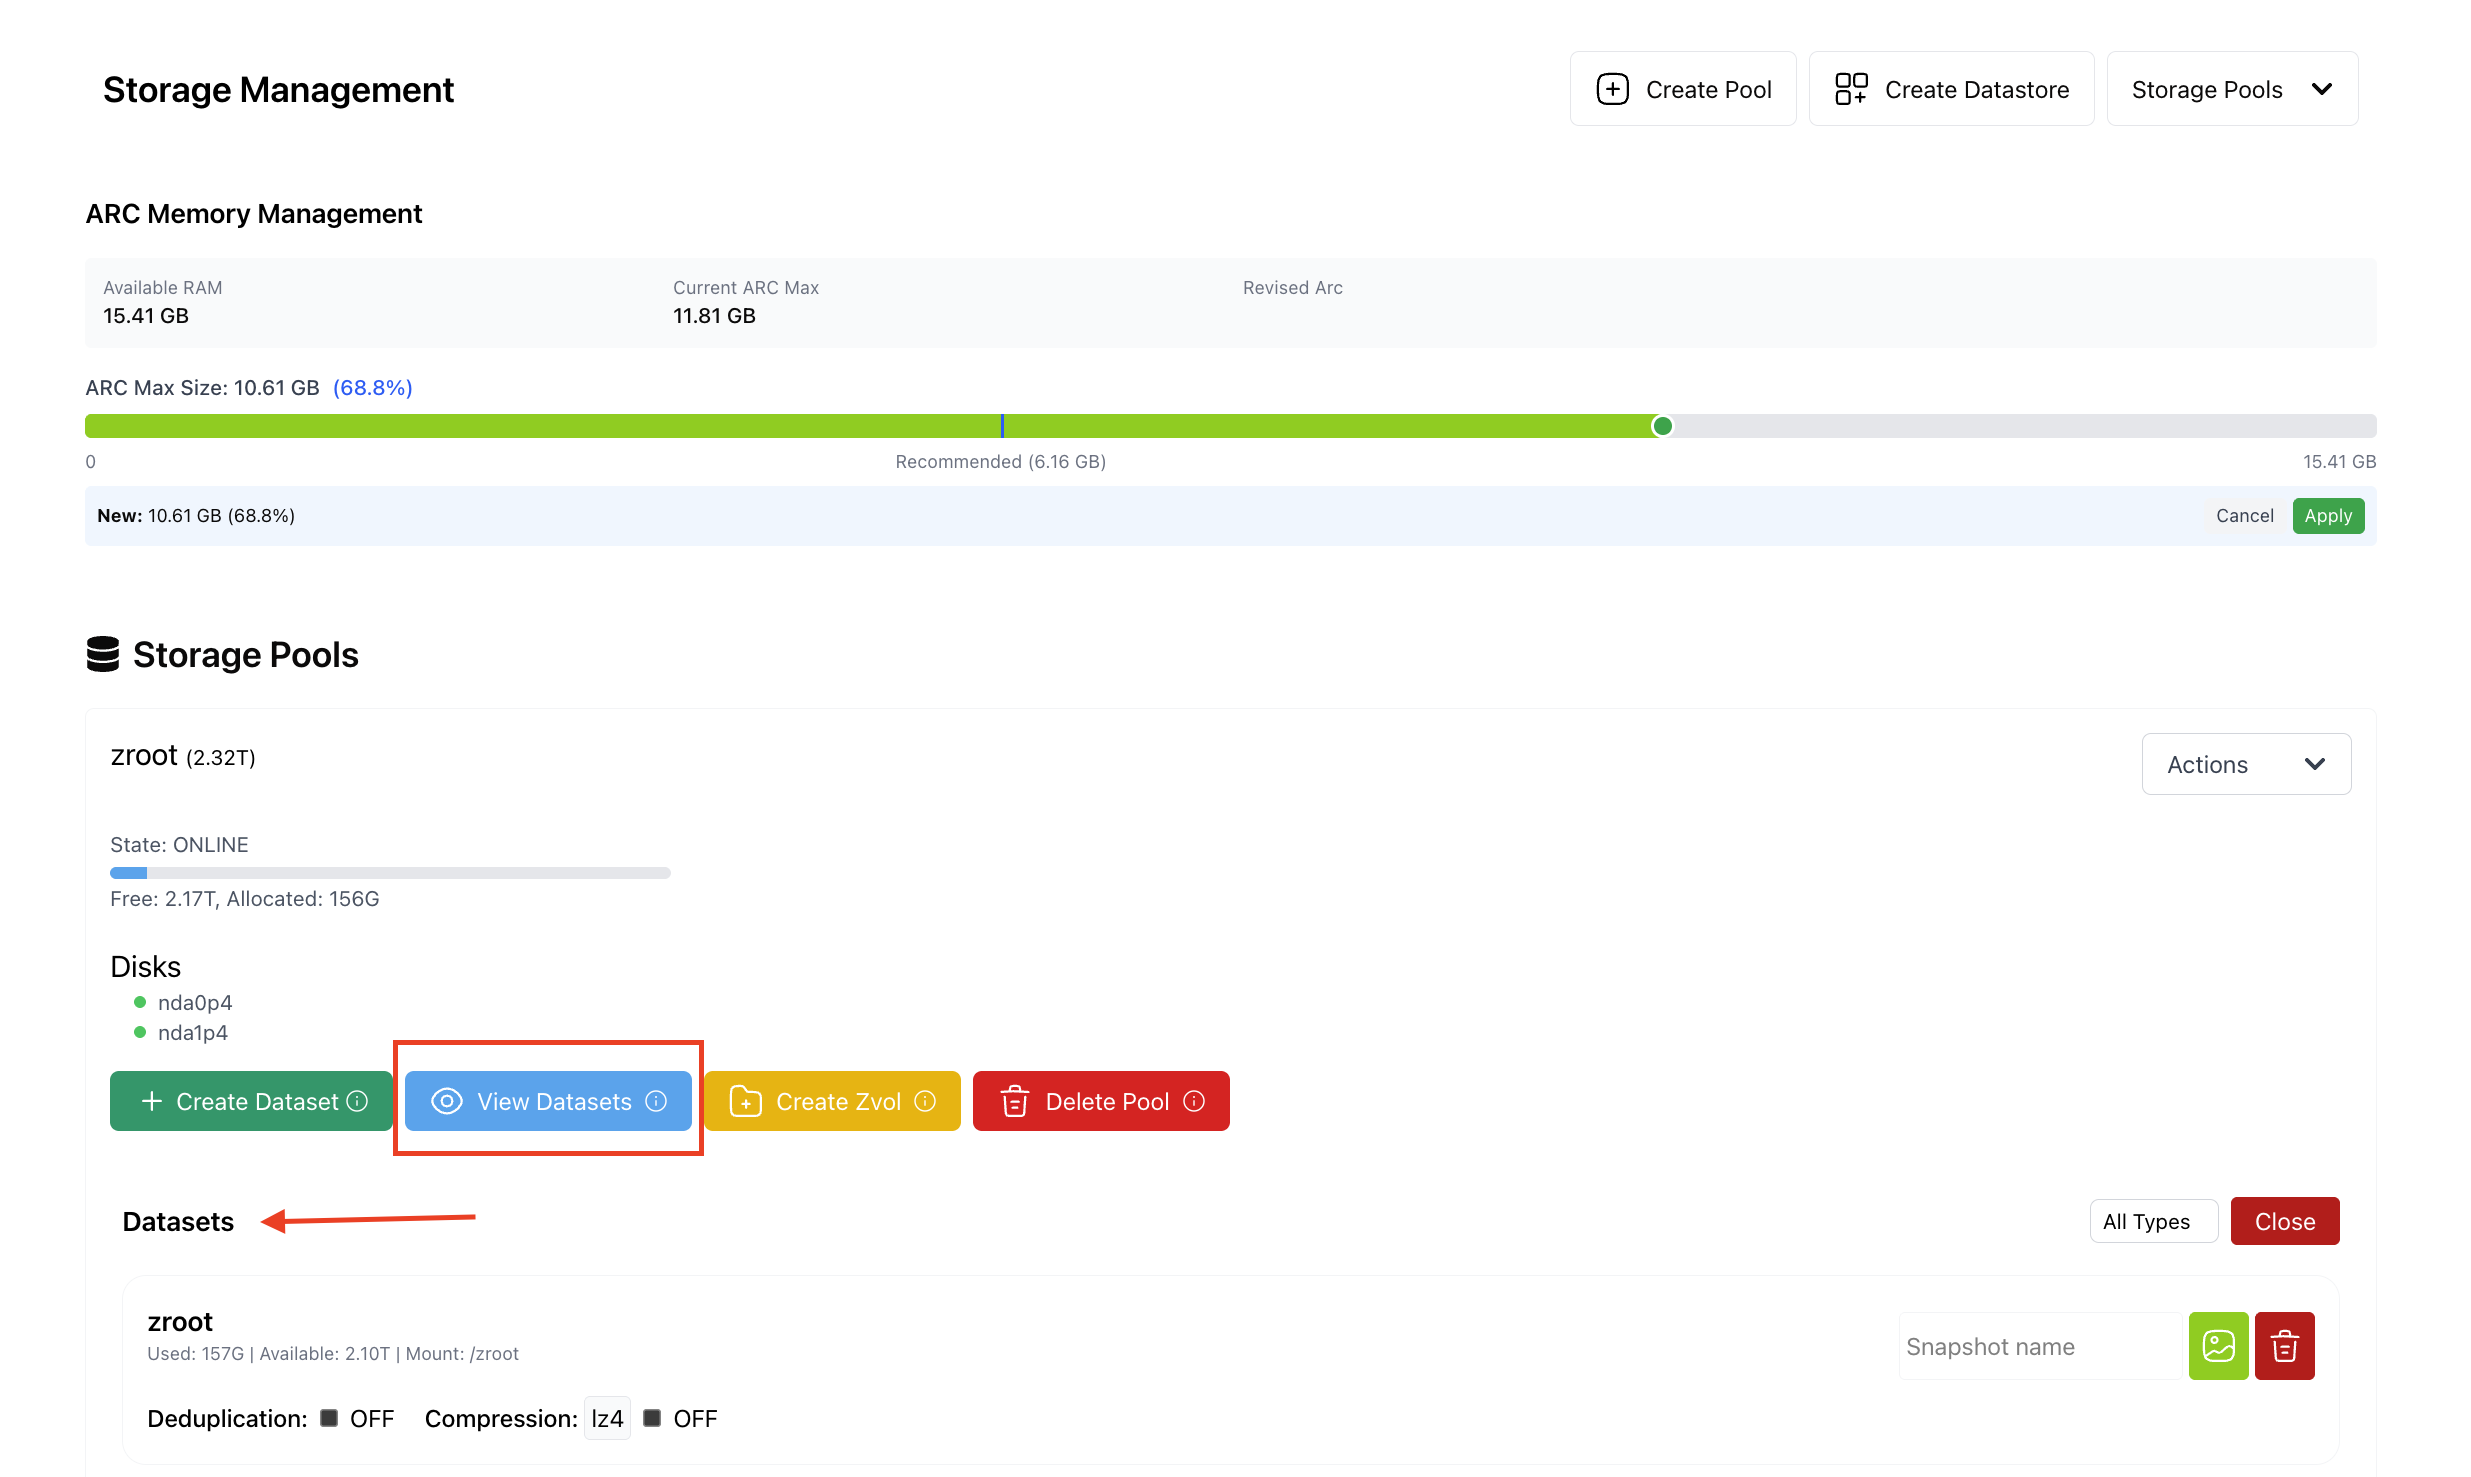
Dataset Types and Filtering:
All Types: Display all dataset types in unified view
Filesystem: File-based datasets for traditional file storage
Volume: Block-based datasets for virtual machine storage
Snapshot: Point-in-time snapshots for data protection
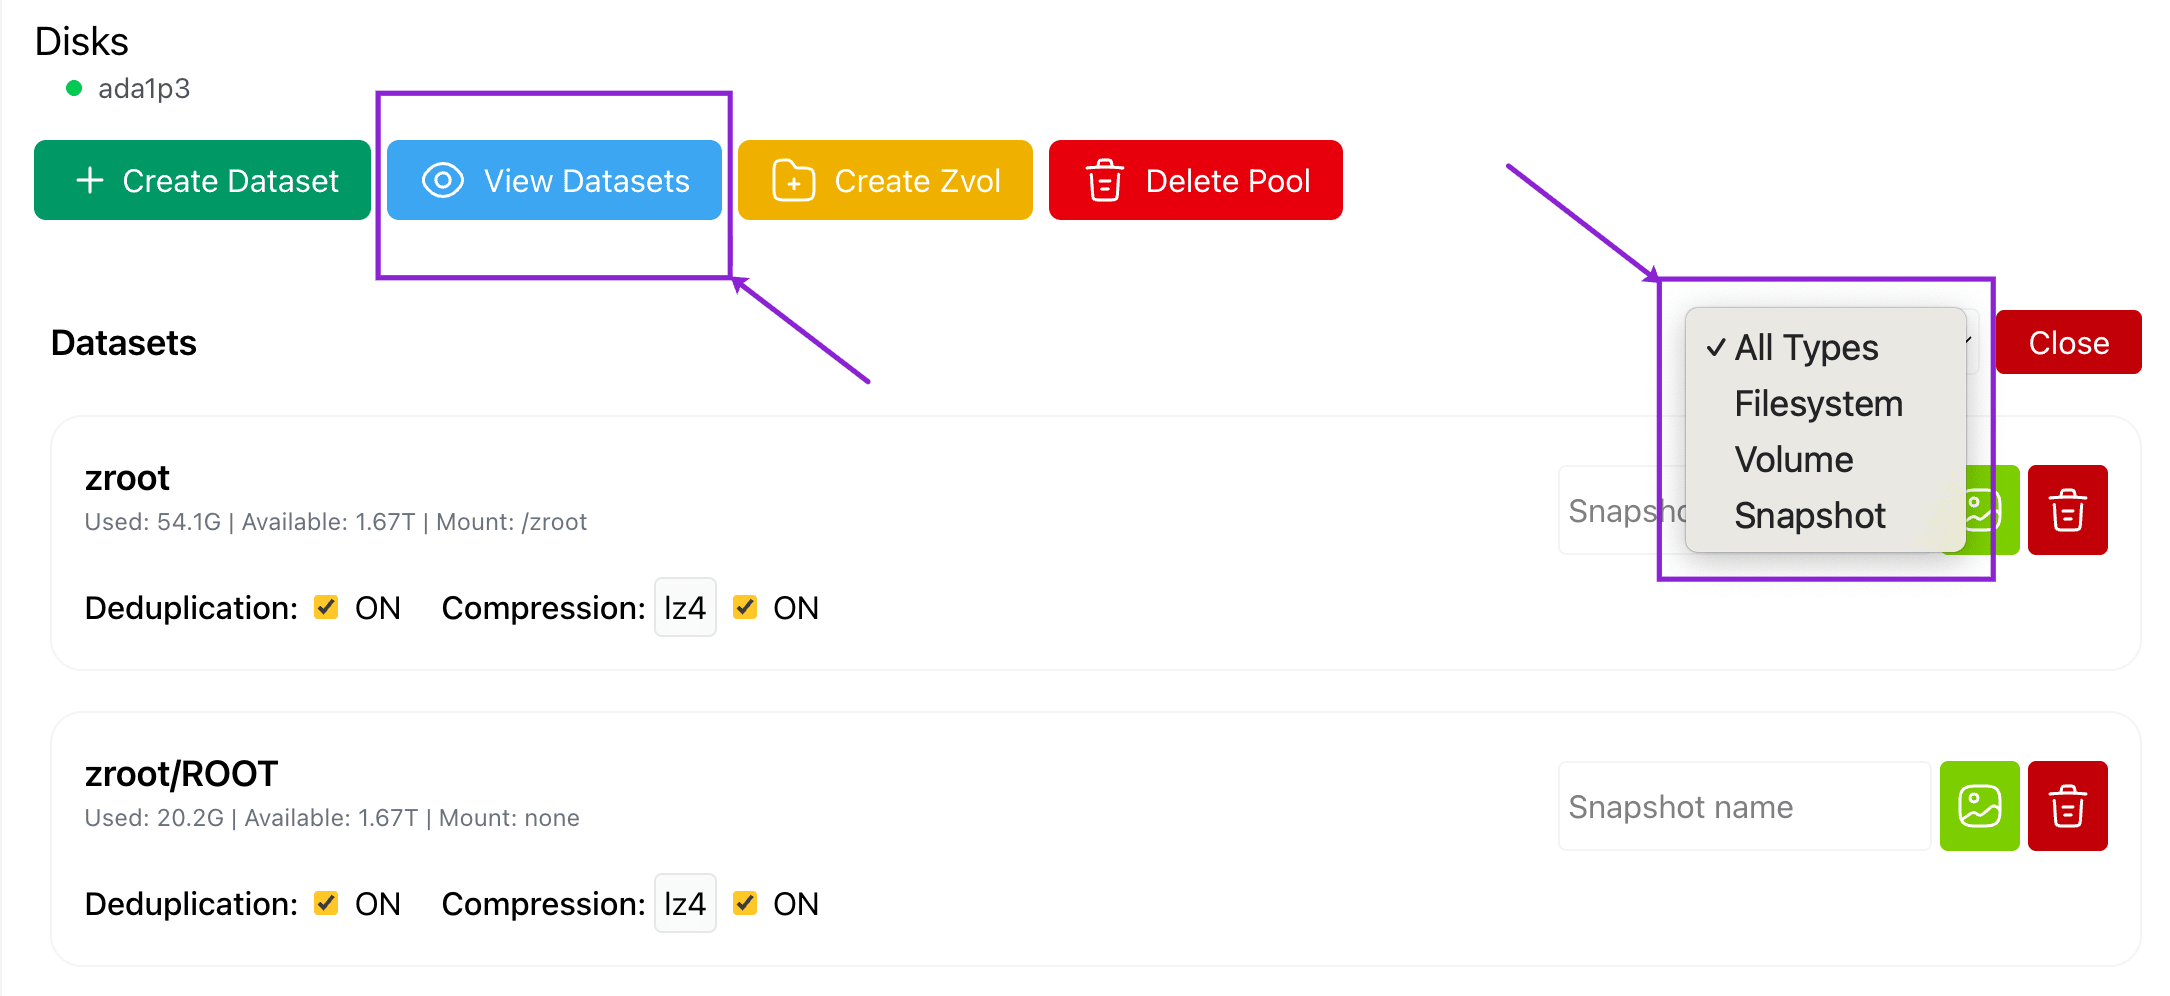
Dataset Operations:
Snapshot Creation: Create point-in-time snapshots with custom naming
Tip
Snapshot A read-only, point-in-time copy of a ZFS dataset or zvol.
Steps to create a snapshot:
Step 1: navigate to a particular dataset or zvol
Step 2: Give an appropriate name
Step 3: Click on the green icon to take a snapshot.

Dataset Deletion: Remove datasets with confirmation prompts

Snapshot Management: Manage snapshot lifecycle and retention
Hierarchical Organization: Organized dataset structure with parent-child relationships
ZFS Advanced Features
Compression Management:
Compression Algorithm: lz4 compression for space efficiency
Compression Status: Real-time compression status indicators (ON/OFF)
Space Savings: Automatic space savings through compression
Performance Impact: Minimal performance impact with lz4 compression
Deduplication Management:
Deduplication Status: Real-time deduplication status monitoring
Space Optimization: Automatic duplicate data removal
Resource Usage: Monitor deduplication resource consumption
Performance Considerations: Balance between space savings and performance
Snapshot Management:
Snapshot Creation: Create instant point-in-time snapshots
Snapshot Naming: Custom snapshot naming with timestamps
Snapshot Types: Different snapshot types for various use cases
Snapshot Retention: Automated snapshot retention policies
Node Monitoring
Monitoring Overview: The Monitoring tab provides comprehensive real-time performance monitoring and historical analysis for individual worker nodes, enabling administrators to track system performance, identify trends, and optimize resource utilization.
Feature available under “Diagnostics” tab.
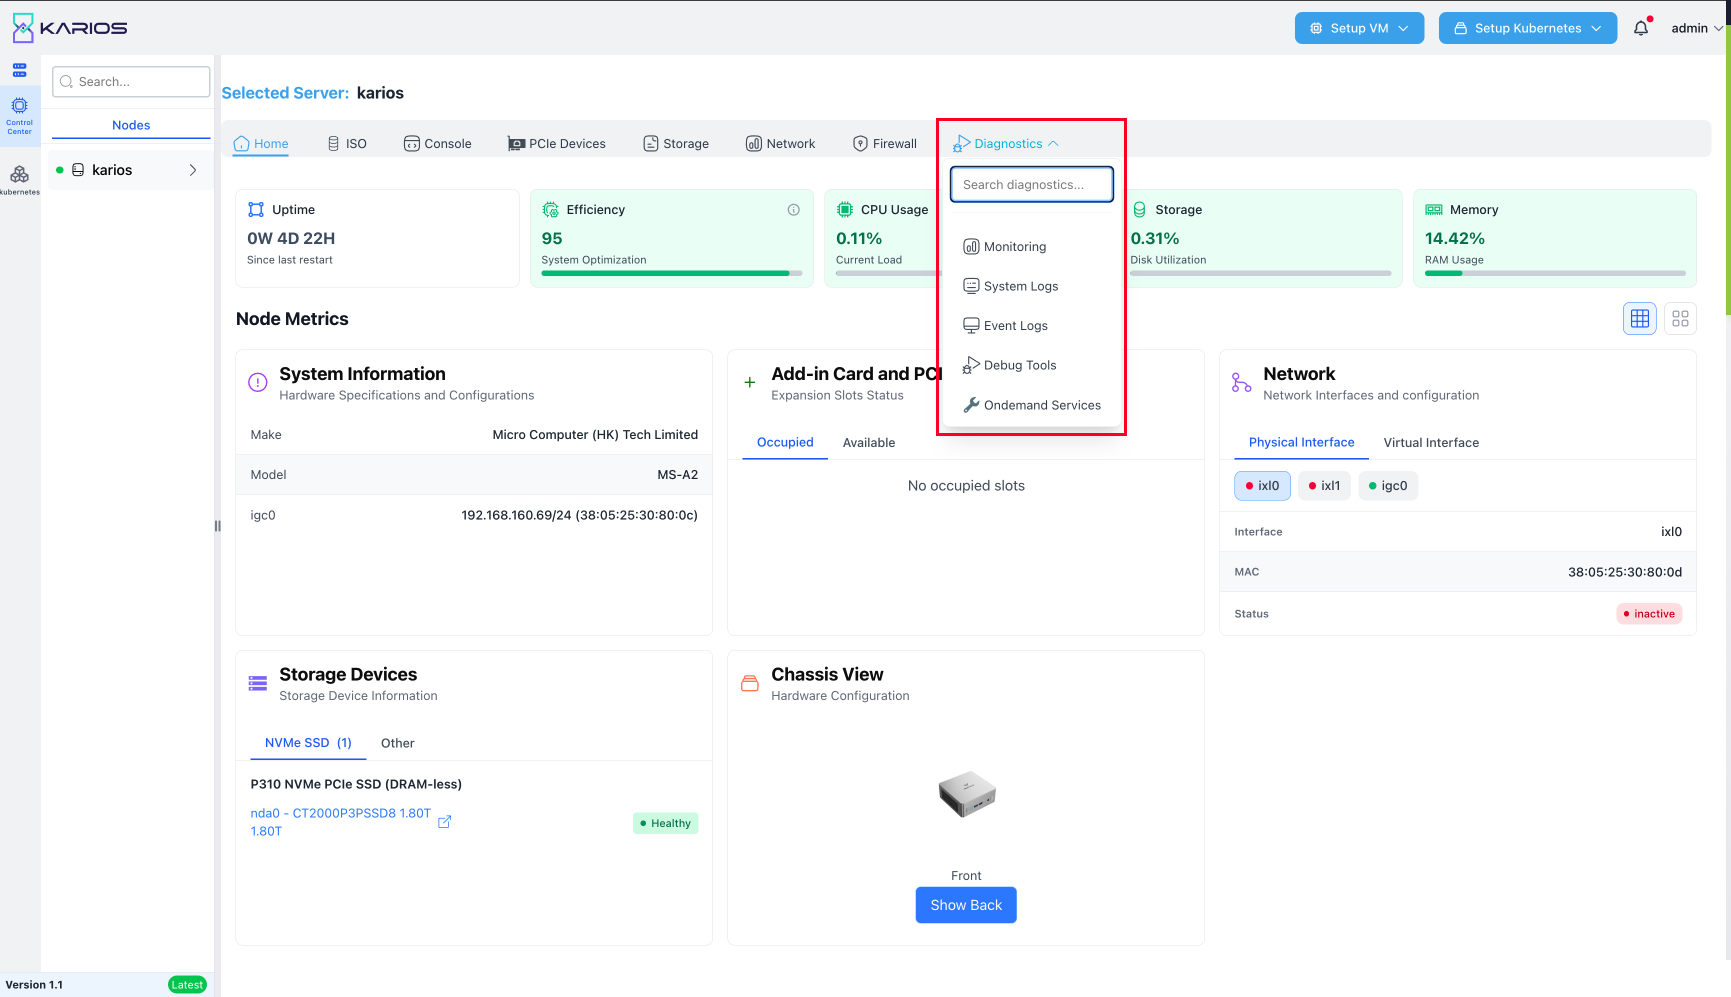
Monitoring Interface: The monitoring interface features a time-based performance dashboard with configurable time ranges and multiple performance metrics displayed in detailed graphical format.
Time Range Selection
Time Range Controls: The monitoring interface provides flexible time range selection for performance analysis:
Available Time Ranges:
Last 1h: Real-time monitoring for the past hour (default selection) Last 30m: Short-term monitoring for the past 30 minutes Last 15m: Immediate monitoring for the past 15 minutes Last 5m: Real-time monitoring for the past 5 minutes Last 1m: Live monitoring for the past minute
Time Range Features:
Active Selection: Currently selected time range highlighted in blue
Flexible Analysis: Choose appropriate time ranges for different analysis needs
Historical Data: Access historical performance data for trend analysis
Real-time Updates: Continuous data updates for live monitoring

CPU Usage Monitoring
CPU Performance Graph: The CPU Usage (%) graph provides detailed real-time monitoring of processor utilization:
CPU Metrics Display:
Y-Axis Scale: CPU percentage scale from 0% to 22% (dynamically adjusted)
Time-based X-Axis: Detailed timestamp display with precise time intervals
Performance Visualization: Red line graph showing CPU usage patterns over time
Usage Patterns: Visual representation of CPU load variations and spikes
CPU Monitoring Features:
Real-time Updates: Continuous CPU usage monitoring with live data
Performance Spikes: Visual identification of CPU usage spikes and patterns
Load Analysis: Detailed analysis of CPU load distribution over time
Resource Planning: Data for capacity planning and resource optimization
CPU Graph Details:
Graph Color: Red line graph for clear CPU usage visualization
Time Precision: Detailed timestamps showing minute-by-minute data
Performance Ranges: Dynamic scaling showing usage from baseline to peak levels
Trend Analysis: Historical CPU usage trends for performance optimization
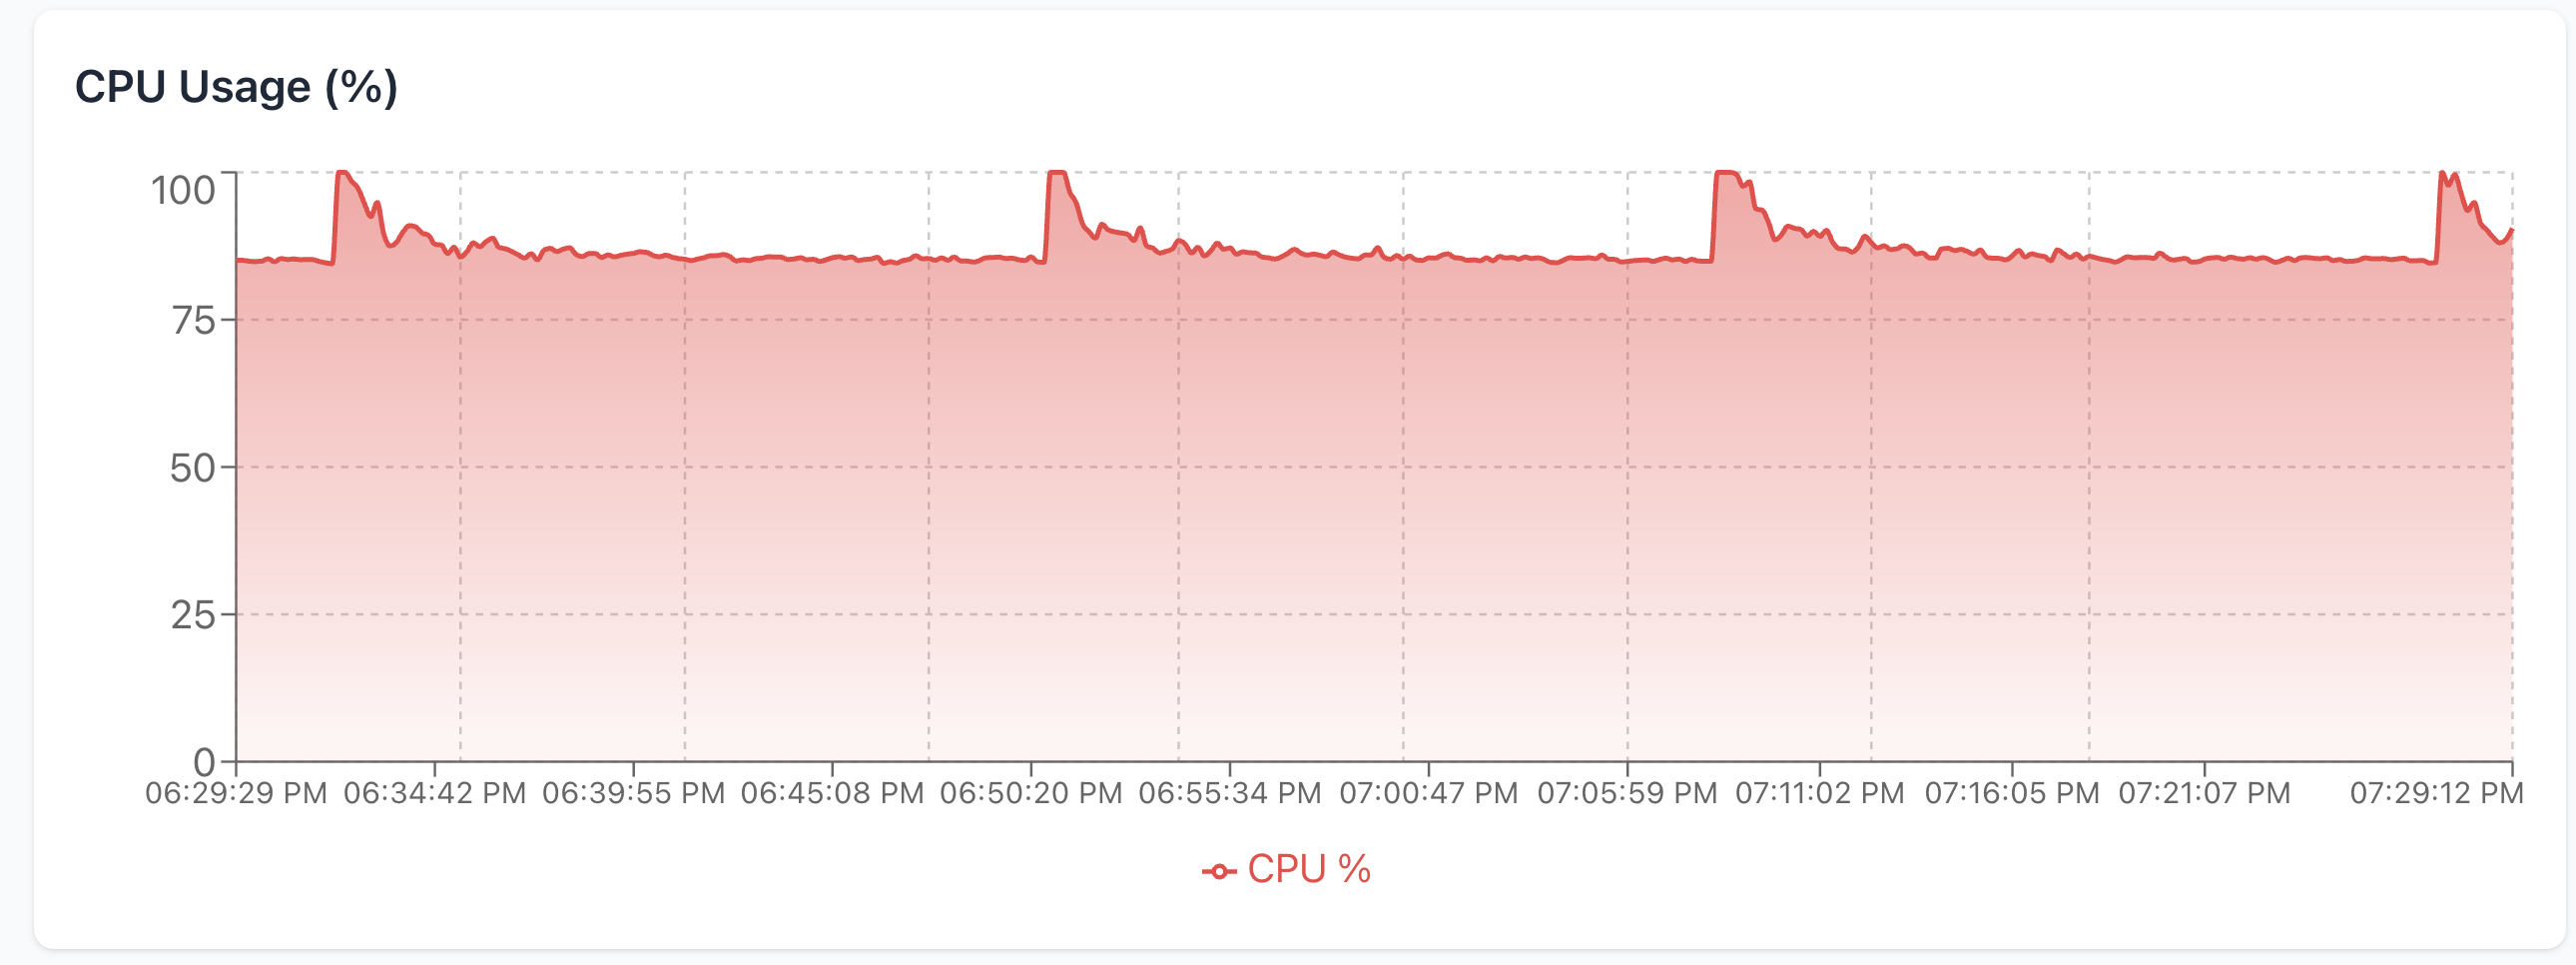
Memory Usage Monitoring
Memory Performance Graph: The Memory Usage (%) graph provides comprehensive memory utilization monitoring:
Memory Metrics Display:
Y-Axis Scale: Memory percentage scale from 0% to 27% (dynamically adjusted) Stable Usage Pattern: Blue line graph showing consistent memory usage Usage Consistency: Visual representation of stable memory consumption Current Usage: Real-time memory usage percentage display
Memory Monitoring Features:
Interactive Tooltips: Hover tooltips showing precise memory usage data
Timestamp Information: Detailed timestamp display (e.g., “Time: 11:03:52 AM”)
Usage Percentage: Specific memory usage percentage (e.g., “Memory Usage: 22.35%”)
Trend Visualization: Blue line graph for clear memory usage patterns
Memory Graph Characteristics:
Stability Indicators: Visual representation of memory usage stability
Usage Patterns: Identification of memory usage patterns and trends
Resource Monitoring: Continuous memory resource utilization tracking
Capacity Analysis: Memory capacity utilization and availability assessment
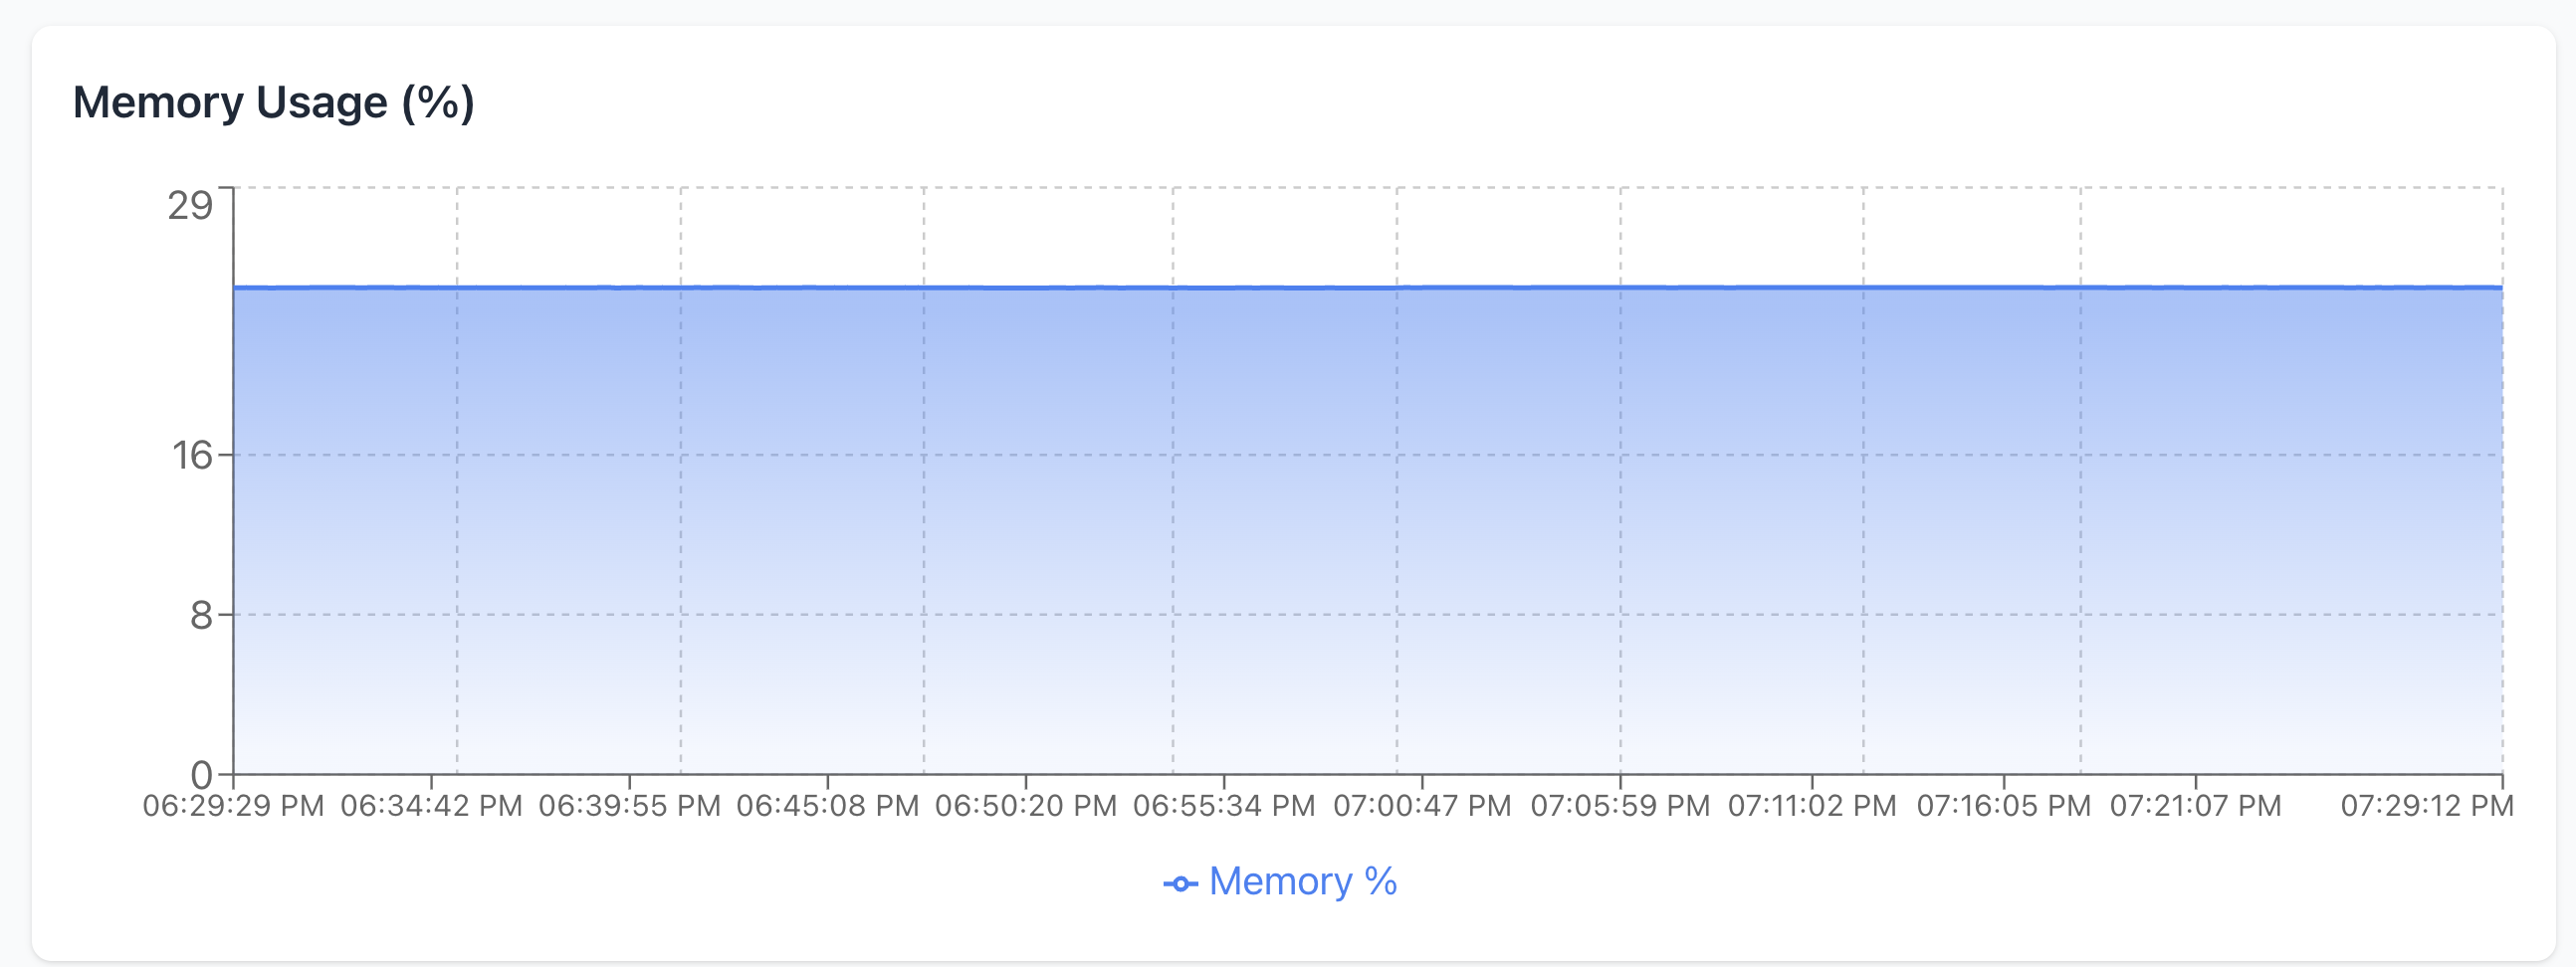
Storage Usage Monitoring
Storage Performance Graph: The Storage Usage (%) graph monitors storage utilization and capacity:
Storage Metrics Display:
Y-Axis Scale: Storage percentage scale from 0% to 6% (dynamically adjusted)
Low Usage Visualization: Green line graph showing minimal storage usage
Usage Stability: Consistent low storage utilization patterns
Capacity Monitoring: Real-time storage capacity utilization tracking
Storage Monitoring Features:
Interactive Data Points: Clickable data points with detailed information
Timestamp Display: Precise timestamp information (e.g., “Time: 11:12:26 AM”)
Usage Percentage: Specific storage usage percentage (e.g., “Storage Usage: 1.05%”)
Trend Analysis: Long-term storage usage trend monitoring
Storage Graph Characteristics:
Green Visualization: Green line graph for storage usage representation
Low Utilization: Visual indication of efficient storage utilization
Capacity Planning: Data for storage capacity planning and expansion
Performance Baseline: Baseline storage performance monitoring
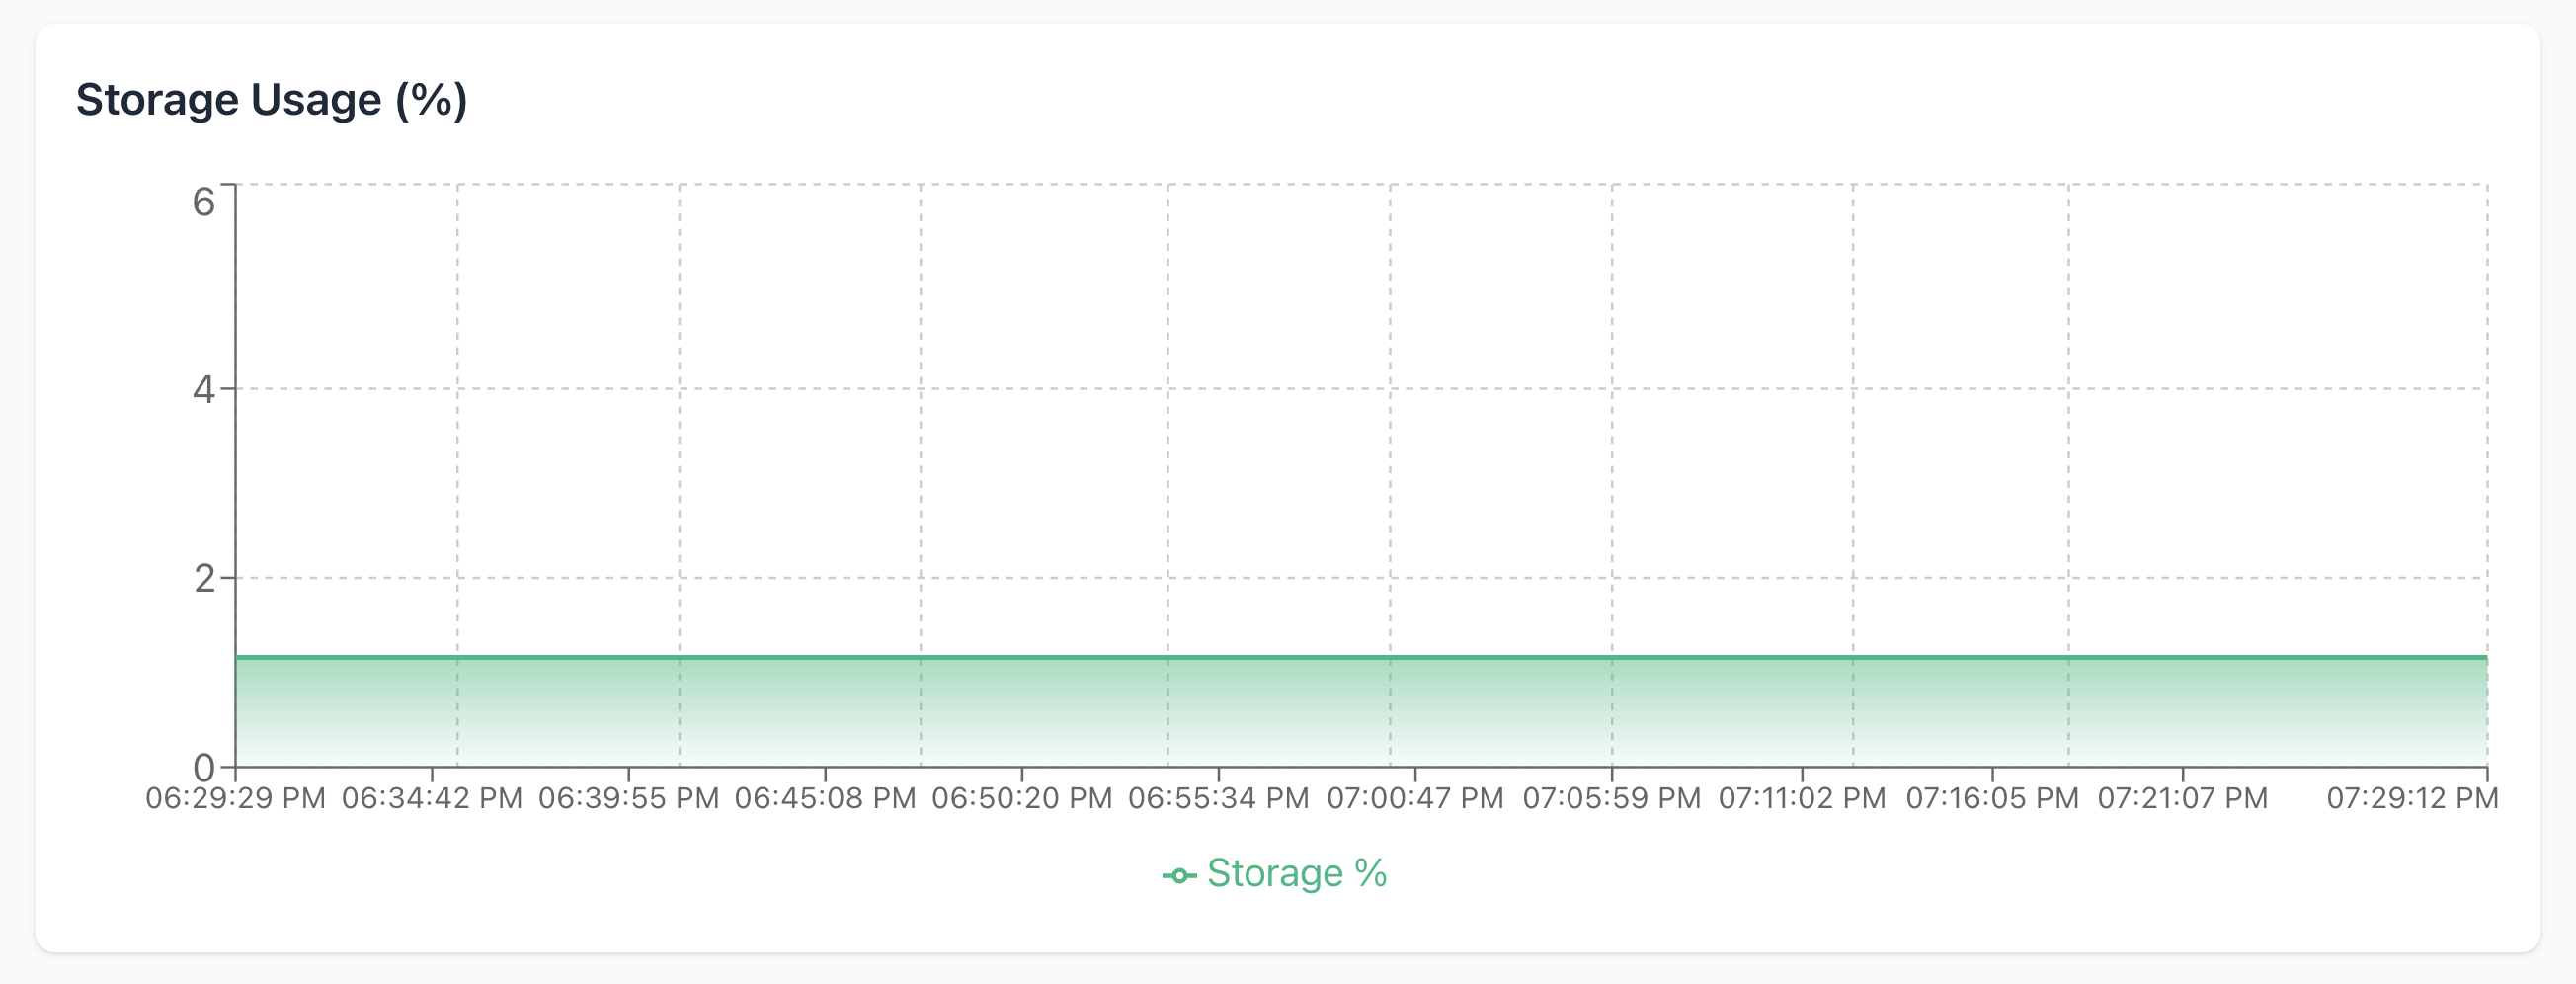
Performance Analytics
Multi-Metric Analysis: The monitoring interface provides comprehensive performance analytics across multiple system resources:
Cross-Resource Correlation:
CPU vs Memory: Correlation analysis between CPU and memory usage
Resource Efficiency: Analysis of overall system resource efficiency
Performance Patterns: Identification of performance patterns across metrics
System Optimization: Data-driven insights for system optimization
Performance Insights:
Usage Patterns: Detailed analysis of resource usage patterns
Peak Performance: Identification of peak performance periods
Resource Bottlenecks: Early identification of potential resource bottlenecks
Optimization Opportunities: Data-driven optimization recommendations
Historical Performance Analysis
Time-Based Analysis: The monitoring system provides comprehensive historical performance analysis:
Historical Data Features:
Time Series Data: Continuous time series data collection and analysis
Trend Identification: Long-term trend analysis for performance optimization
Pattern Recognition: Automatic pattern recognition for performance insights
Comparative Analysis: Compare performance across different time periods
Performance Reporting:
Real-time Dashboards: Live performance dashboards with real-time updates
Historical Reports: Detailed historical performance reports and analysis
Trend Analysis: Long-term performance trend analysis and forecasting
Capacity Planning: Performance data for infrastructure capacity planning
Network Management
Network Overview: The Network tab provides comprehensive network interface and switch management for individual worker nodes, enabling administrators to configure network connectivity, manage virtual switches, and monitor network interface status across the cluster infrastructure.
Network Interface Management: The network management interface features dedicated sections for interface monitoring and switch configuration, providing granular control over network connectivity and virtual network topology.
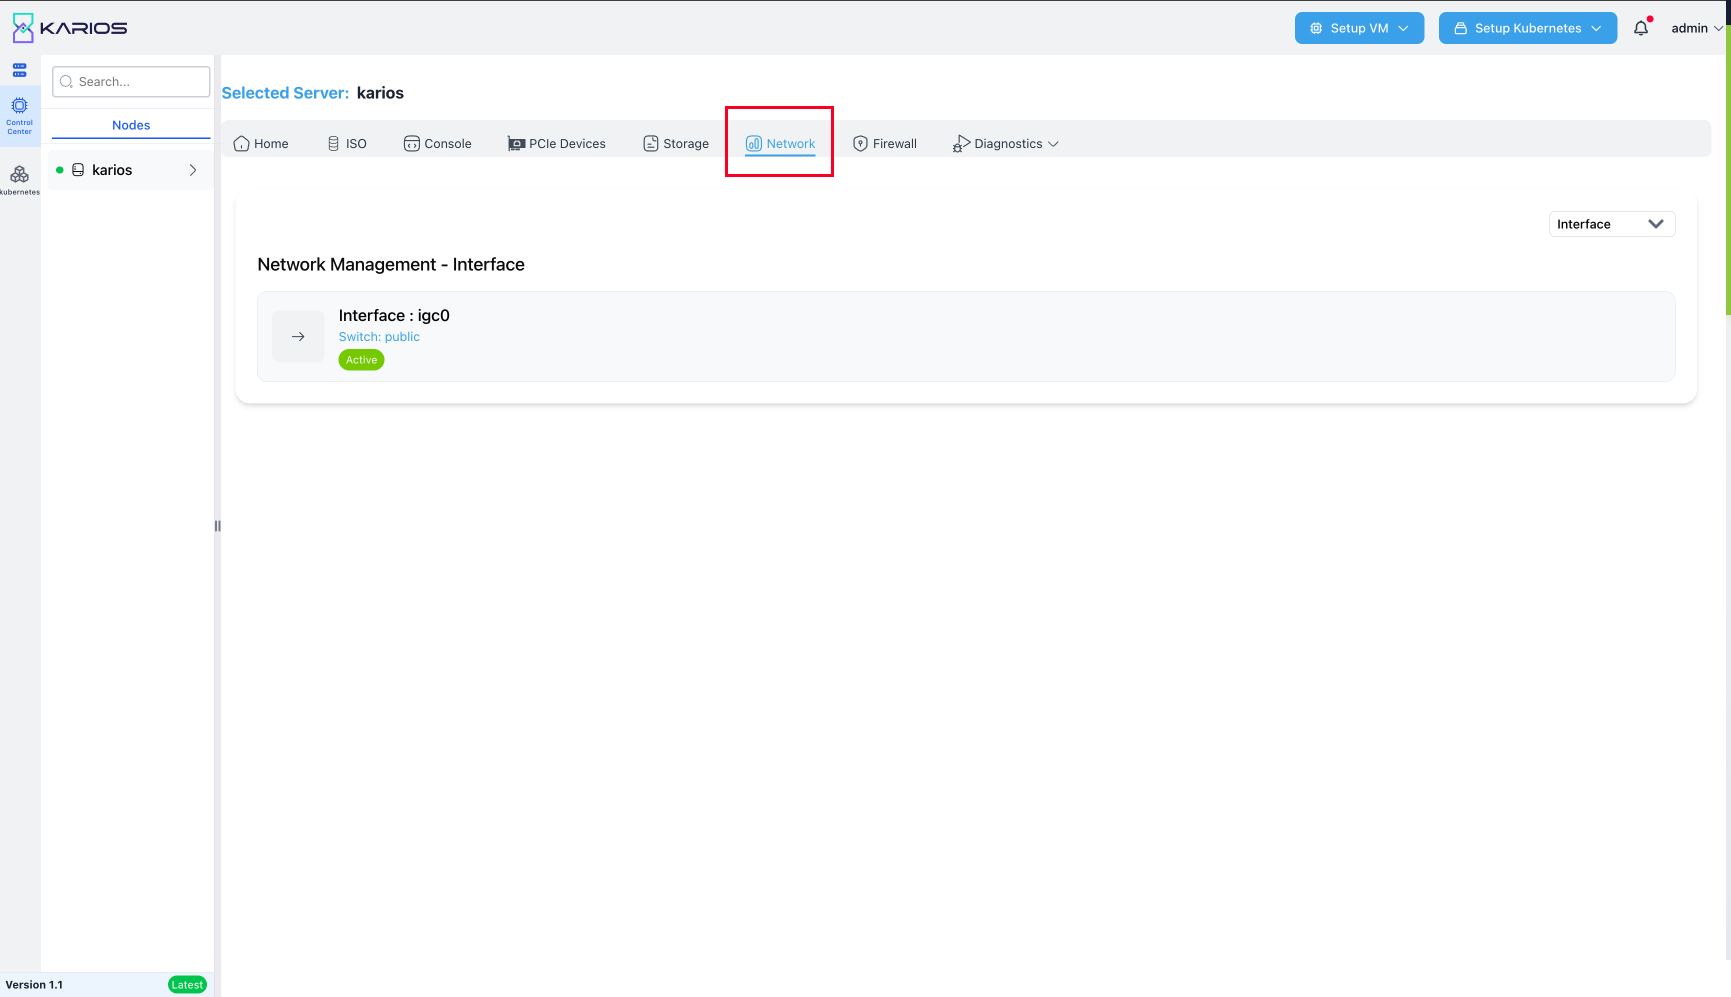
Network Interface Configuration
Interface Overview: The Network Management - Interface section displays all available network interfaces for the selected worker node:
Available Network Interfaces:
Primary network interface with active switch association
Secondary network interface without switch association
Additional network interface available for configuration
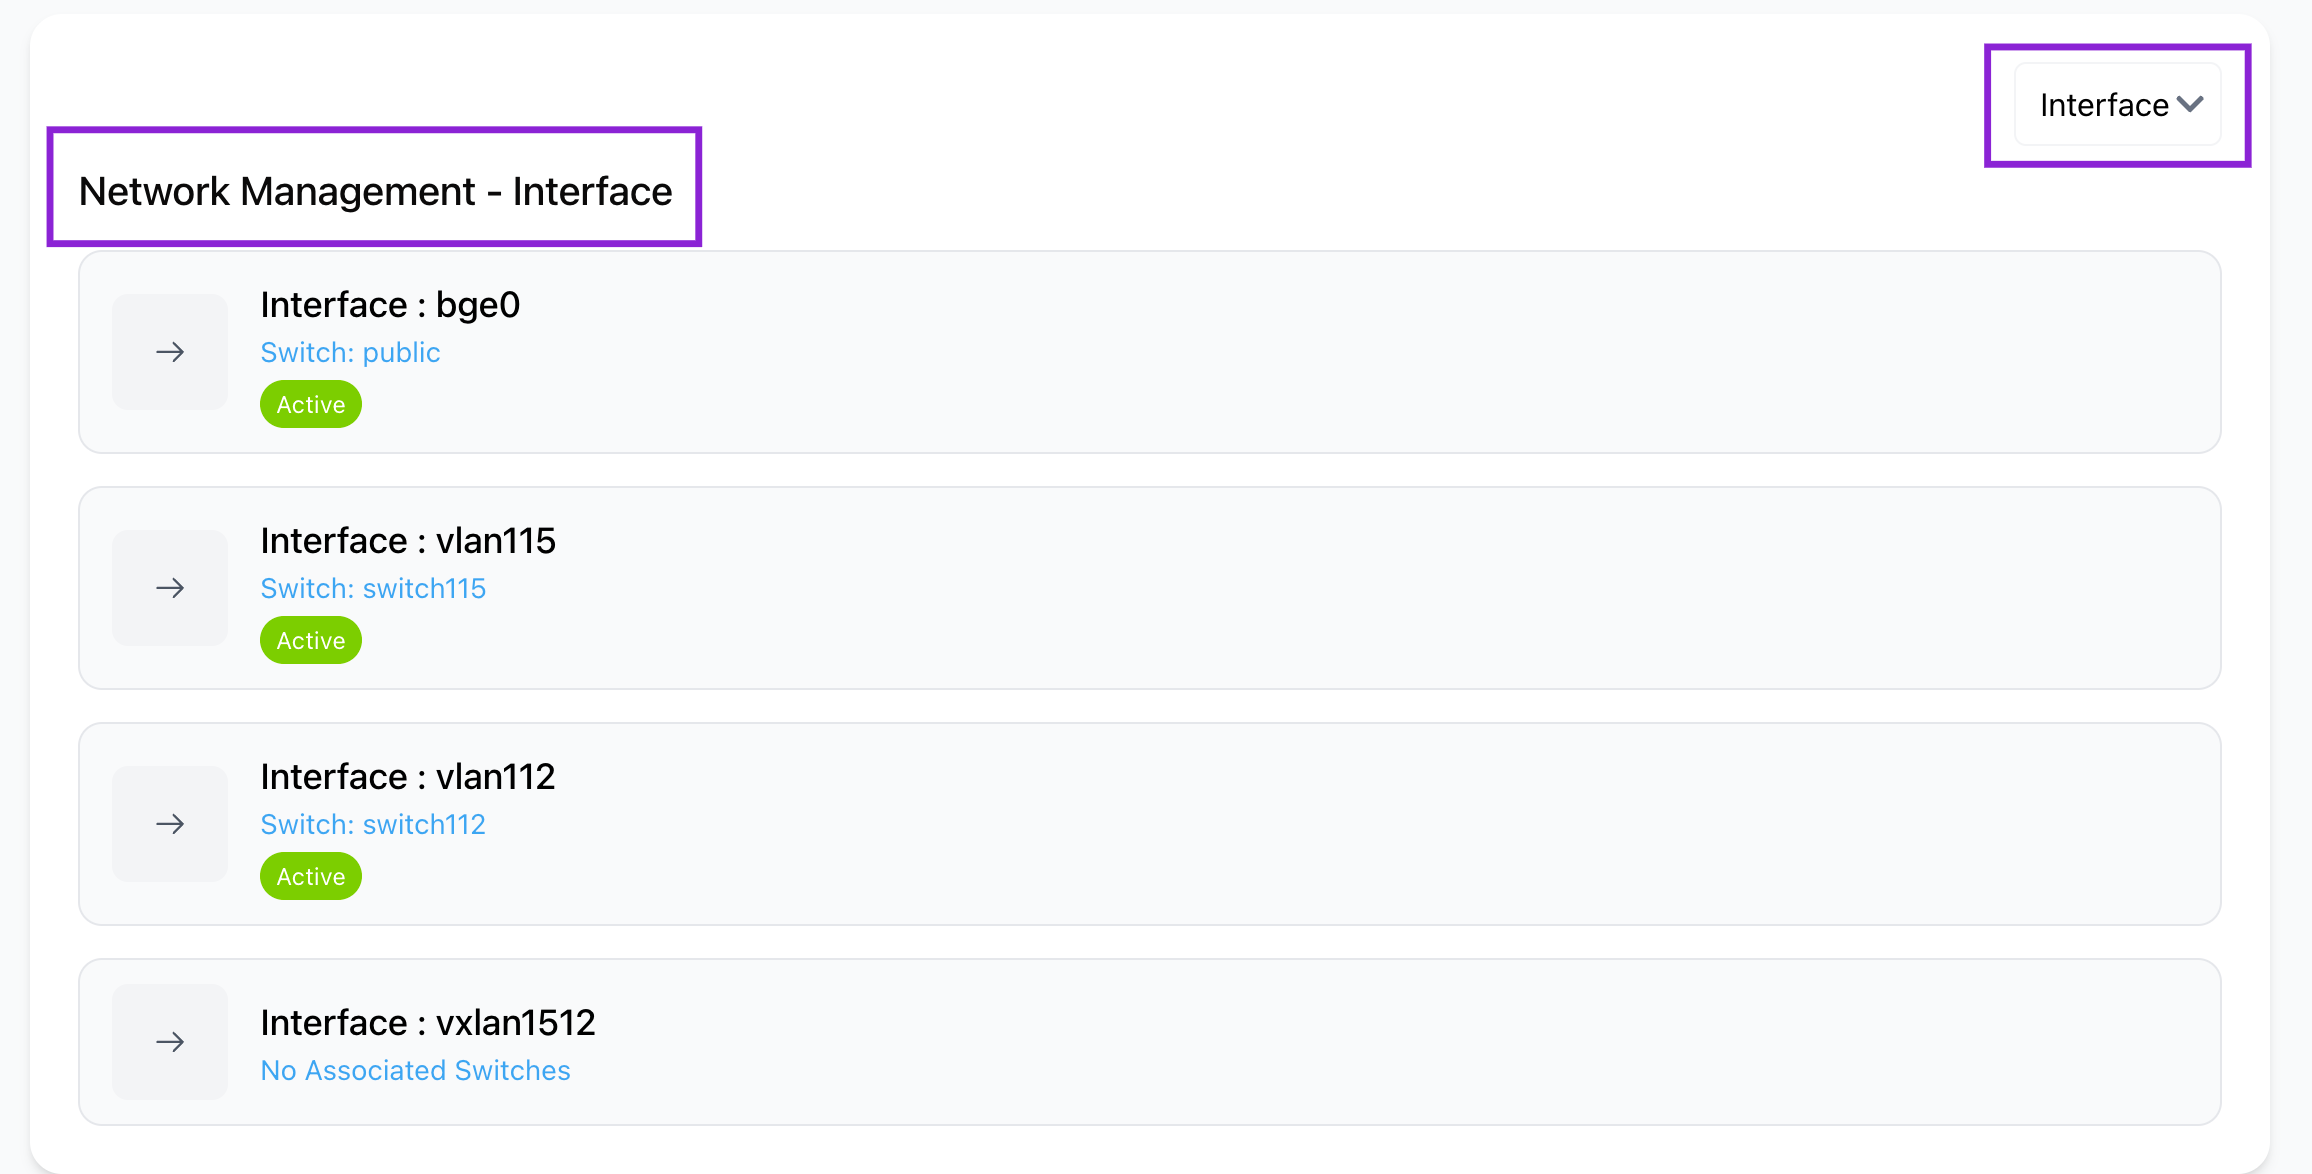
Interface Information Display:
Interface Name: Clear identification of each network interface (e.g., bnxt0, bnxt1, ue0)
Switch Assignment: Associated switch name display (e.g., “Switch: default”)
Status Badges: Color-coded status indicators for quick assessment
Association Status: Clear indication of switch association or availability
Interface Configuration Options:
Switch Association: Ability to associate interfaces with virtual switches
Network Type: Public/Private network classification management
Configuration Access: Direct access to detailed interface settings
Virtual Switch Management
Switch Overview: The Network Management - Switches section provides comprehensive virtual switch management and configuration:
Virtual Switch Display:
Switch Listing: Complete inventory of configured virtual switches
Interface Association: Clear display of associated network interfaces
Status Monitoring: Real-time switch operational status
Configuration Access: Direct access to switch configuration options
Switch Configuration Features:
Switch Creation: “Create Switch” button for new virtual switch deployment
Switch Deletion: Red delete button for switch removal
Interface Assignment: Management of interface-to-switch assignments
Switch Creation and Configuration
Create Switch Interface: The Create Switch modal provides comprehensive switch creation and configuration options:
Switch Creation Form:
Switch Name Input: Text field for custom switch name entry
Interface Selection: Dropdown menu for interface assignment
Creation Controls: Cancel and Create Switch action buttons
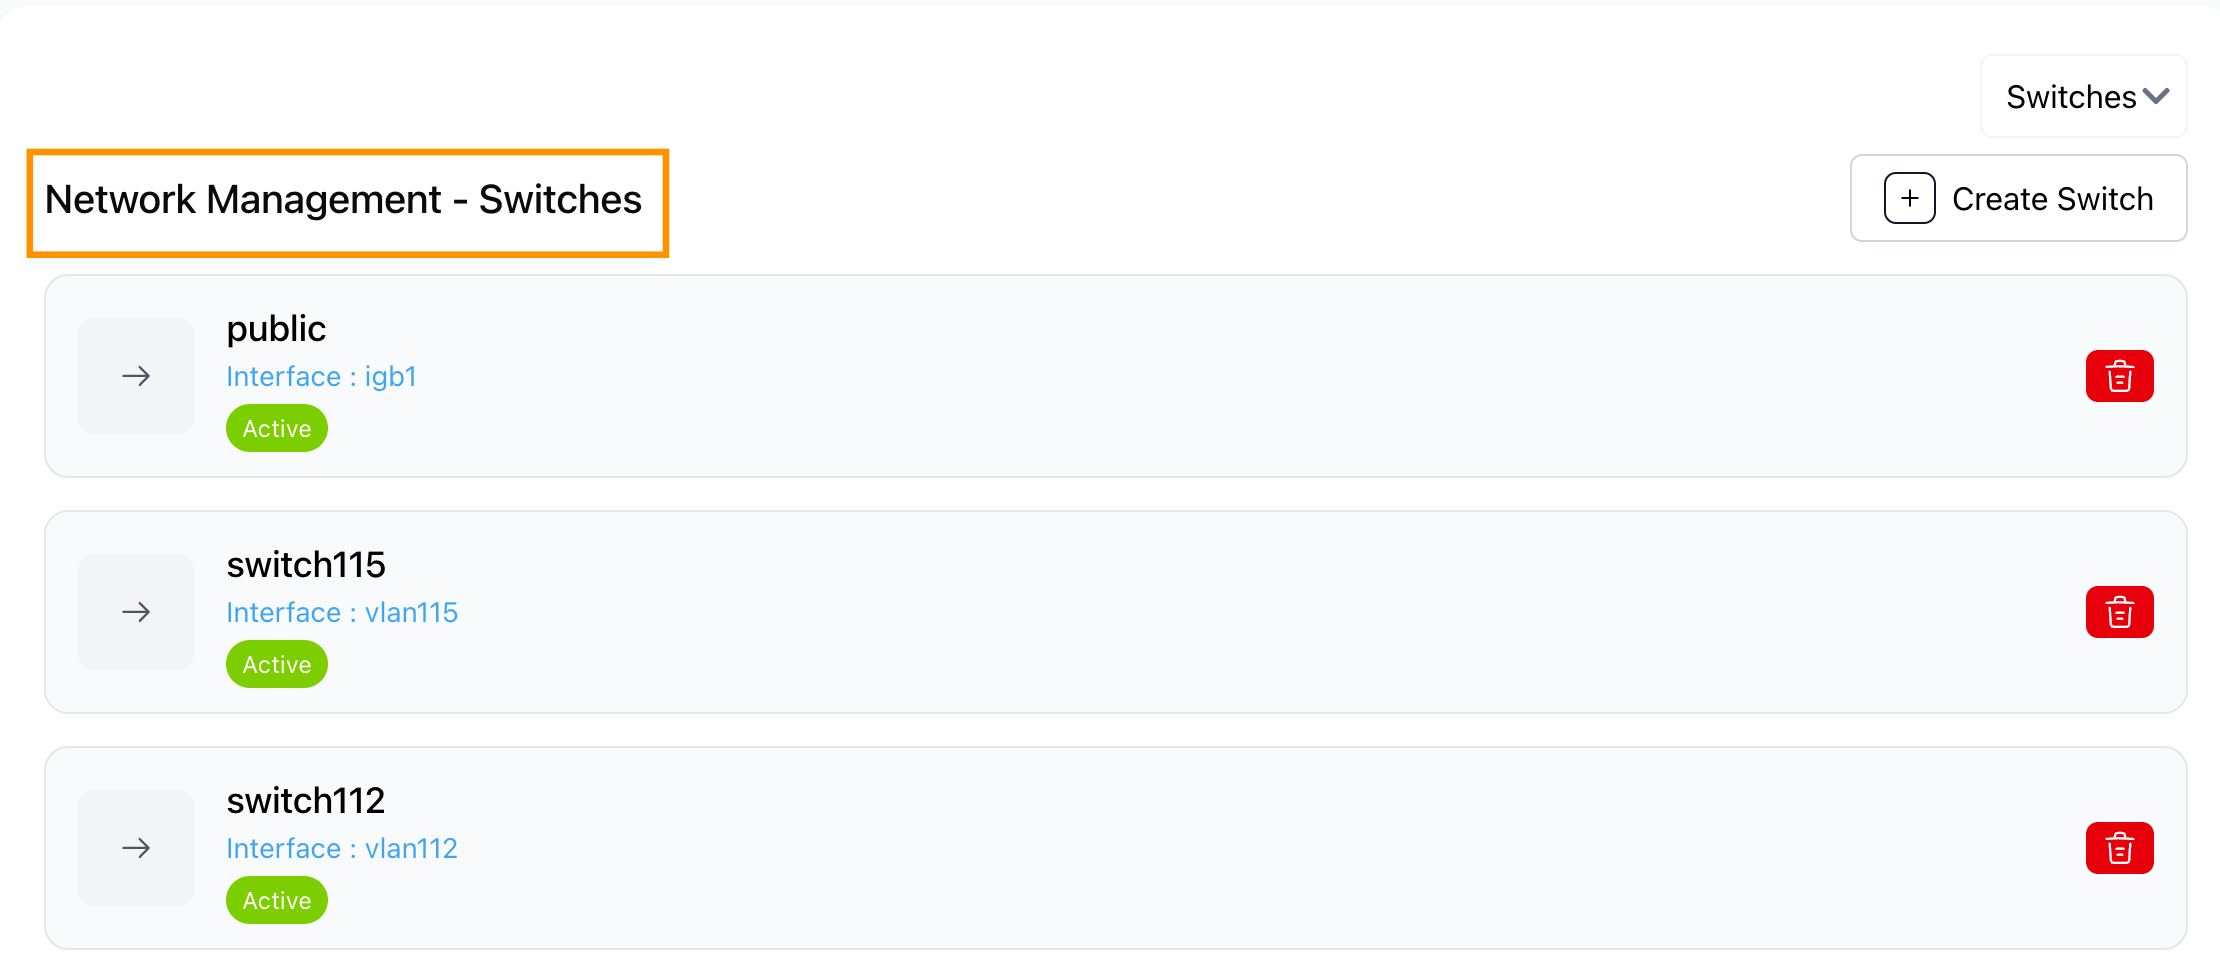
Switch Creation Process:
Name Assignment: Enter descriptive switch name in the text field
Interface Selection: Choose target interface from dropdown menu
Configuration Review: Verify switch configuration parameters
Switch Creation: Click “Create Switch” button to deploy new switch
Status Verification: Confirm successful switch creation and activation
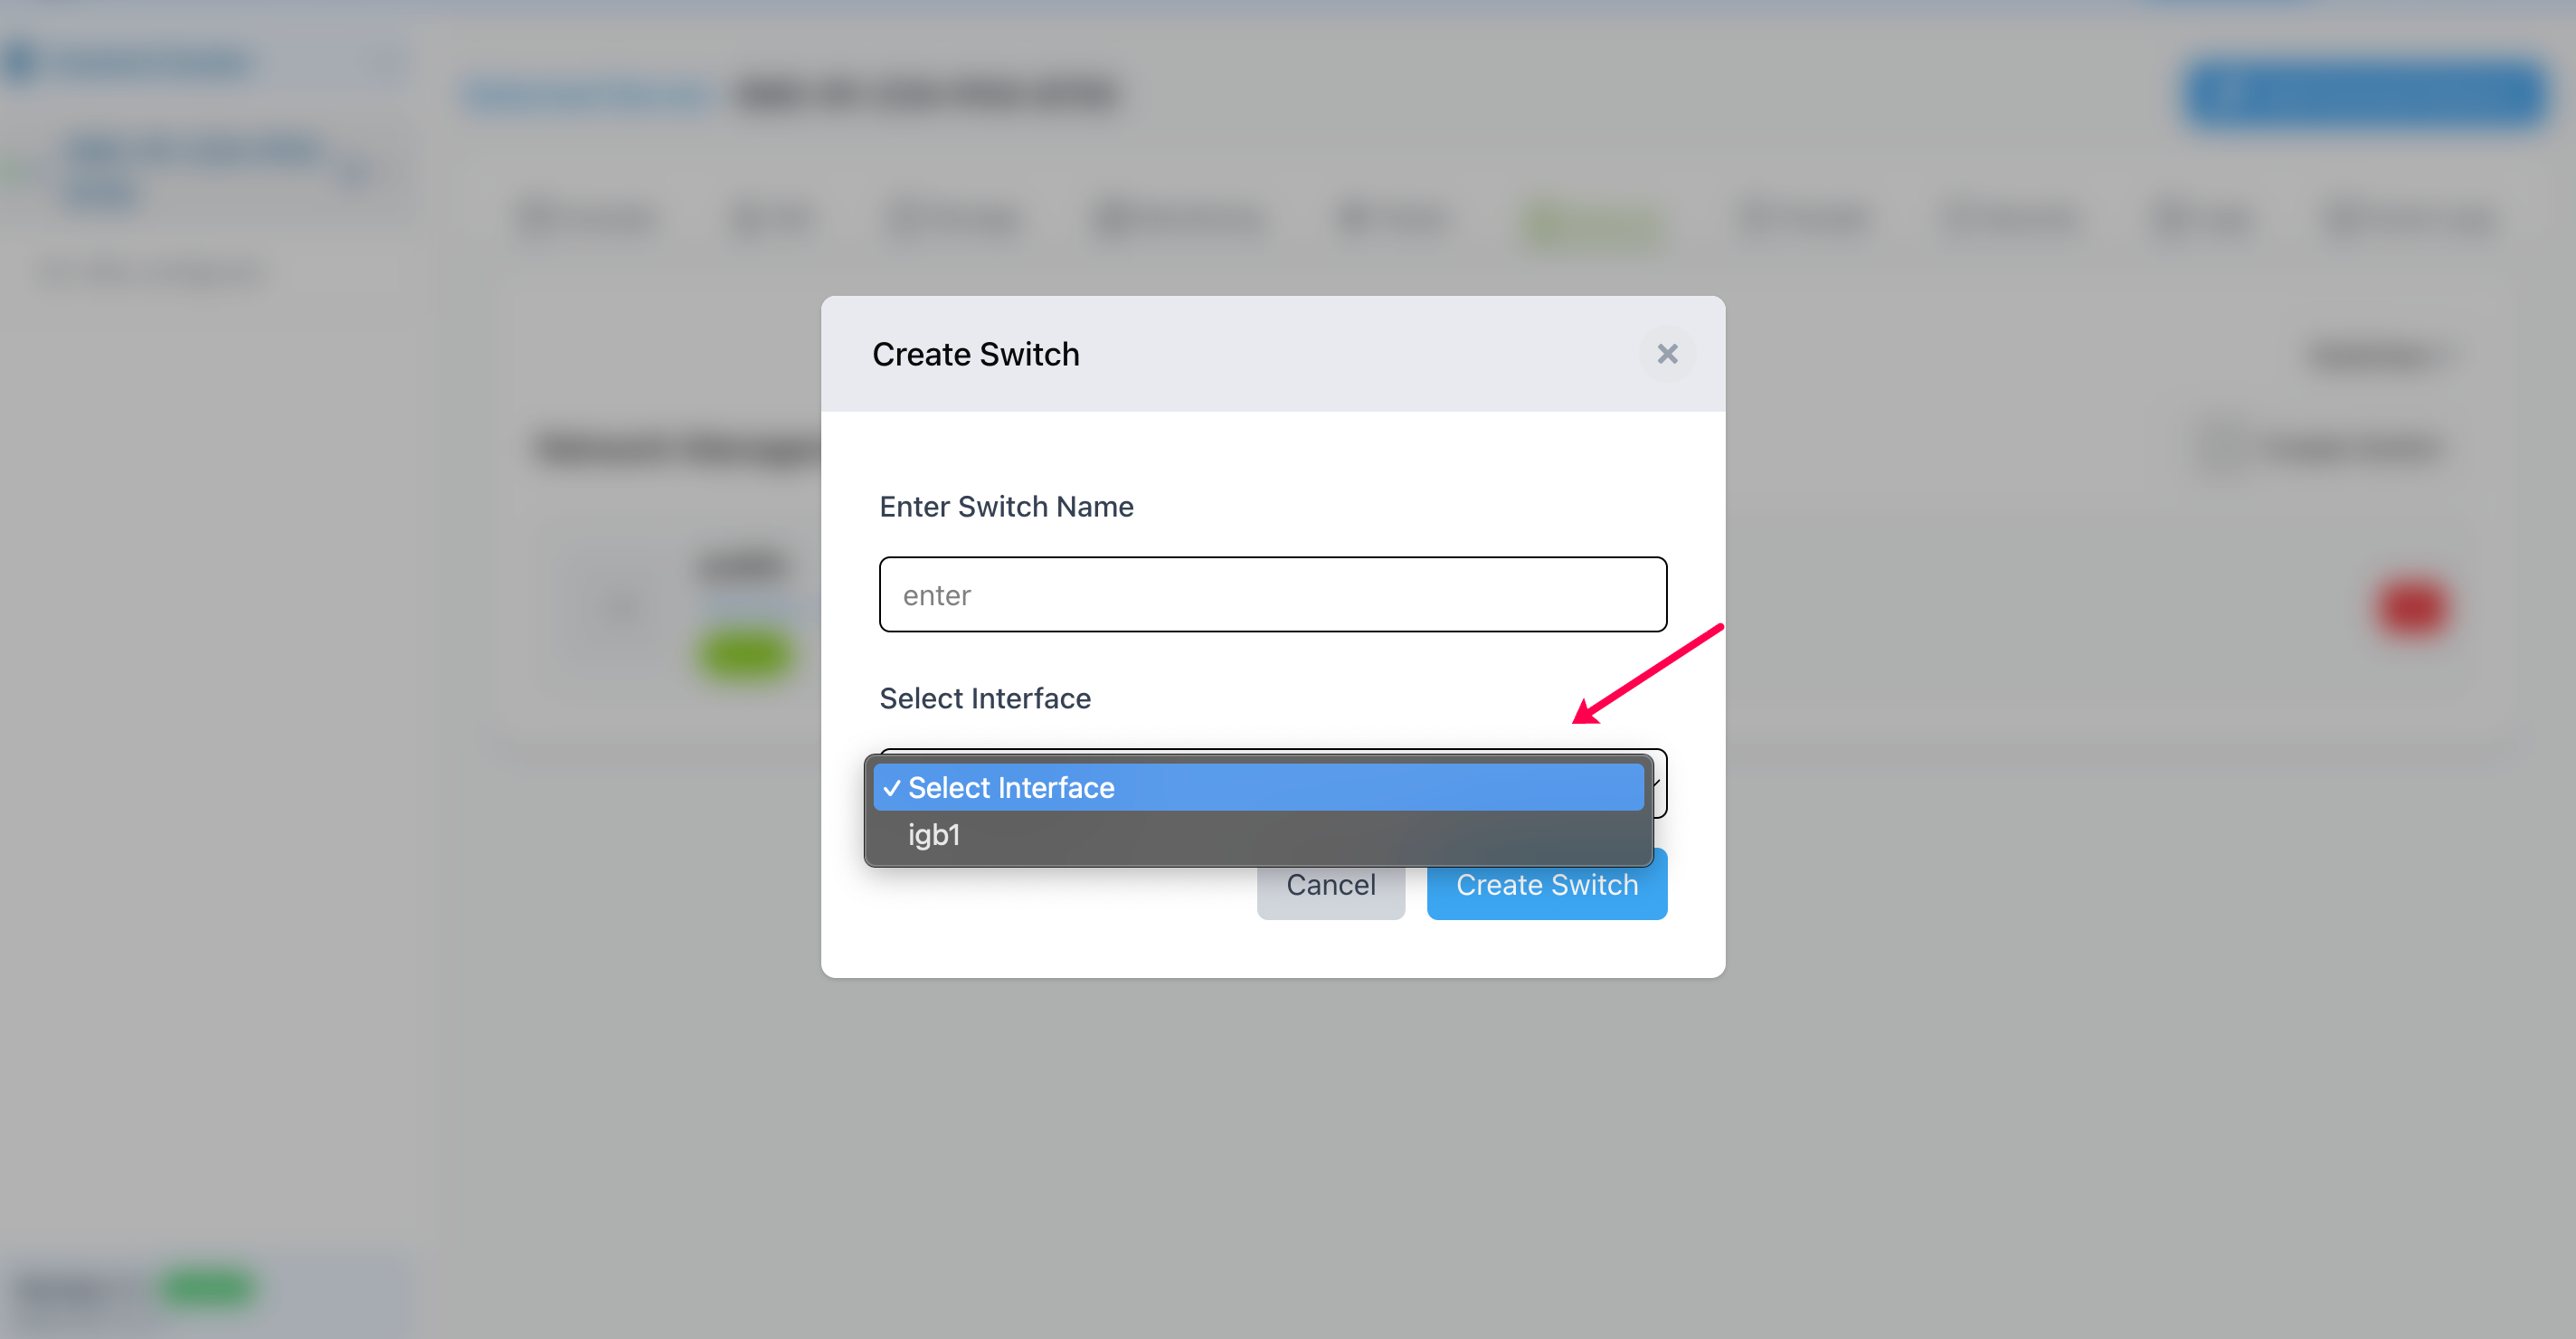
The switch management interface displays all configured virtual switches.
Network Configuration Best Practices
- Interface Configuration:
Naming Conventions: Use descriptive names for switches and interfaces
Association Management: Maintain clear interface-to-switch relationships
- Switch Management:
Strategic Planning: Plan virtual switch topology for optimal performance
Resource Allocation: Allocate interfaces efficiently across switches
Status Monitoring: Regular monitoring of switch operational status
- Network Management:
Access Control: Implement appropriate network access controls
Traffic Monitoring: Monitor network traffic for anomalies
Configuration Validation: Validate network configuration changes
Firewall Management
Overview: The Firewall tab provides comprehensive packet filter (PF) rule management for individual worker nodes, enabling administrators to configure network policies and manage traffic filtering rules through advanced firewall configuration.
Firewall Rule Management: The firewall interface features a code-based rule editor with syntax highlighting, real-time validation, and safety mechanisms to prevent system lockout through configuration errors.

Packet Filter Rules Interface
PF Firewall Rules
Connection Protection Rules
This PF rule acts as a guard for your server, preventing connection flooding and brute-force attacks. It works by implementing multiple protection mechanisms:
- Limiting Connections
Restricts the number of simultaneous connections and rate of new connection attempts from any single IP address
- Overload Protection
When configured limits are exceeded, the rule aggressively blocks attackers by dropping their connections and terminating existing ones using a pre-defined “bruteforce” action block
- Attack Mitigation
Designed to stop malicious actors from overwhelming your server with connection requests while minimizing disruption to legitimate users
Configuration Requirements
Proper configuration is crucial for rule effectiveness:
Critical Components:
Connection limit thresholds appropriate for your environment
Rate limiting parameters for new connection attempts
Bruteforce overload block configuration
Timeout values for blocked connections
Best Practices:
Test configuration changes in a controlled environment
Monitor logs to ensure legitimate traffic isn’t blocked
Adjust thresholds based on actual traffic patterns
Document configuration changes for future reference
Warning
Configuration Impact Improper PF rule configuration can block legitimate traffic or fail to protect against attacks. Always validate settings before applying to production systems.
PF Rules Display: The Packet Filter Rules section provides a comprehensive view of all active firewall rules.
Rule Configuration Display:
Line Numbers: Sequential line numbering for easy rule reference and navigation
Syntax Highlighting: Color-coded syntax highlighting for different rule components
Rule Structure: Clear display of rule syntax with proper formatting
Code Editor: Full-featured code editor with firewall rule editing capabilities
Advanced Configuration Warning:
Risk Assessment: Clear indication of potential configuration issues
Expertise Requirement: Emphasis on required expertise for rule modification
System Lockout Prevention: Warning about potential system access issues
Firewall Rule Components
Rule Structure Analysis: The firewall rules are organized in a structured format with specific components.
Interface Configuration:
External Interface: Definition for external network interface
Interface Assignment: Clear association between logical and physical interfaces
Network Boundary: Definition of network perimeter and access points
Traffic Direction: Inbound and outbound traffic handling specifications
Policy Configuration:
Block Policy: Set block-policy return for default blocking behavior
Fragment Handling: Fragment reassemble for packet processing
Skip Interface: Loopback interface exclusion
Default Actions: Comprehensive default policy configuration
Traffic Filtering Rules
Rule Types and Functions: The firewall configuration includes multiple rule types for comprehensive traffic control.
Pass Rules Configuration:
Quick Rules
Protocol-Specific Rules
State Maintenance: Automatic connection state tracking for established connections
Direction Control: Separate inbound and outbound traffic rule definitions
Block Rules Implementation:
Default Block: For comprehensive inbound traffic blocking
Selective Blocking: For controlled outbound access
Anti-Spoof: For IP spoofing prevention
Service Access Rules:
Port-Based Access Control: The firewall configuration includes specific port access rules.
- SSH Access Control:
SSH Port
Connection Flags: Proper TCP connection flag handling for secure connections
State Tracking: Automatic connection state maintenance for SSH sessions
Access Scope: Controlled SSH access from authorized sources
- Multi-Service Access:
Port Range: {9090, 9100, 3000, 80, 443, 8080:8084, 5001, 6900:7000, 5432, 9592, 9595, 9694}
Service Portfolio: Comprehensive port access for multiple services and applications
State Management: Automatic connection state tracking for all services
Simple vs Advanced Mode
The interface provides two operational modes:
Simple Mode: Quick and easy firewall rules for most common needs
Advanced Mode: Full PF configuration capabilities for complex scenarios

Packet Filter Management - Simple Mode
The Simple Mode interface provides a user-friendly way to configure FreeBSD Packet Filter (PF) rules through an intuitive drag-and-drop interface. This mode is designed for quick and easy firewall rule creation without requiring deep knowledge of PF syntax.
Interface Components
Existing Packet Filters Section
The left panel displays currently configured packet filter elements organized by type:
Variables: Network interface definitions and other variables
Set Options: Firewall behavior configuration options
Rules: Pass/block rule definitions
Tables: Address groupings for rule references
Anchors: NAT/RDR anchor definitions
Adding New Packet Filter Rules
Select Rule Type
Choose from the available rule types:
Variables - Define network interfaces and other variables
Set Options - Configure firewall behavior options
Tables - Define address tables for grouping
Rules - Define pass/block rules
Anchors - Define NAT/RDR anchors
Anchor Templates - Predefined service configurations
Rule Configuration Options
Variables
Configure network interface definitions and custom variables:
Variable Name: Define the variable identifier (e.g.,
ext_if)Value: Set the variable value (e.g.,
igb0)
Set Options
Configure firewall behavior settings:
Option Name: Select from available options (e.g.,
block-policy)Value: Choose the appropriate value from dropdown
Tables
Define address groups for use in rules:
Table Name: Spplified rule creation fecify table identifier (e.g.,
trusted_nets)Properties: Optional table properties
Entries: Comma-separated list of addresses/networks (e.g.,
192.168.1.0/24, 10.0.0.0/8)
Rules
Create pass/block rules with comprehensive options:
Rule Creation Mode: Choose between Custom or Quick Toggle
Custom: Full manual rule configuration
Quick Toggle: Simplified rule creation for common services
Basic Rule Configuration:
Action: pass, block, or reject
Direction: in, out, or any
Address Family: inet, inet6, or any
Interface: Select network interface
Protocol: TCP, UDP, ICMP, or any
Source/Destination: Define source and destination criteria
Port: Specify port ranges
State: Connection state handling
Quick Toggle Services:
FTP (21): File Transfer Protocol
SSH (22): Secure Shell access
Anchors
Define NAT/RDR anchor points:
Anchor Type: NAT Anchor or RDR Anchor
Anchor Name: Identifier for the anchor (e.g.,
ftp-proxy/*)
Anchor Templates
Select from predefined service configurations:
FTP Proxy (2121): FTP through proxy configuration
ICMP (N/A): Ping and network diagnostics
Configuration Process
Step-by-Step Rule Creation
Select Rule Type: Choose the appropriate rule category from the dropdown
Configure Parameters: Fill in the required configuration fields based on rule type
Add Rule: Click the relevant “Add” button (Add Variable, Add Table, Add Rule, etc.)
Drag and Drop: The new rule appears in the left panel where you can drag it to reorder priority
Save Changes: Click “Save Changes” to apply the configuration
Configuration Validation and Application
When you click “Save Changes”:
Syntax Check: The system validates PF rule syntax
60-Second Timer: If syntax is valid, a 60-second confirmation timer begins
Confirmation Required: You must confirm the changes within 60 seconds
Automatic Rollback: If not confirmed, changes are automatically reverted
Rule Application: Upon confirmation, the new PF configuration is saved and applied
Warning
Always ensure you have alternative access to the system before applying firewall changes. The 60-second confirmation window provides a safety mechanism to prevent lockouts.
Advanced Features
When Simple Mode limitations are reached, Advanced Mode provides:
Complex rule matching criteria
Advanced NAT/RDR configurations
Queue management and traffic shaping
Custom macro definitions
Raw PF rule syntax editing
Switch to Advanced Mode when you need capabilities beyond the simplified interface options.
Use the “Need more options? Switch to Advanced Mode” link or “Advanced” button at the top to access additional configuration options when Simple Mode doesn’t provide sufficient flexibility.
Rule Editing and Modification - Advanced Mode
Interactive Rule Editor: The firewall interface provides comprehensive rule editing capabilities.
Code Editor Features:
Syntax Highlighting: Color-coded syntax for different rule components
Line Numbering: Sequential line numbers for easy reference
Real-time Validation: Live syntax validation during rule editing
Error Detection: Automatic detection of syntax errors and misconfigurations
Rule Modification Process:
Direct Editing: Click-to-edit functionality for individual rules
Syntax Validation: Real-time syntax checking during modification
Type the firewall rules in the code editor and click “save” button. The system will automatically validate the syntax and highlight any errors.
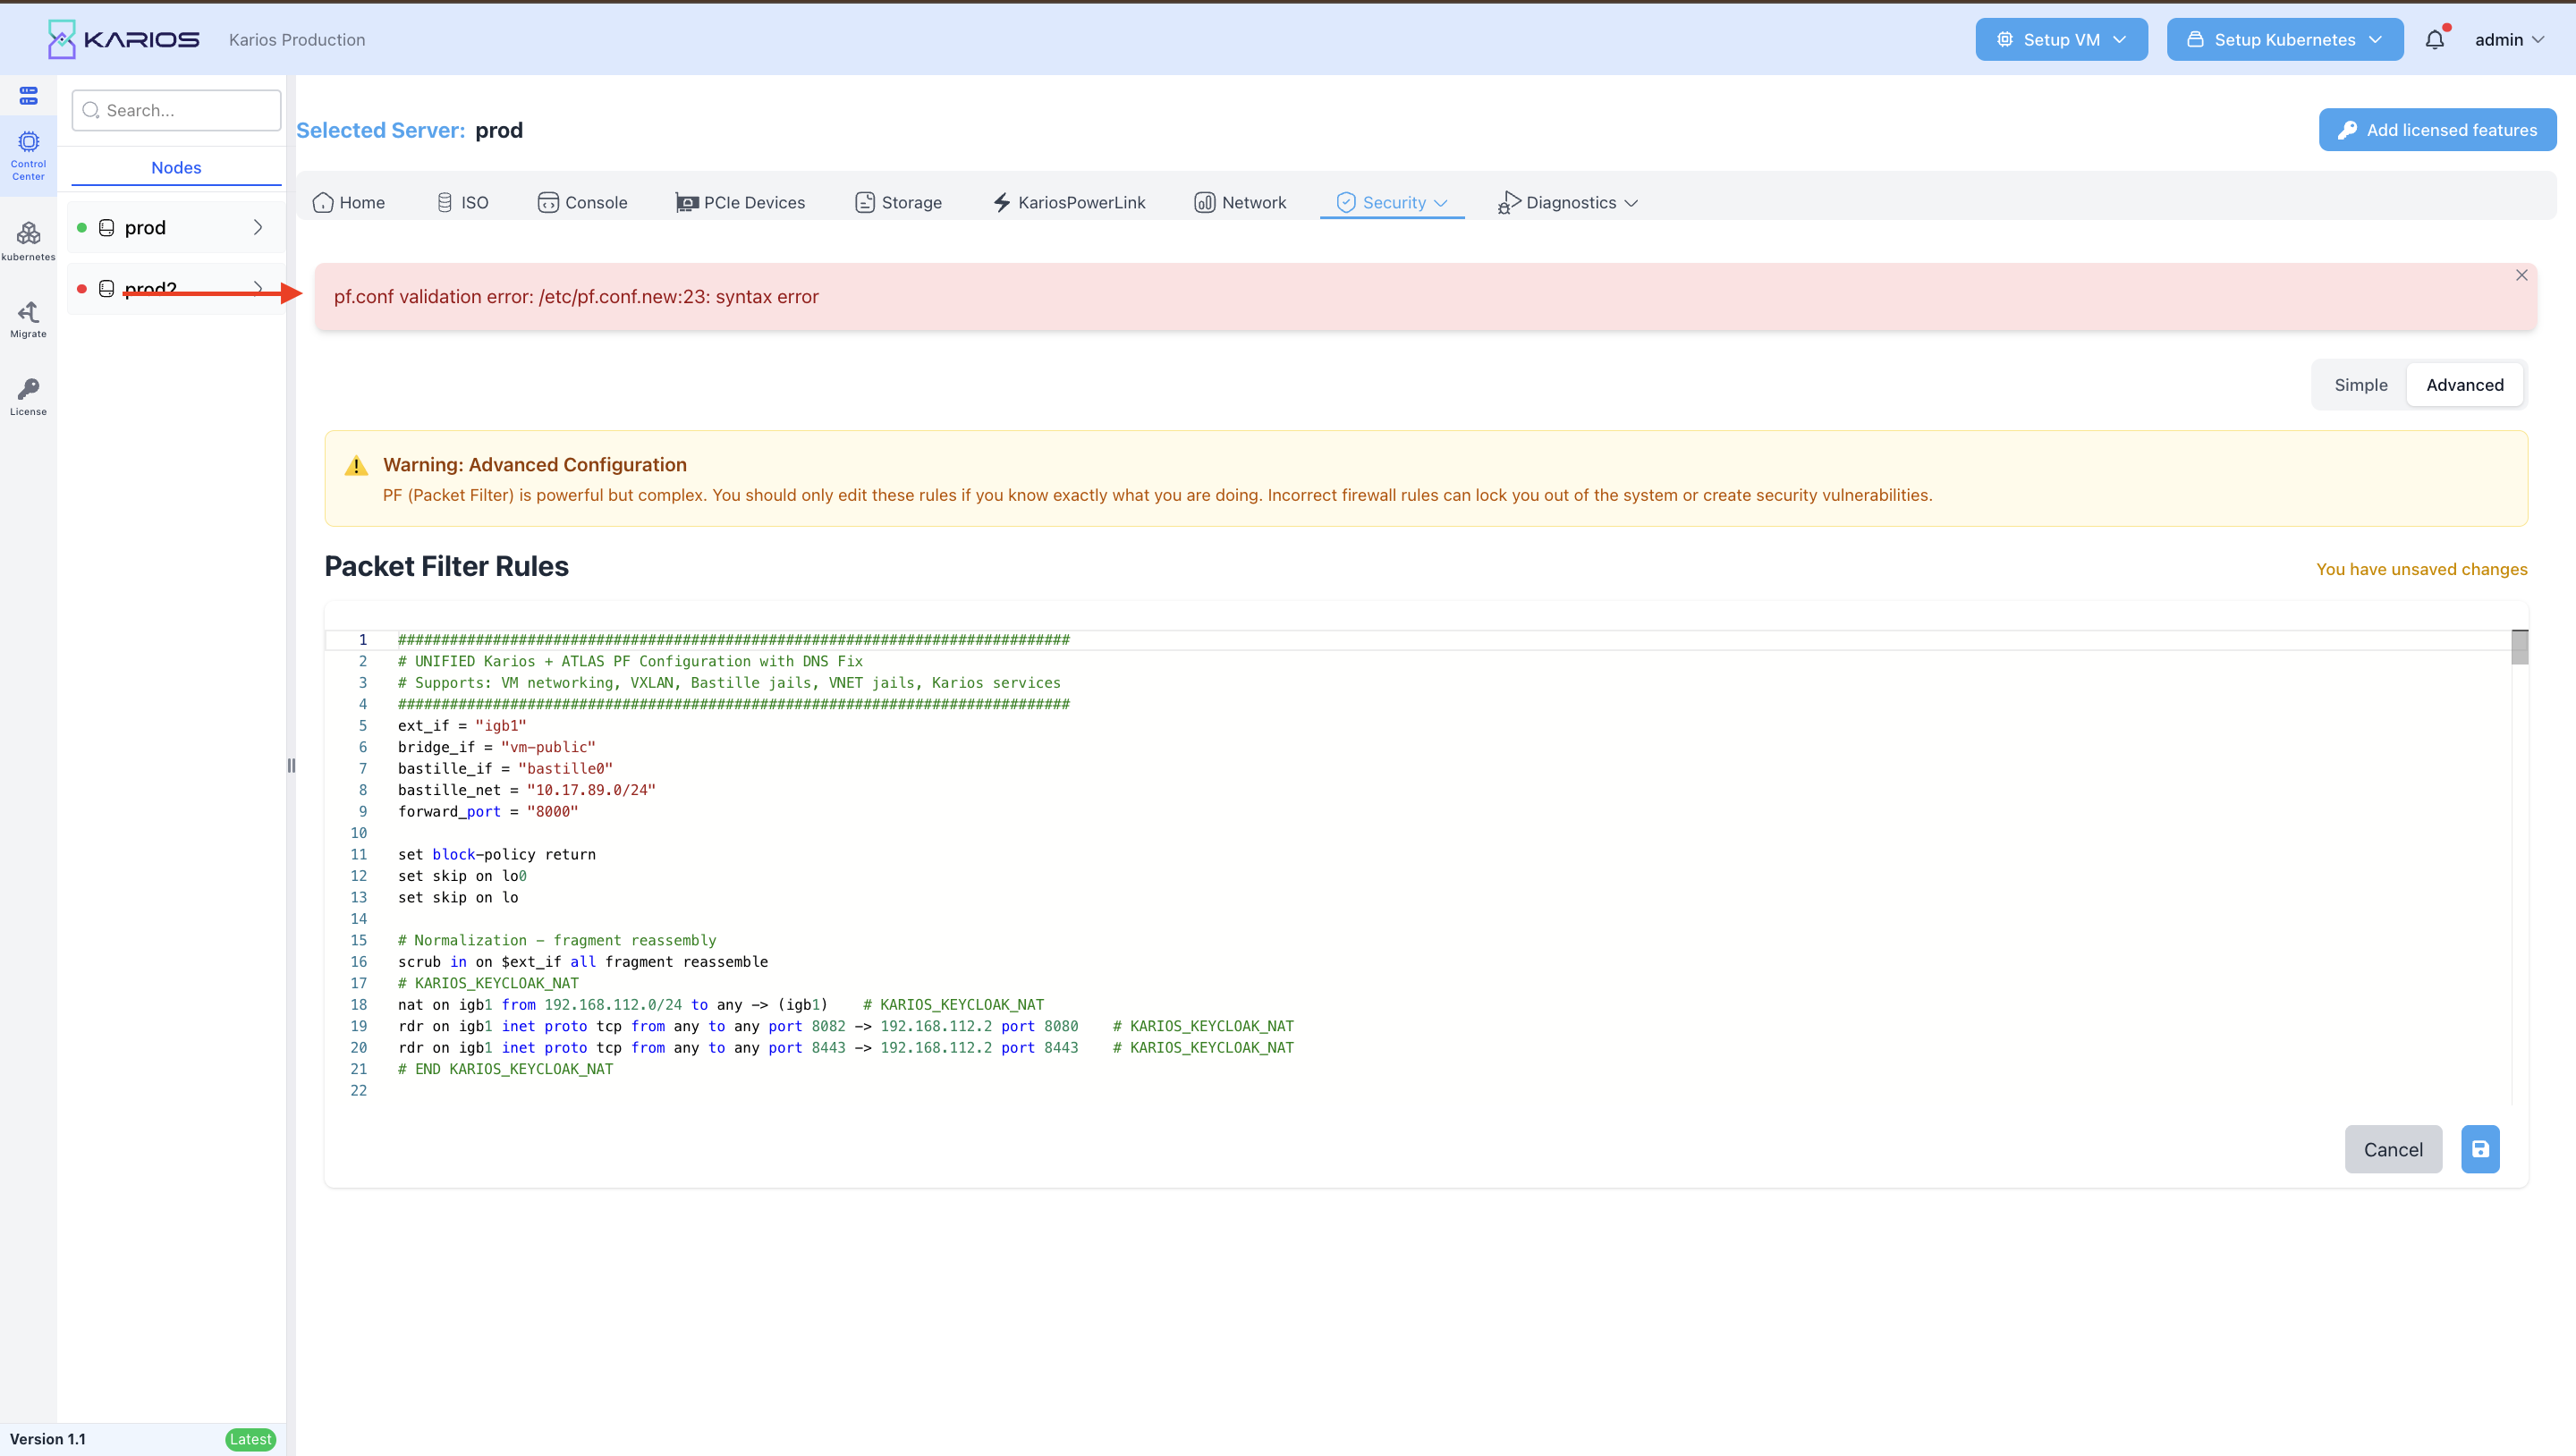
Change Tracking: Visual indication of modified rules and changes
Preview Mode: Rule validation before applying changes
Change Confirmation System Safety Mechanism:
The firewall system includes a comprehensive safety mechanism to prevent system lockout.
Confirmation Timer System:
60-Second Timer: Changes will revert in 60 seconds countdown display
Auto-Revert: Automatic reversion to previous configuration if not confirmed
Safety Window: 60-second window for testing and validation
Change Persistence: Manual confirmation required for permanent changes
Confirmation Process:
Rule Modification: Edit firewall rules using the code editor
Timer Activation: 60-second countdown timer begins automatically
Testing Period: Test connectivity and system access during timer period
Confirmation Action: Click “Confirm Changes” to make changes permanent
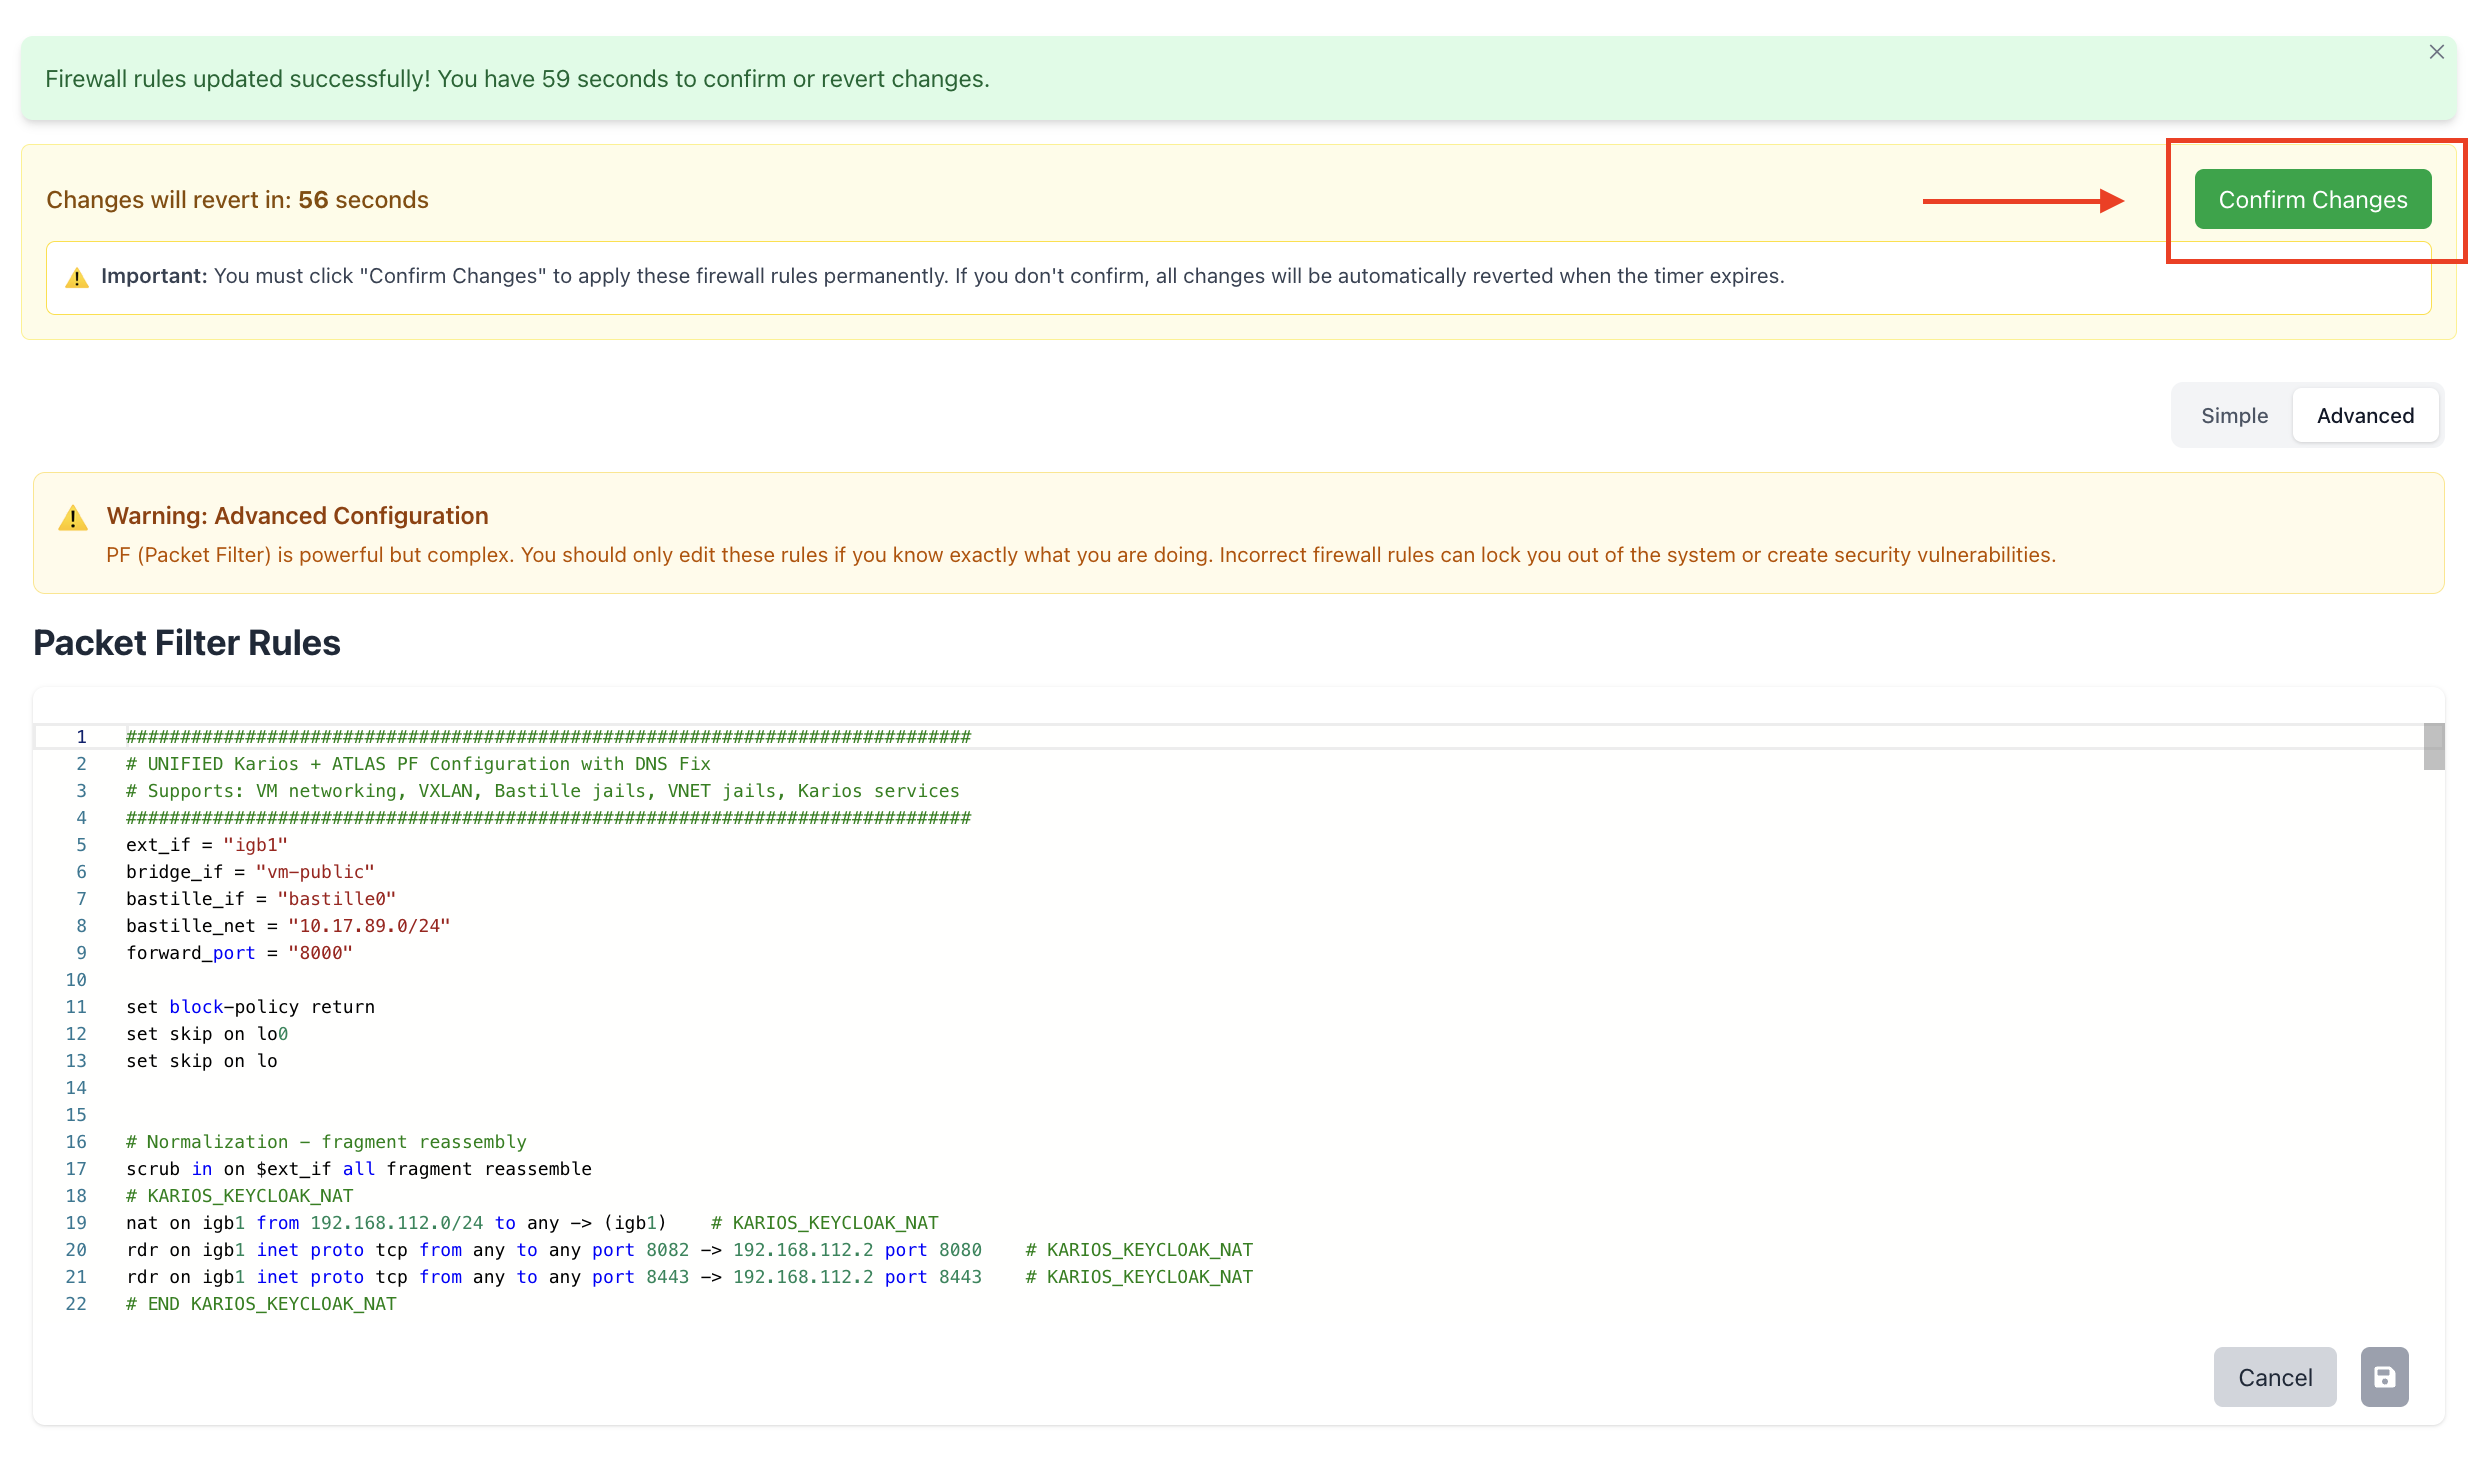
Safety Controls:
Cancel Option: Cancel button to abort changes before confirmation
Confirm Changes: Green “Confirm Changes” button for permanent application
Timer Display: Real-time countdown showing remaining confirmation time
Revert Warning: Clear indication of automatic reversion behavior
Node Log Management
Feature available under “Diagnostics” tab.
Log Overview: The Logs tab provides comprehensive system log monitoring and analysis for individual worker nodes, featuring real-time log streaming, filtering capabilities, and log export functionality for troubleshooting and system analysis.
Log Viewer Interface: The Log Viewer displays system logs in a structured format with filtering options, search capabilities, and export tools for efficient log management and analysis.
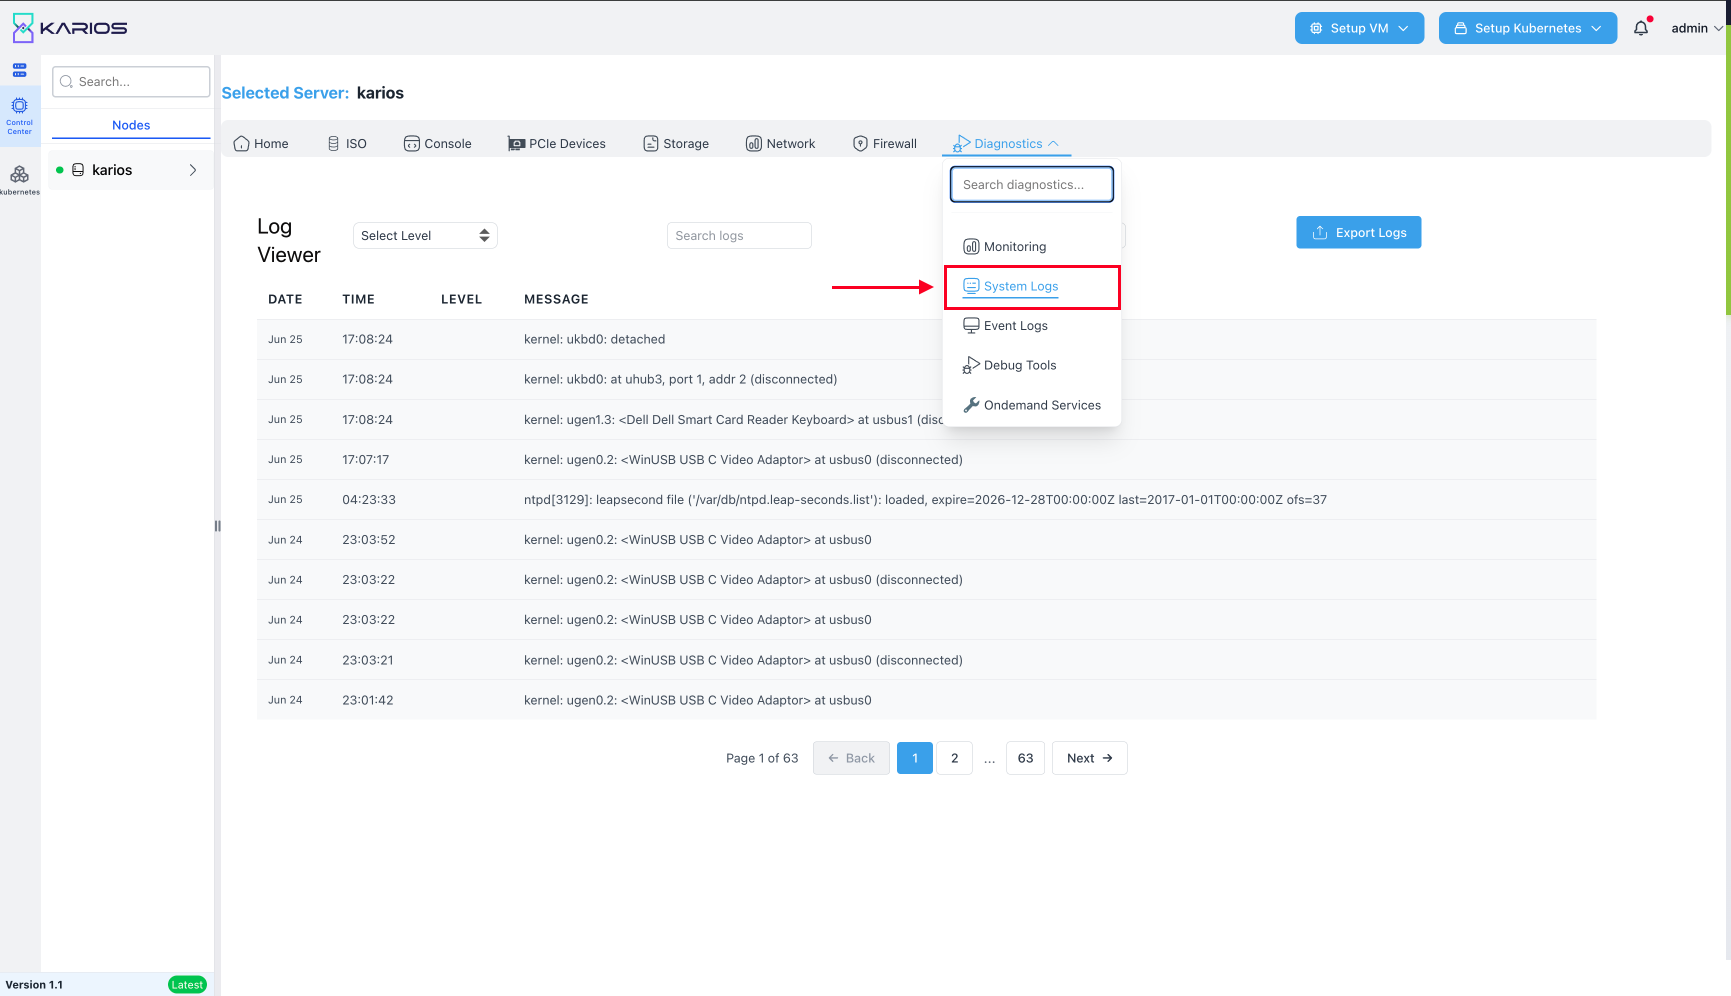
Log Viewer Dashboard
Log Display Interface: The Log Viewer provides a comprehensive log monitoring interface.
Log Table Structure:
Date Column: Log entry date display (Jul 17 format)
Time Column: Precise timestamp display (18:35:12 format)
Level Column: Log severity level classification
Message Column: Detailed log message content
Log Entry Examples:
System Messages: “syslogd: last message repeated 3 times”
Application Errors: “my_app[5139]: Failed to convert str to int”
Network Events: “dhclient[17655]: send_packet: No buffer space available”
Kernel Messages: “kernel: 310.534325 [4335] netmap_transmit vlan113 full hwcur 0 hwtail 0 qlen 1023”
Log Filtering and Search
Advanced Log Filtering: The Log Viewer provides comprehensive filtering and search capabilities.
Level Filtering:
Select Level Dropdown: Filter logs by severity level
Available Levels: Info, Error, Debug classification
Default Selection: “Select Level” for all log entries
Dynamic Filtering: Real-time log filtering based on selected level
Content Search:
Search Field: “Search logs” text input for content filtering
Real-time Search: Live filtering of log entries based on search terms
Message Content: Search through log message content
Flexible Matching: Partial and full text search capabilities

Log Export and Management
Log Export Functionality: The Log Viewer provides log export capabilities:
Export Options:
Export Logs Button: Blue “Export Logs” button for log data export
Data Format: Structured log data export capabilities
Historical Data: Export of filtered or complete log datasets
Log Management Features:
Real-time Updates: Live log streaming and real-time updates
Historical Access: Access to historical log entries
Filtering Export: Export filtered log data based on search criteria
Batch Processing: Efficient handling of large log volumes
FreeBSD Debug Framework
Overview
The FreeBSD Debug Framework provides comprehensive system diagnostic capabilities through both REST API and command-line interfaces. This unified framework enables administrators to collect, analyze, and export system diagnostics from FreeBSD environments efficiently.
The framework enables you to:
Run system diagnostic tools
Collect their outputs in organized directories
Generate and download consolidated PDF reports
Manage outputs automatically with cleanup policies
Access diagnostics through both API and CLI interfaces
This simplifies debugging workflows by providing consistent interfaces for system analysis and reporting.
Key Features
System Integration
Run System Tools: Execute FreeBSD diagnostic tools (
fstat,vmstat,ktrace,tcpdump)Parameterized Execution: Supply parameters like interface, PID, command, interval, or count
Batch Execution: Run all tools simultaneously with tool-specific parameters
Process Discovery: Retrieve running processes to identify PIDs for tracing tools
Output Management
Organized Storage: Tool outputs saved in timestamped directories
PDF Report Generation: Consolidate results into comprehensive reports
Automatic Cleanup: Results older than 24 hours deleted hourly
File Management: Automatic cleanup of temporary trace files
Documentation and Usability
Interactive API Documentation: Swagger UI available at
/swagger/CLI Menu System: User-friendly command-line interface with searchable tool selection
Error Handling: Robust timeout and error management
Extensible Architecture: Easy addition of new diagnostic tools
Command-Line Interface
The FreeBSD Debugging Framework CLI provides an interactive menu-driven interface for system diagnostics.
Starting the CLI
Execute the debugging framework:
./freebsd-debug
Interactive Menu System
The CLI presents a main menu with the following options:
FreeBSD Performance Debug Framework
==================================
? Choose an option:  [Run Tool, Run All Tools, Generate PDF Report, Exit]
Menu Options
This feature is available under “Diagnostics” tab.
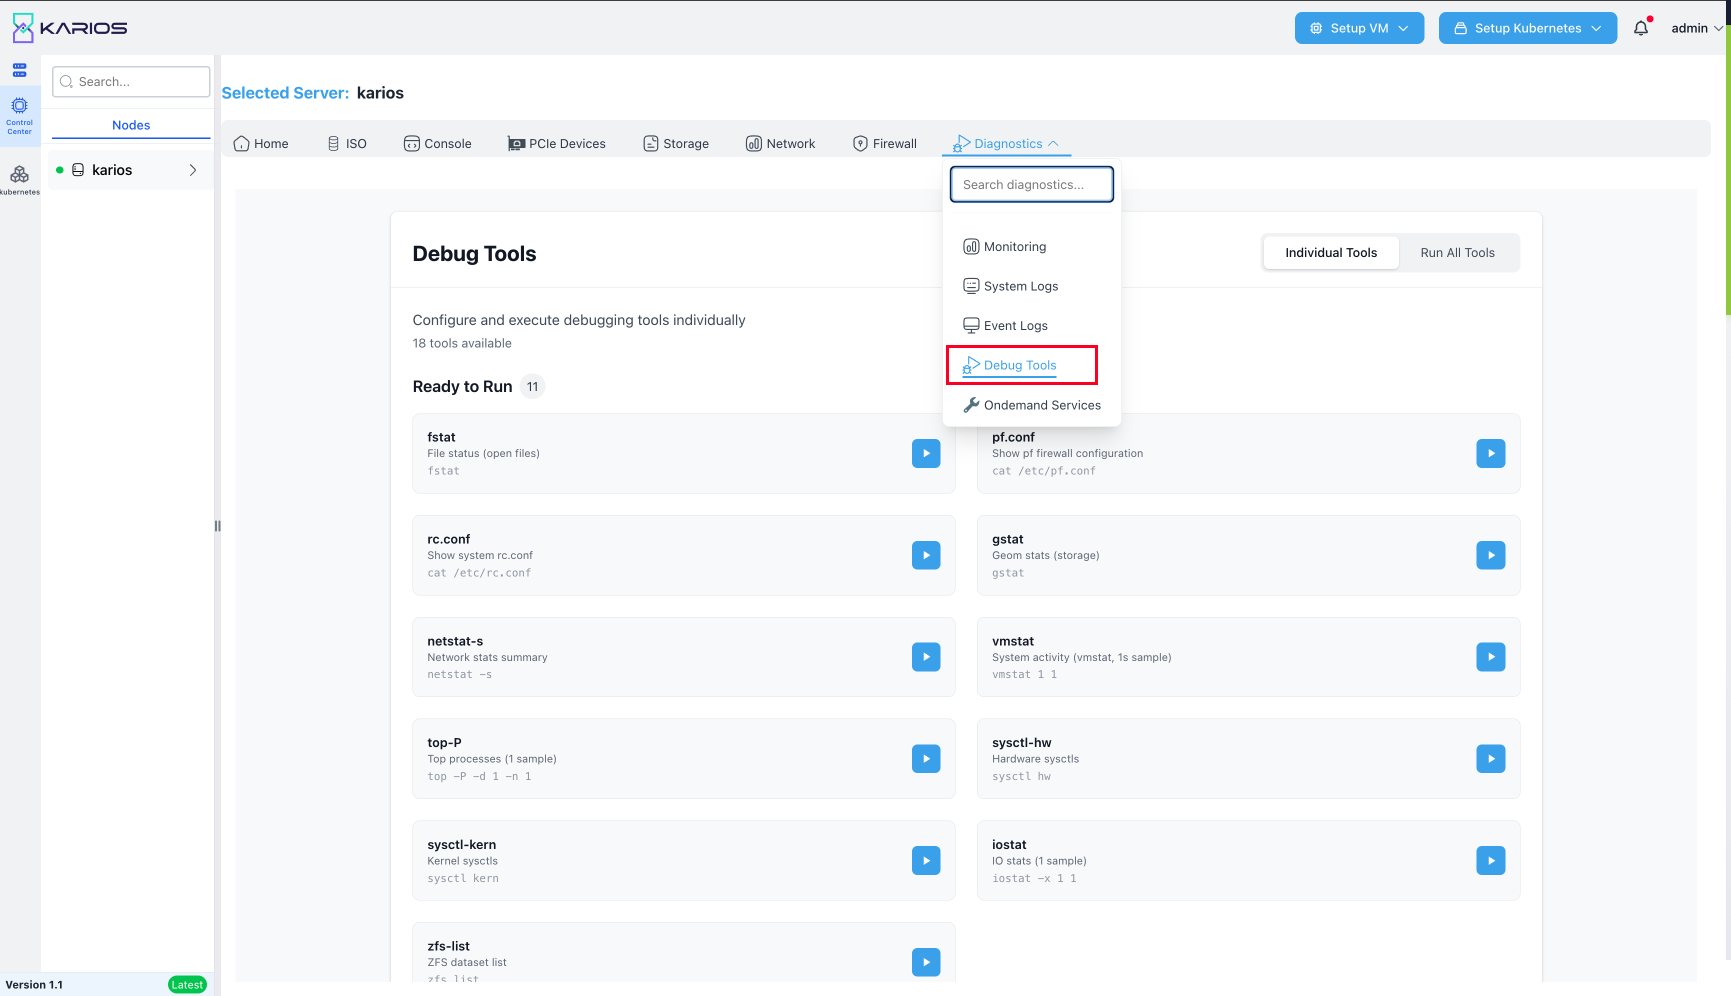
- Run Tool
Select and execute a single diagnostic tool with interactive parameter input.
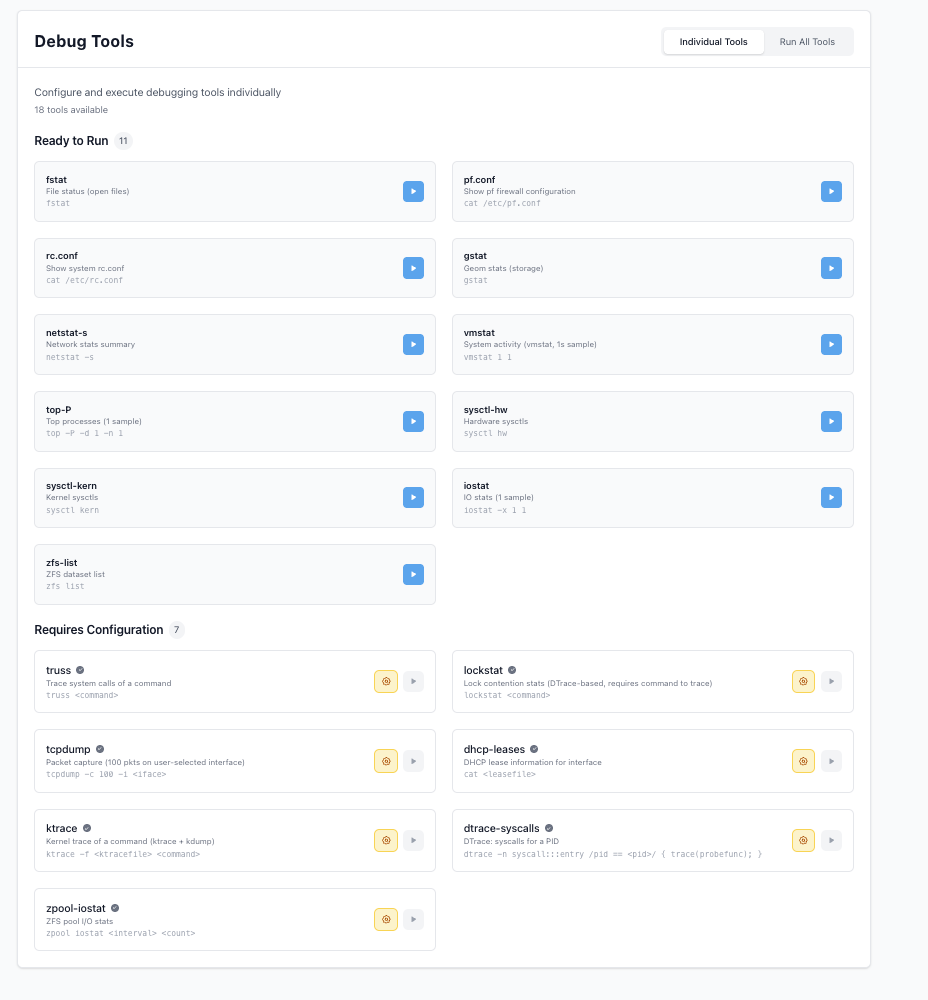
- Run All Tools
Execute all supported diagnostic tools sequentially with default or prompted parameters.
- Prerequisites
Configure all the required parameters for each tool to execute all tools successfully. Click on “Execute All” to run all the tools sequentially.
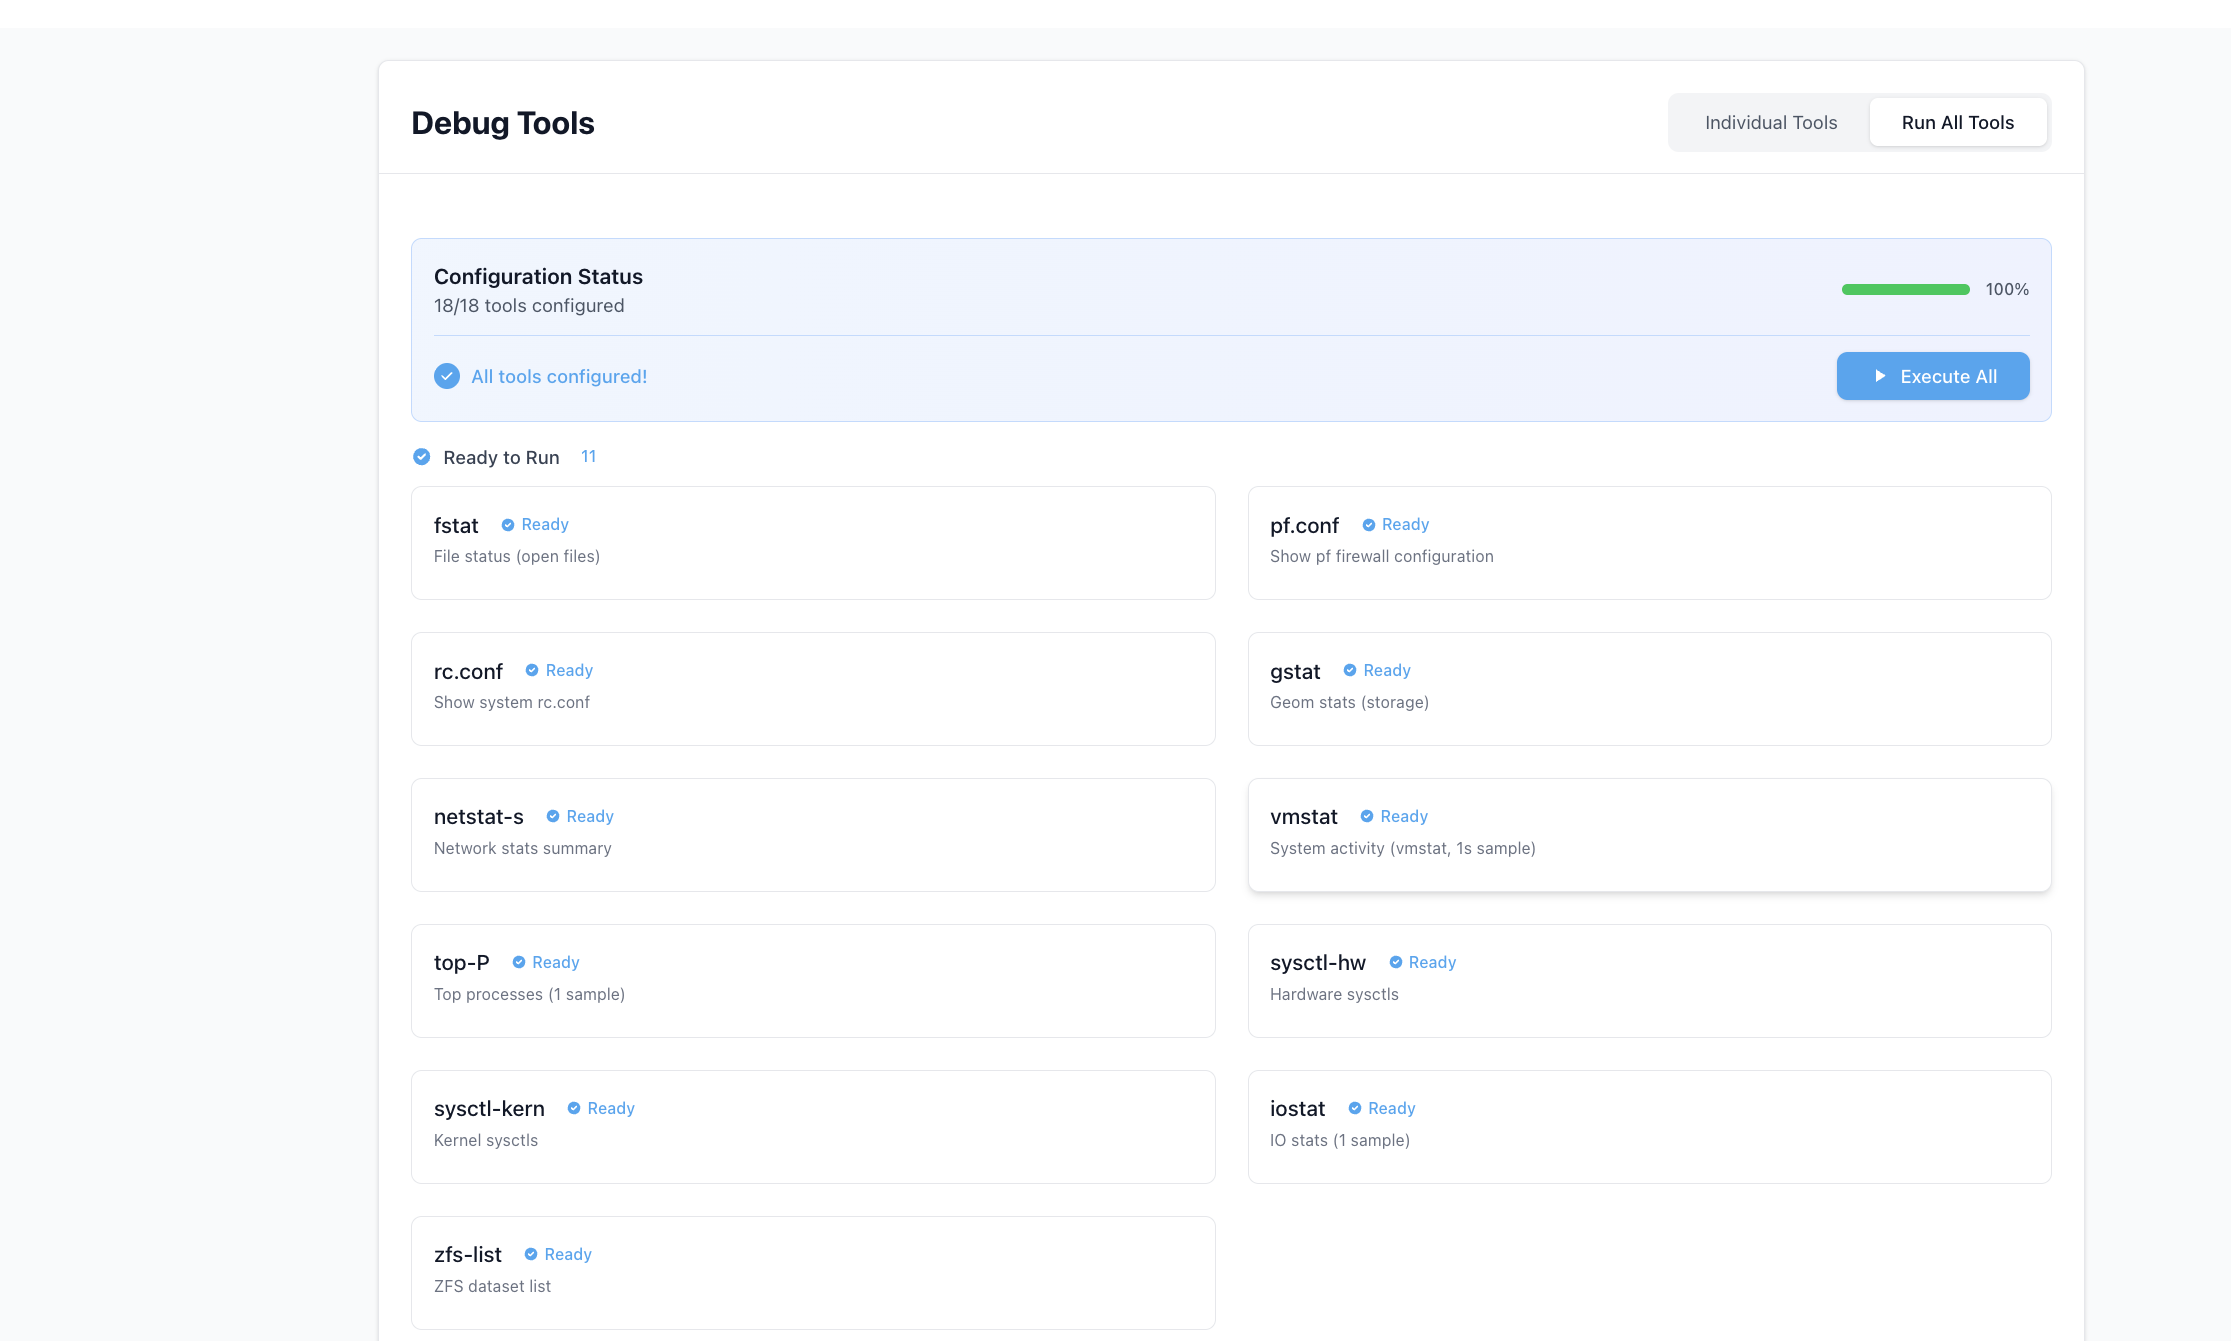
- Generate PDF Report
Create a consolidated PDF report from previously collected diagnostic outputs.
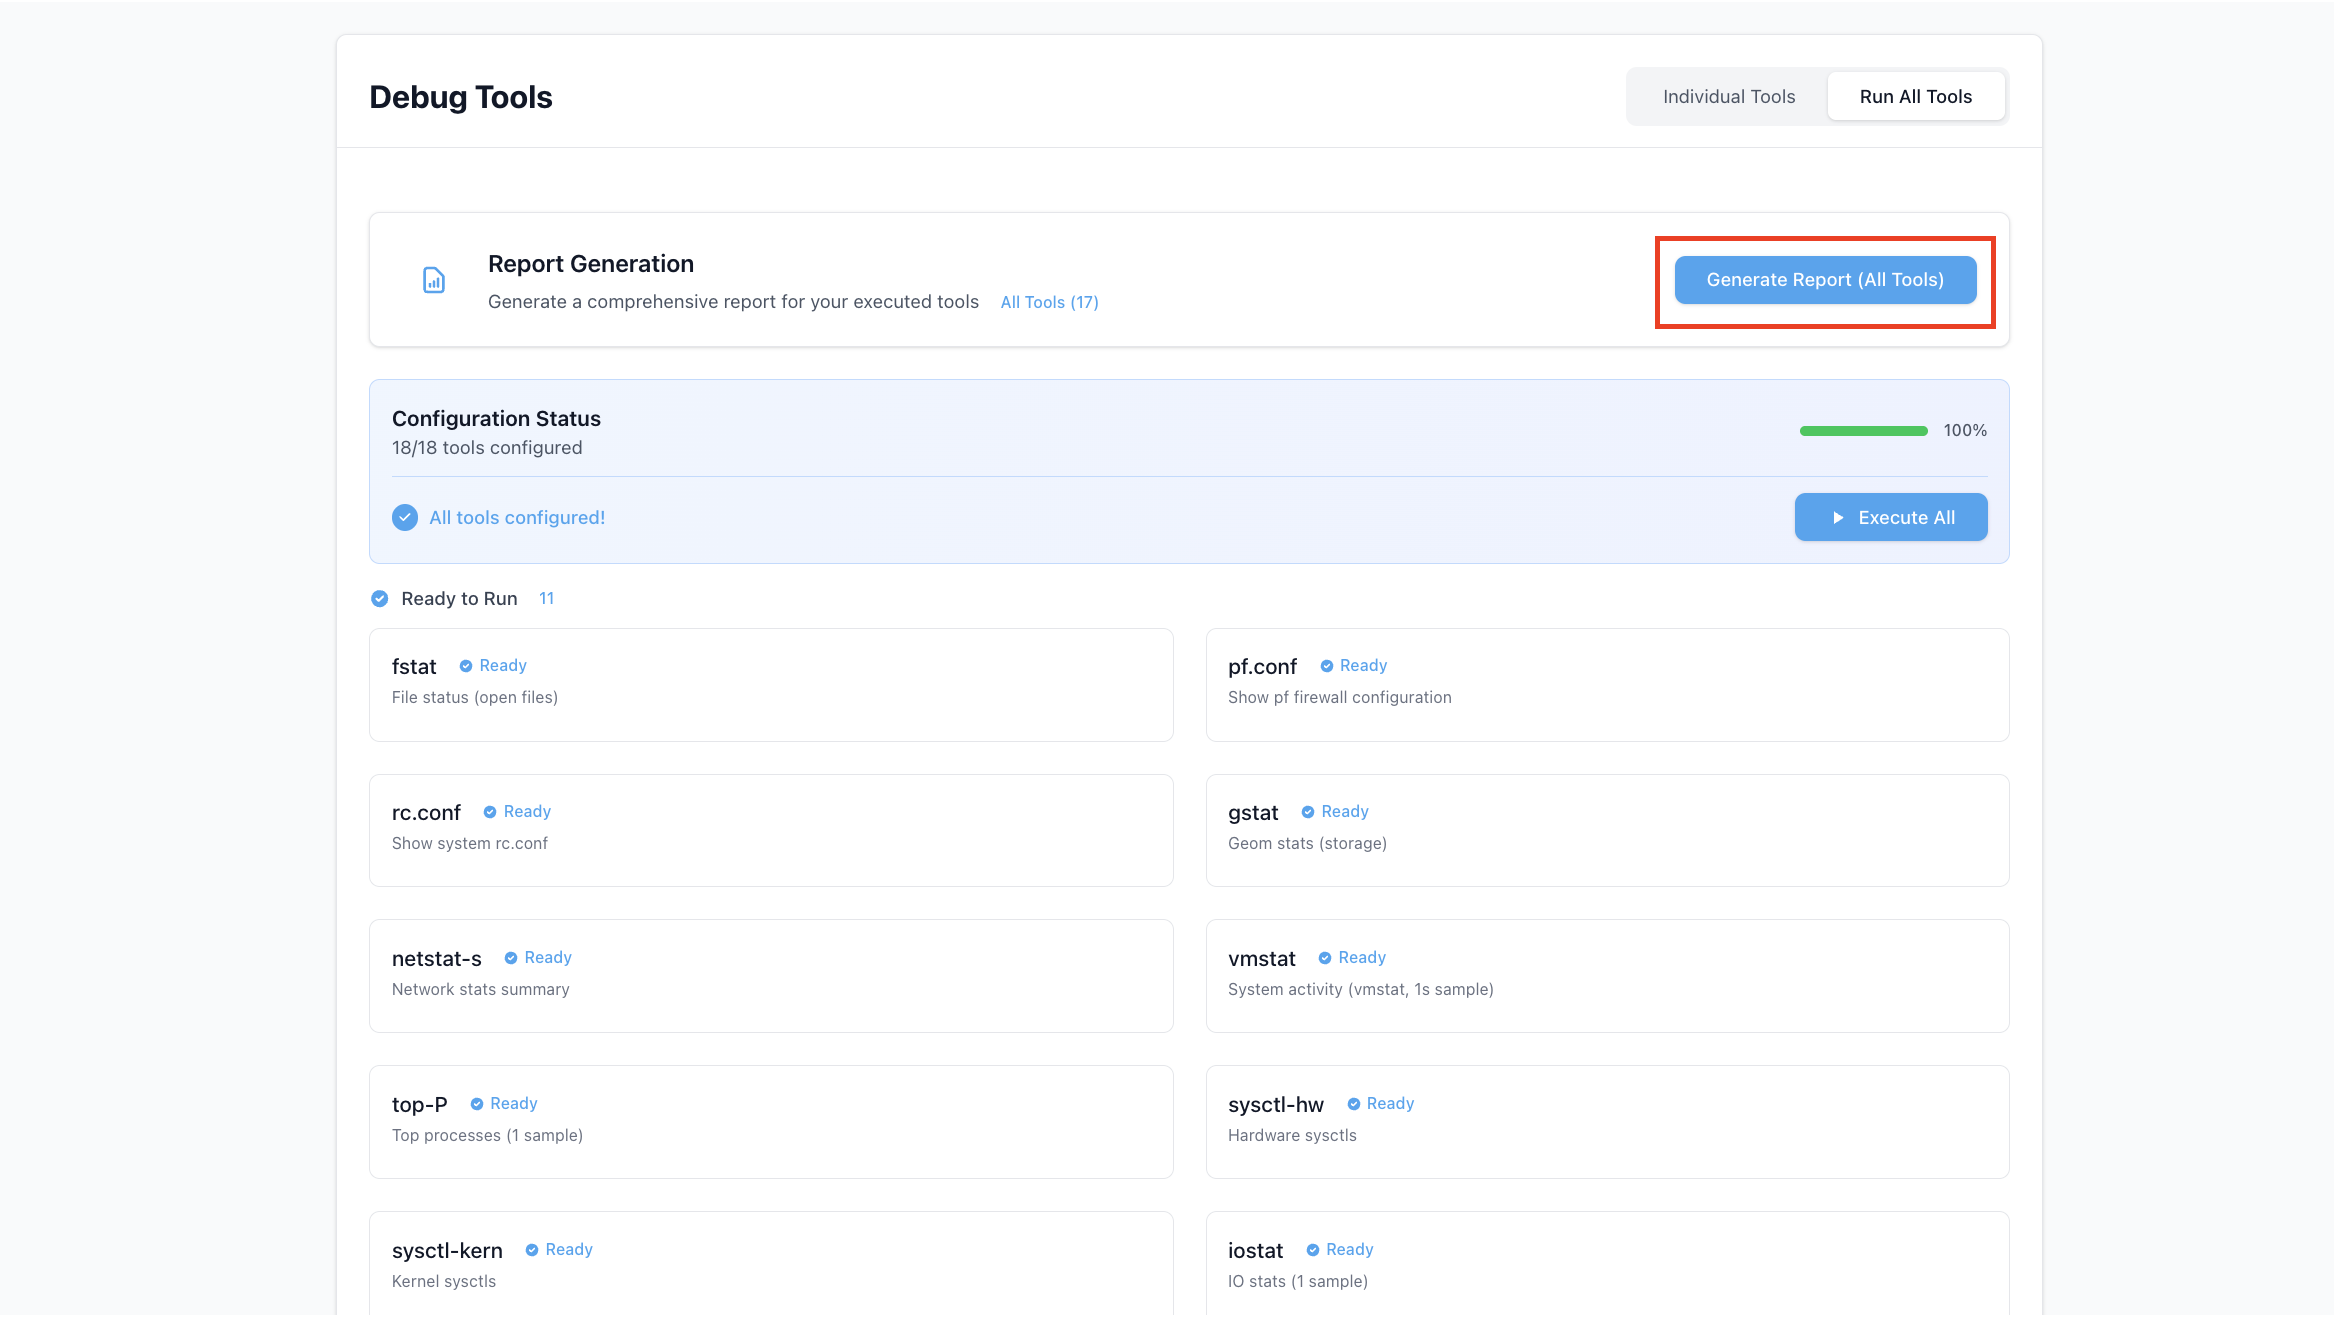
- Exit
Terminate the debugging framework.
CLI Features
Tool Selection
Searchable Interface: Use
promptuifor intuitive tool selectionTool Descriptions: Each tool includes descriptive information
Parameter Prompting: Interactive input for required tool parameters
Output Organization
Timestamped Directories: Results stored in
/tmp/freebsd-debug/<timestamp>/Individual Files: Each tool’s output saved in separate text files
PDF Reports: Generated in the same directory with system information and clickable table of contents
Error Handling
Command Timeouts: Prevent infinite hangs (10 second default timeout)
Graceful Errors: Errors displayed without crashing the application
Automatic Cleanup: Raw trace files automatically removed after processing
Example CLI Workflow
Complete diagnostic collection and reporting workflow:
Start the Framework:
./freebsd-debug
Execute All Tools:
Select “Run All Tools” from the menu:
> Run All Tools
Running fstat...
Running netstat-s...
Running tcpdump...
...
Outputs saved in: /tmp/freebsd-debug/2025-09-19T12-45-30Z/
Generate PDF Report:
Select “Generate PDF Report”:
> Generate PDF Report
Report generated: /tmp/freebsd-debug/2025-09-19T12-45-30Z/report-2025-09-19T12-45-30Z.pdf
Access Results:
Navigate to the output directory:
cd /tmp/freebsd-debug/2025-09-19T12-45-30Z/
ls -la
Diagnostic Tools
The framework includes a comprehensive set of FreeBSD diagnostic tools:
System Information
Tool |
Purpose |
Key Parameters |
|---|---|---|
|
File descriptor usage |
Process ID, user |
|
Virtual memory statistics |
Interval, count |
|
I/O statistics |
Interval, count, devices |
Network Diagnostics
Tool |
Purpose |
Key Parameters |
|---|---|---|
|
Network connections and statistics |
Protocol, interface |
|
Network packet capture |
Interface, filter, count |
|
Socket information |
Protocol, process |
Process and Kernel Analysis
Tool |
Purpose |
Key Parameters |
|---|---|---|
|
Kernel call tracing |
Command, process ID, trace type |
|
Process information |
Format options, sorting |
|
Real-time process monitoring |
Update interval, process count |
Storage Analysis
Tool |
Purpose |
Key Parameters |
|---|---|---|
|
ZFS pool I/O statistics |
Pool name, interval, count |
|
ZFS filesystem information |
Dataset types, properties |
|
GEOM storage statistics |
Interval, batch mode |
Output Management
Directory Structure
All diagnostic outputs are organized in timestamped directories:
/tmp/freebsd-debug/
├── 2025-09-19T12-45-30Z/
│   ├── fstat-output.txt
│   ├── netstat-output.txt
│   ├── tcpdump-output.txt
│   ├── ktrace-output.txt
│   └── report-2025-09-19T12-45-30Z.pdf
└── 2025-09-19T14-20-15Z/
    └── ...
PDF Report Structure
Generated PDF reports include:
- System Information Section
Hardware configuration
Kernel version and build information
Memory configuration
Network interface details
- Table of Contents
Clickable links to each diagnostic section
Tool execution timestamps
Output file references
- Diagnostic Outputs
Individual sections for each executed tool
Formatted command outputs
Error messages and warnings
- Appendices
Raw data files location
Tool parameter summaries
System state at collection time
Automatic Cleanup
The framework implements automatic cleanup policies:
Retention Period: 24 hours for diagnostic outputs
Cleanup Frequency: Hourly cleanup process
Cleanup Scope: Complete directory removal including PDF reports
Protection: Active diagnostic sessions protected from cleanup
Warning
Diagnostic outputs are automatically deleted after 24 hours. Archive important reports before the retention period expires.
Configuration and Extensibility
Customizing Output Locations
Default output directory can be configured:
export FREEBSD_DEBUG_DIR="/var/log/diagnostics"
PDF Report Customization
Report generation supports customization:
Custom Headers: Organization branding and contact information
Section Filtering: Include/exclude specific diagnostic outputs
Format Options: Page layout and styling preferences
Common Issues
Permission Errors
Some diagnostic tools require elevated privileges:
# Run as root or with sudo
sudo ./freebsd-debug
Alternatively, configure appropriate permissions for specific tools.
Tool Timeouts
Increase timeout values for long-running diagnostics:
export FREEBSD_DEBUG_TIMEOUT=60
Network Interface Issues
Verify interface names before using network diagnostic tools:
ifconfig -a
Storage Access Problems
Ensure ZFS pools are accessible for storage diagnostics:
zpool status
API Connection Issues
Verify API service status and network connectivity:
curl -X GET http://localhost:8080/api/v1/debug/tools
Log Analysis
Check system logs for diagnostic framework errors:
tail -f /var/log/messages
journalctl -f -u freebsd-debug
Performance Considerations
Resource Usage
CPU Impact: Diagnostic tools may consume significant CPU resources
Disk Space: Large diagnostic outputs require adequate storage
Network Bandwidth: Network capture tools generate substantial data
Memory Usage: PDF generation requires additional memory
Optimization Strategies
Selective Execution: Run only required diagnostic tools
Parameter Tuning: Adjust collection intervals and durations
Scheduled Collection: Use cron for off-peak diagnostic collection
Storage Management: Implement custom cleanup policies for long-term retention
Best Practices
Diagnostic Collection
Baseline Establishment: Collect diagnostics during normal operation
Problem Reproduction: Capture diagnostics during issue occurrence
Comprehensive Coverage: Use “Run All Tools” for unknown issues
Targeted Analysis: Select specific tools for known problem areas
Report Management
Immediate Analysis: Review reports promptly due to 24-hour retention
Archive Important Data: Save critical diagnostics to permanent storage
Documentation: Include problem descriptions with diagnostic reports
Sharing: Use PDF reports for collaboration with support teams
Data Handling Considerations
Sensitive Data: Review outputs for confidential information before sharing
Access Control: Restrict access to diagnostic framework and outputs
Network Captures: Be cautious with tcpdump outputs containing sensitive traffic
Process Information: Process lists may reveal sensitive application details
See also
- FreeBSD Documentation
- Diagnostic Tools Documentation
man fstat- File descriptor diagnosticsman tcpdump- Network packet captureman ktrace- Kernel tracing utility
Support Bundle Collection Instructions
The support bundle tool collects system logs and diagnostic information, encrypts them, and packages them into a .7z archive for analysis by the support team.
When to Use
Run this tool when requested by support for:
Troubleshooting system issues
Diagnostic analysis
System health evaluation
Performance problem investigation
Collection Process
How to Generate a Support Bundle from UI
Navigate to Support Bundle
Click on “Ondemand Services” tab under “Diagnostics” and select “Support Bundle”.
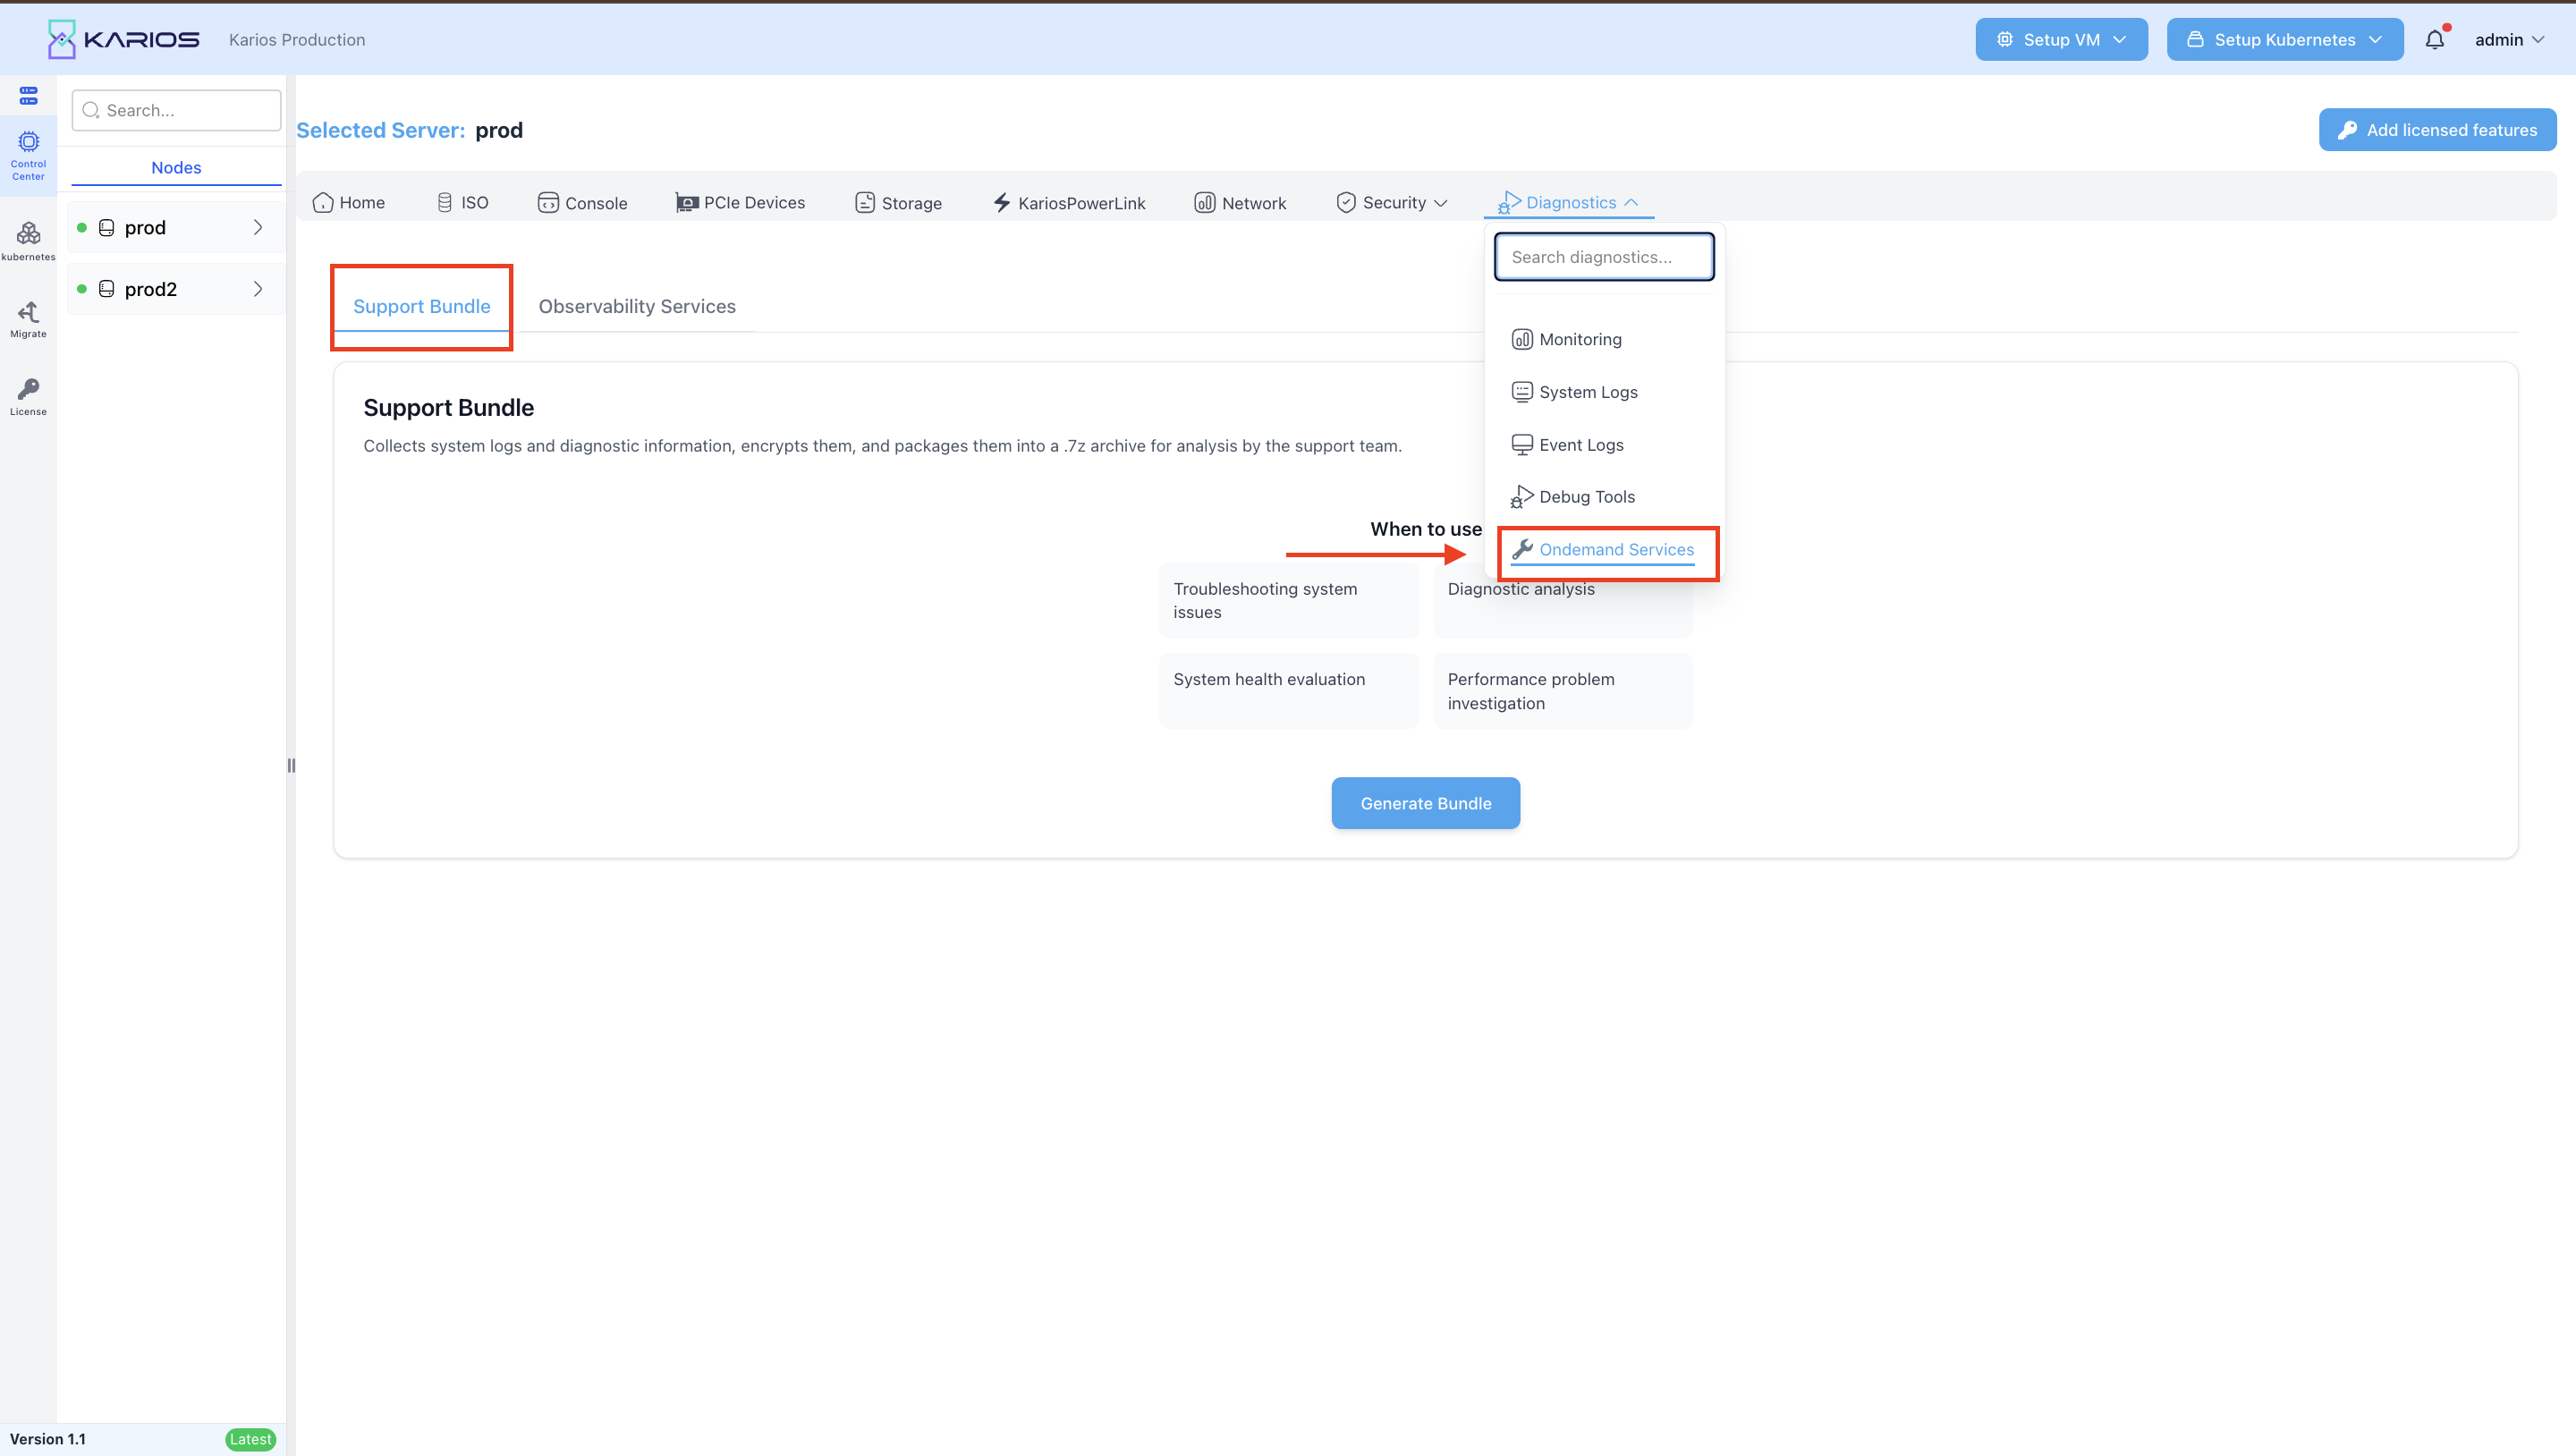
Review the Information
Read the description: “Collects system logs and diagnostic information, encrypts them, and packages them into a .7z archive for analysis by the support team”
Check the “When to use” scenarios to confirm this matches your needs:
Troubleshooting system issues
Diagnostic analysis
System health evaluation
Performance problem investigation
Generate the Bundle
Click the blue “Generate Bundle” button
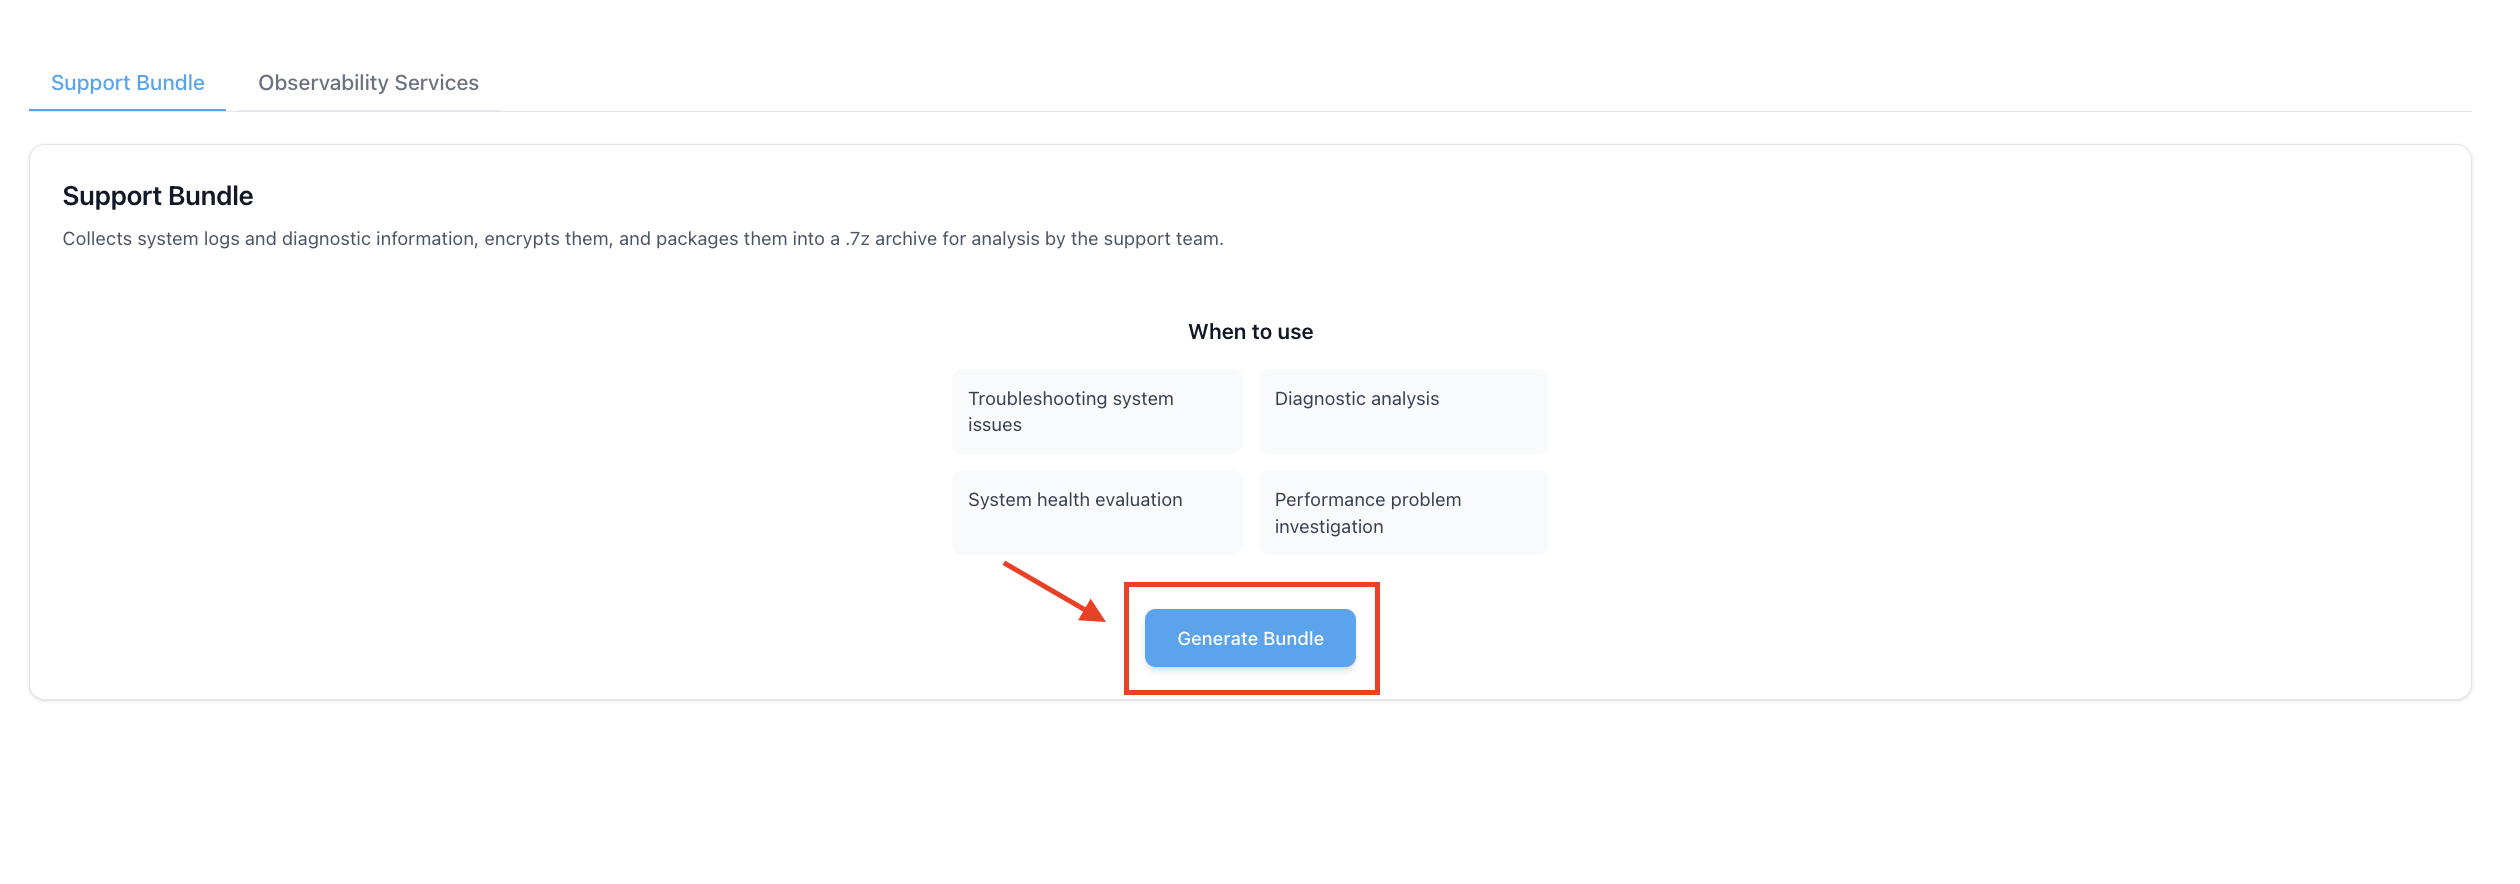
Wait for Processing
The system will collect logs and diagnostic data
Package everything into an encrypted .7z archive
This may take a few minutes depending on system size
Download the Bundle
Once complete, download the generated .7z file
This encrypted archive can be shared with the support team for analysis
Generate Support Bundle via Command Line
Connect to the Console
Use SSH or direct console access to log in to your FreeBSD machine.
ssh admin@your-freebsd-machine
Tip
Ensure you have administrative privileges before proceeding with support bundle collection.
Navigate to the Tool Location
Change directory to where the support_bundle binary is placed:
cd /path/to/support_bundle
Note
Replace /path/to/support_bundle with the actual installation path on your system.
Run the Support Bundle Tool
Execute the tool:
./support_bundle
When prompted, enter a password to encrypt the archive.
Important
Remember this password—you will need to share it with support for archive decryption.
Warning
Choose a strong password for the archive encryption. This password protects sensitive system information during transmission.
Verify the Archive
After completion, check that the archive was created:
ls -l support_bundle.7z
Expected output should show the created archive file with its size and timestamp.
Share the Archive
Send the support_bundle.7z file and the password to the support team via the provided support email for further analysis.
Email Template
Use the following template when submitting your support bundle:
Subject Line:
Subject: Support Bundle for Analysis
Email Body:
Attached is the support_bundle.7z file collected from our FreeBSD system.
Password for the archive: [your password]

Please let us know if you need further information.
Handling the Support Bundle
- Password Protection
The archive is encrypted to protect sensitive system information during transmission
- Secure Transmission
Only send the support bundle through official support channels
- Password Sharing
Share the archive password through a separate, secure communication channel when possible
- Data Contents
The bundle may contain sensitive system logs and configuration information
Troubleshooting Collection Issues
- Permission Denied
Ensure you have execute permissions on the support_bundle binary:
chmod +x support_bundle
- Binary Not Found
Verify the correct path to the support_bundle tool:
find / -name "support_bundle" -type f 2>/dev/null
- Insufficient Disk Space
Check available disk space before running the tool:
df -hNote
The support bundle may require significant temporary disk space during collection and compression.
- Collection Timeout
If the collection process appears to hang:
Wait for completion (large systems may take several minutes)
Check system load with
toporhtopVerify no other intensive processes are running
Archive Information
- File Format
The output file uses 7-Zip compression format (
.7z) for optimal compression ratio- Contents
The archive typically includes:
System logs (
/var/log/*)Configuration files (sanitized)
Hardware information
Network configuration
Process information
Performance metrics
- Encryption
AES-256 encryption protects the archive contents during transmission
Tip
The support bundle tool automatically excludes sensitive files like private keys and passwords from the collection process.
Virtual Machine Management
VM Creation Overview
The “Setup VM” button provides access to virtual machine creation with two distinct deployment methods:
Standard VM Setup: Traditional virtual machine configuration for FreeBSD, Windows 10, and Ubuntu
Cloud-Init Setup: Automated VM deployment with cloud-init support for FreeBSD and Ubuntu
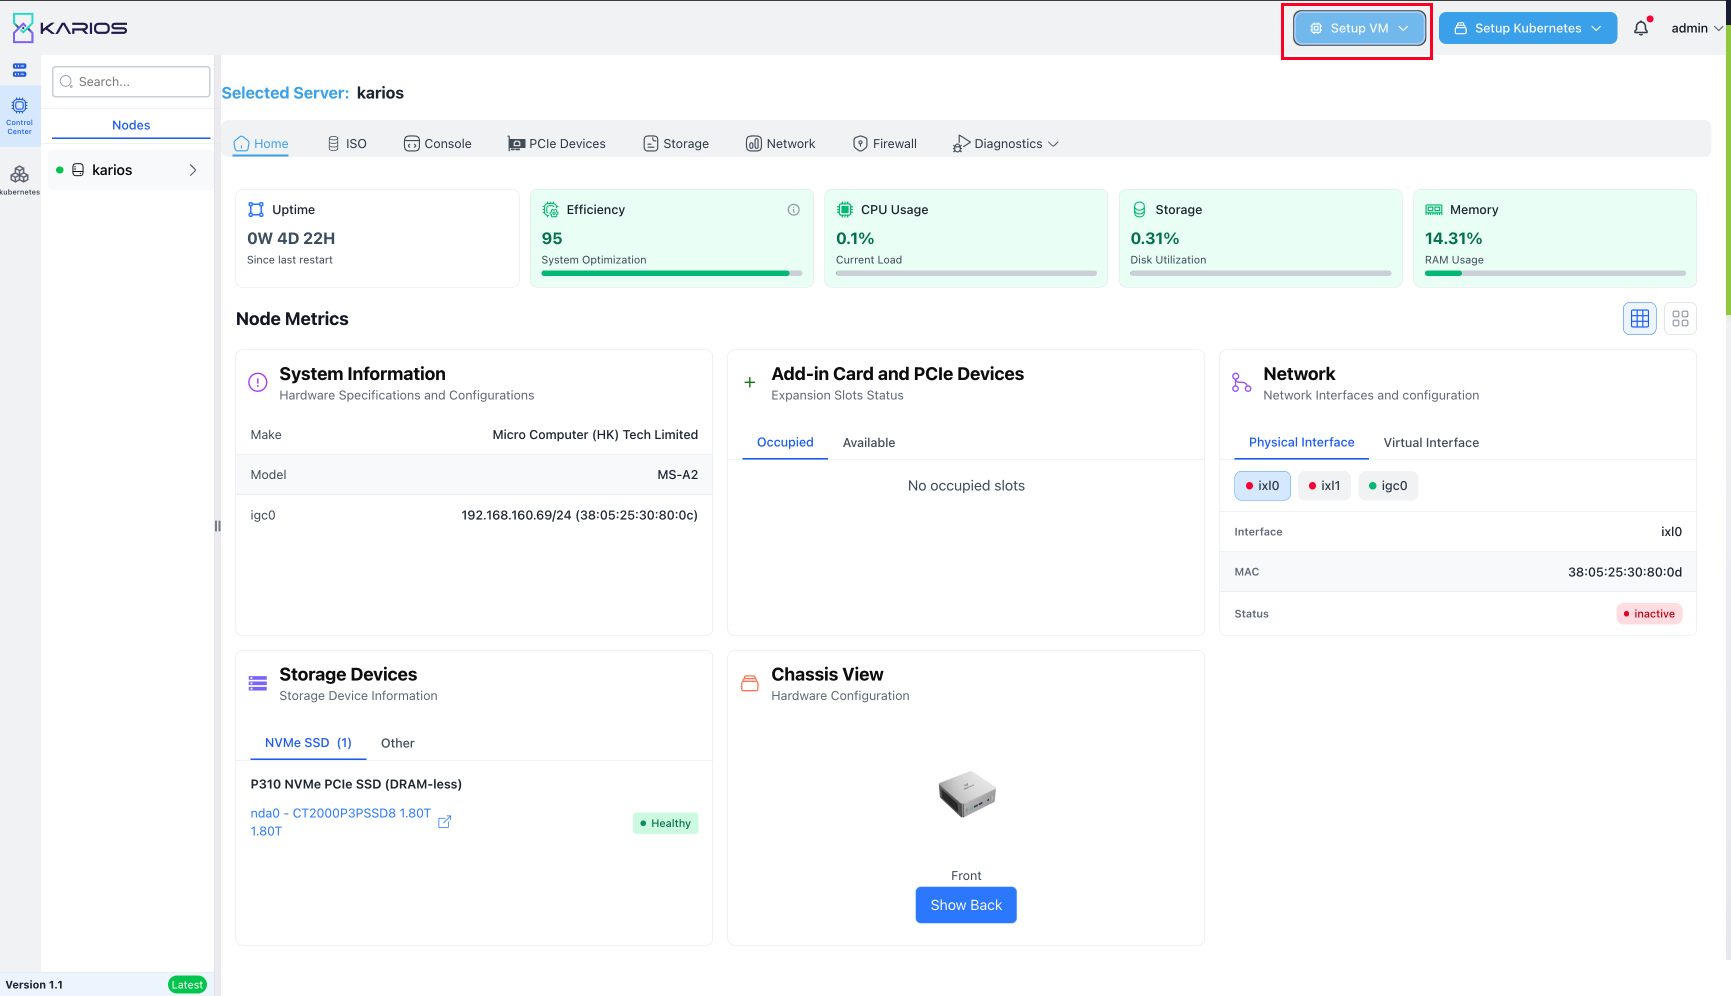
Note
Please setup the technitium DHCP and DNS server before proceeding with the vm installation. Refer to Technitium DHCP and DNS Setup documentation for detailed instructions.
Standard VM Setup
VM Configuration Process
Setup Method Selection: Choose “Standard VM Setup” from the available options
Server Selection: Select the target server from available configured servers
Basic Configuration: Configure fundamental VM parameters
Resource Allocation: Set CPU, memory, and storage resources
Network Configuration: Configure network connectivity
DNS Zone Configuration: The domain under which this VM’s hostname will be created.
VM Creation: Finalize and create the virtual machine
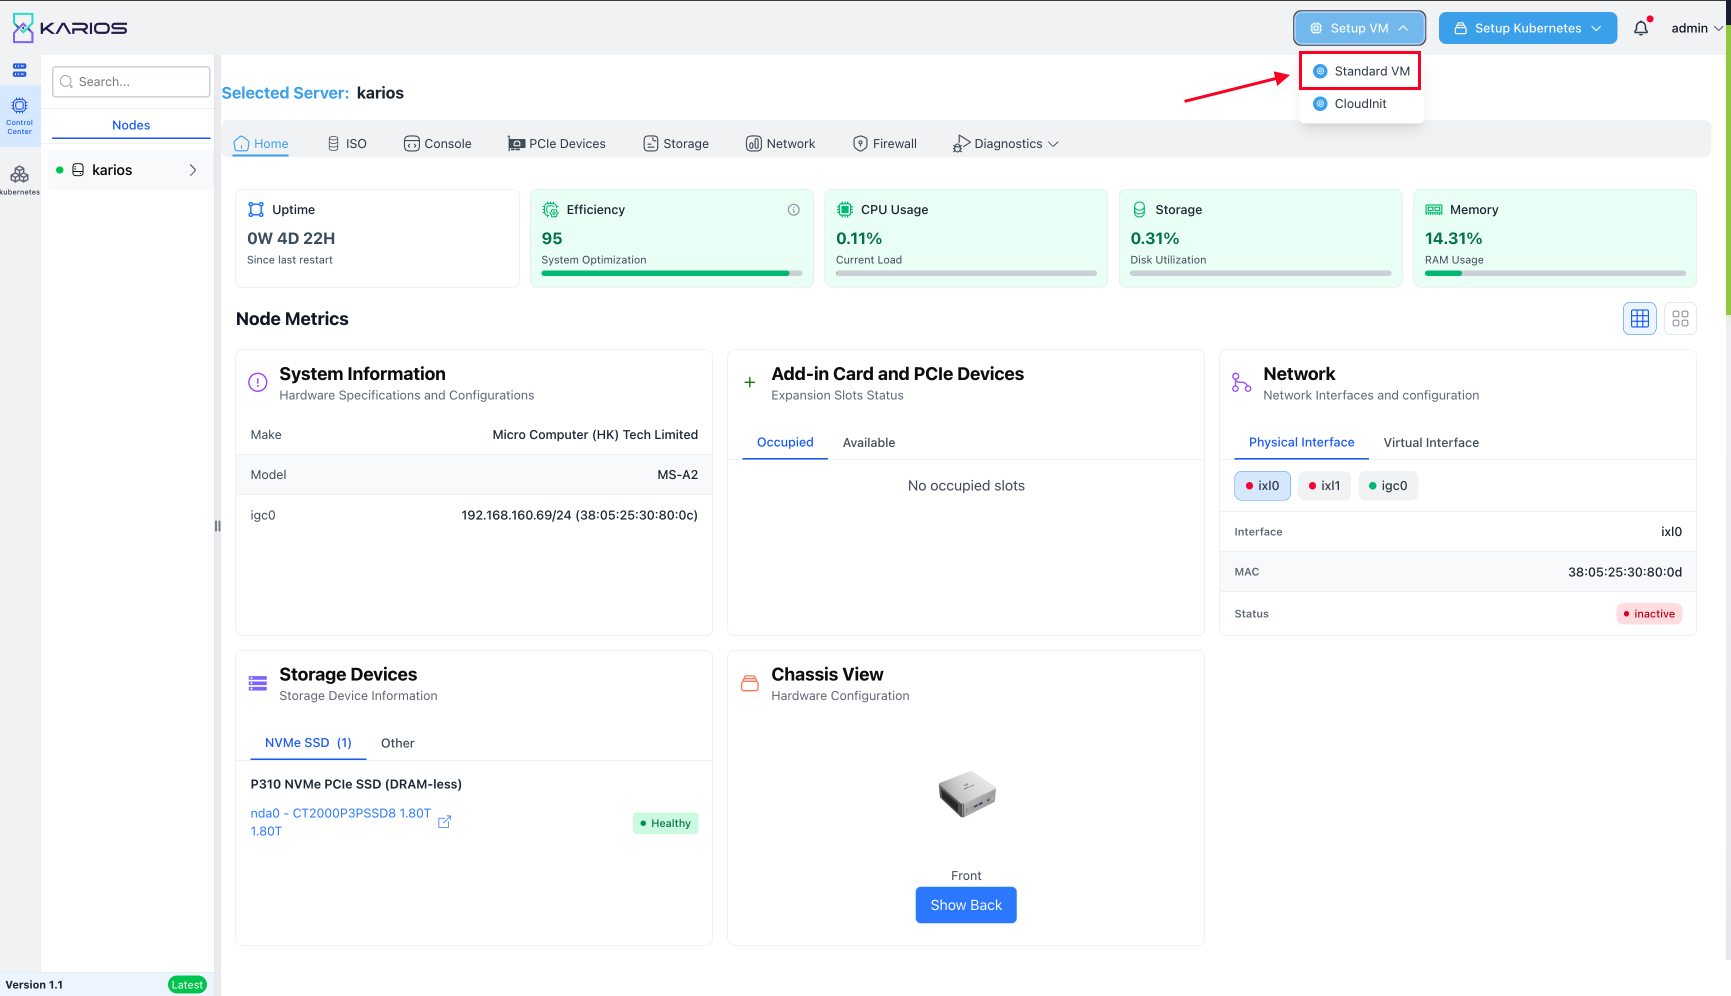
Basic VM Configuration
VM Name: Specify a unique name for the virtual machine
Loader Configuration: Select the appropriate boot loader for the operating system
Operating System: Choose from supported OS options (FreeBSD, Windows 10, Ubuntu Linux)
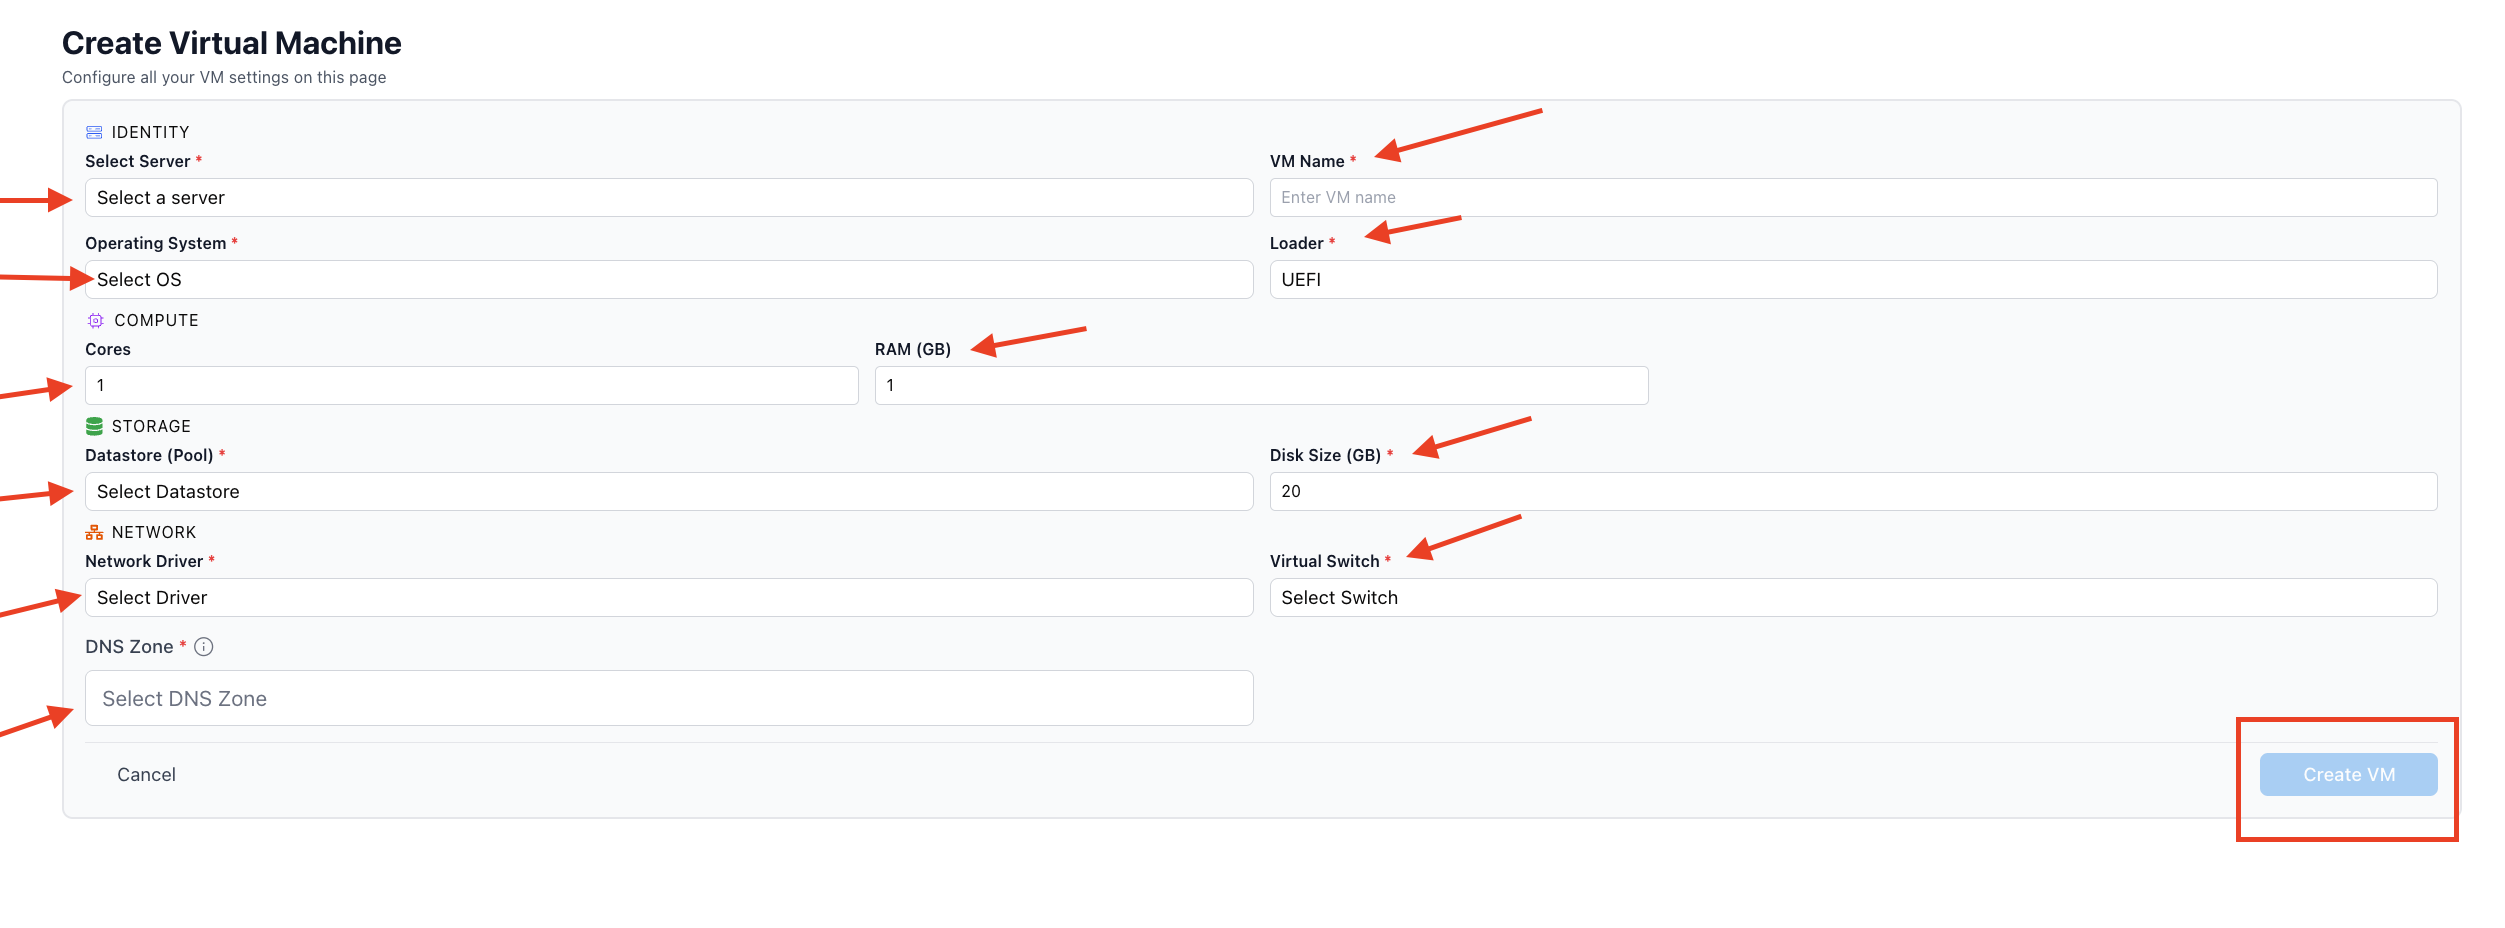
Resource Allocation
Configure virtual machine resources based on requirements:
CPU Cores: Select number of CPU cores from available range
Memory: Allocate RAM from available server memory
Storage Configuration
Storage Pool: Select from available storage pools
Disk Size: Specify virtual disk size based on requirements
Network Configuration
Network Switch: Select virtual network switch
Network Driver: Choose network driver type for optimal performance
Network Adapter: Configure virtual network adapter settings
Windows Virtual Machine Installation Guide
Prerequisites
Important
KARIOS currently supports Windows 10 only.
Before proceeding with the installation, ensure you have:
Windows 10 ISO file - Downloaded from Microsoft or uploaded to the system
VirtIO drivers - Required for optimal performance and hardware compatibility
Installation Steps
Step 1: Prerequisites & ISO Management: Configure installation media and drivers
Windows ISO Selection: Choose your uploaded Windows 10 ISO file or download from Microsoft
VirtIO Drivers: Select or upload the VirtIO driver package
Installation Method: Choose between:
Upload existing ISO files
Download Windows 10 directly from Microsoft
Validation: System verifies ISO compatibility and driver availability
Step 2: VM Details: Configure basic virtual machine settings
Server: Select target server (e.g., DEL-R10-Z7-PHX-0998)
VM Name: Enter descriptive name for the virtual machine
Loader: Set to UEFI (required for Windows 10)
Operating System: Automatically set to Windows 10
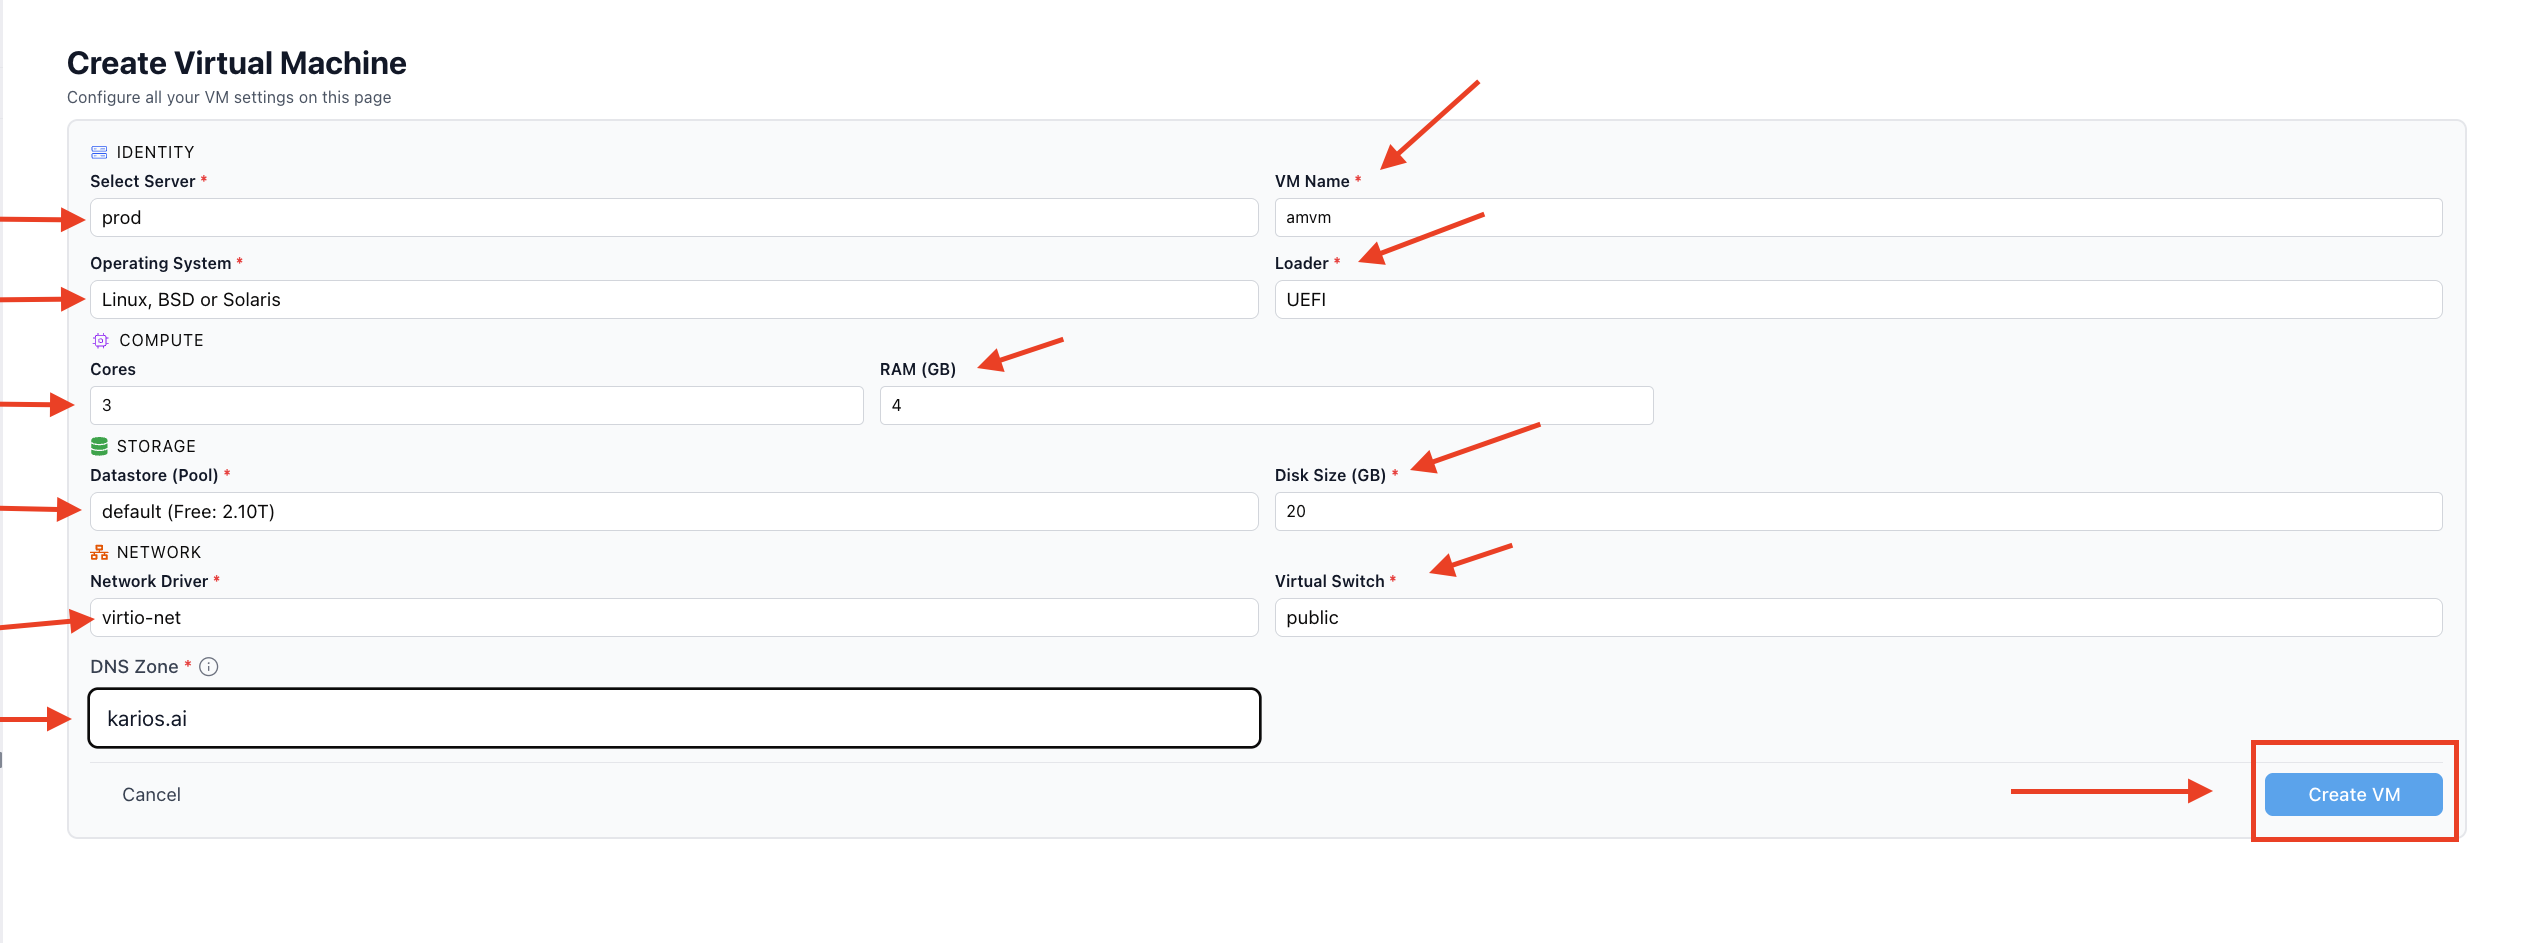
Figure: Windows VM Basic Configuration
Step 3: Hardware Configuration: Allocate CPU and memory resources
CPU Sockets: Configure based on available resources
CPU Cores: Assign processor cores (minimum 2 recommended)
Memory (RAM): Allocate system memory (minimum 4GB for Windows 10)
Resource Validation: System checks available resources against allocation
Step 4: Storage Configuration: Configure virtual disk settings
ZPool: Select storage pool with adequate free space
Disk Size: Set virtual disk size (minimum 20GB for Windows 10)
Storage Type: Automatically optimized for Windows workloads
Performance: VirtIO storage drivers for enhanced I/O performance
Step 5: Network Configuration: Setup network connectivity
Network Driver: Select virtio-net for optimal performance
Virtual Switch: Choose appropriate network segment
Network Profile: Configure based on intended use case
Step 6: Zone Configuration: Setup DNS zone for VM hostname
DNS Zone Selection: Choose existing DNS zone or create new
Step 6: Review & Installation: Finalize and Access VM
Attach Drive: Attach Windows 10 ISO as mentioned below
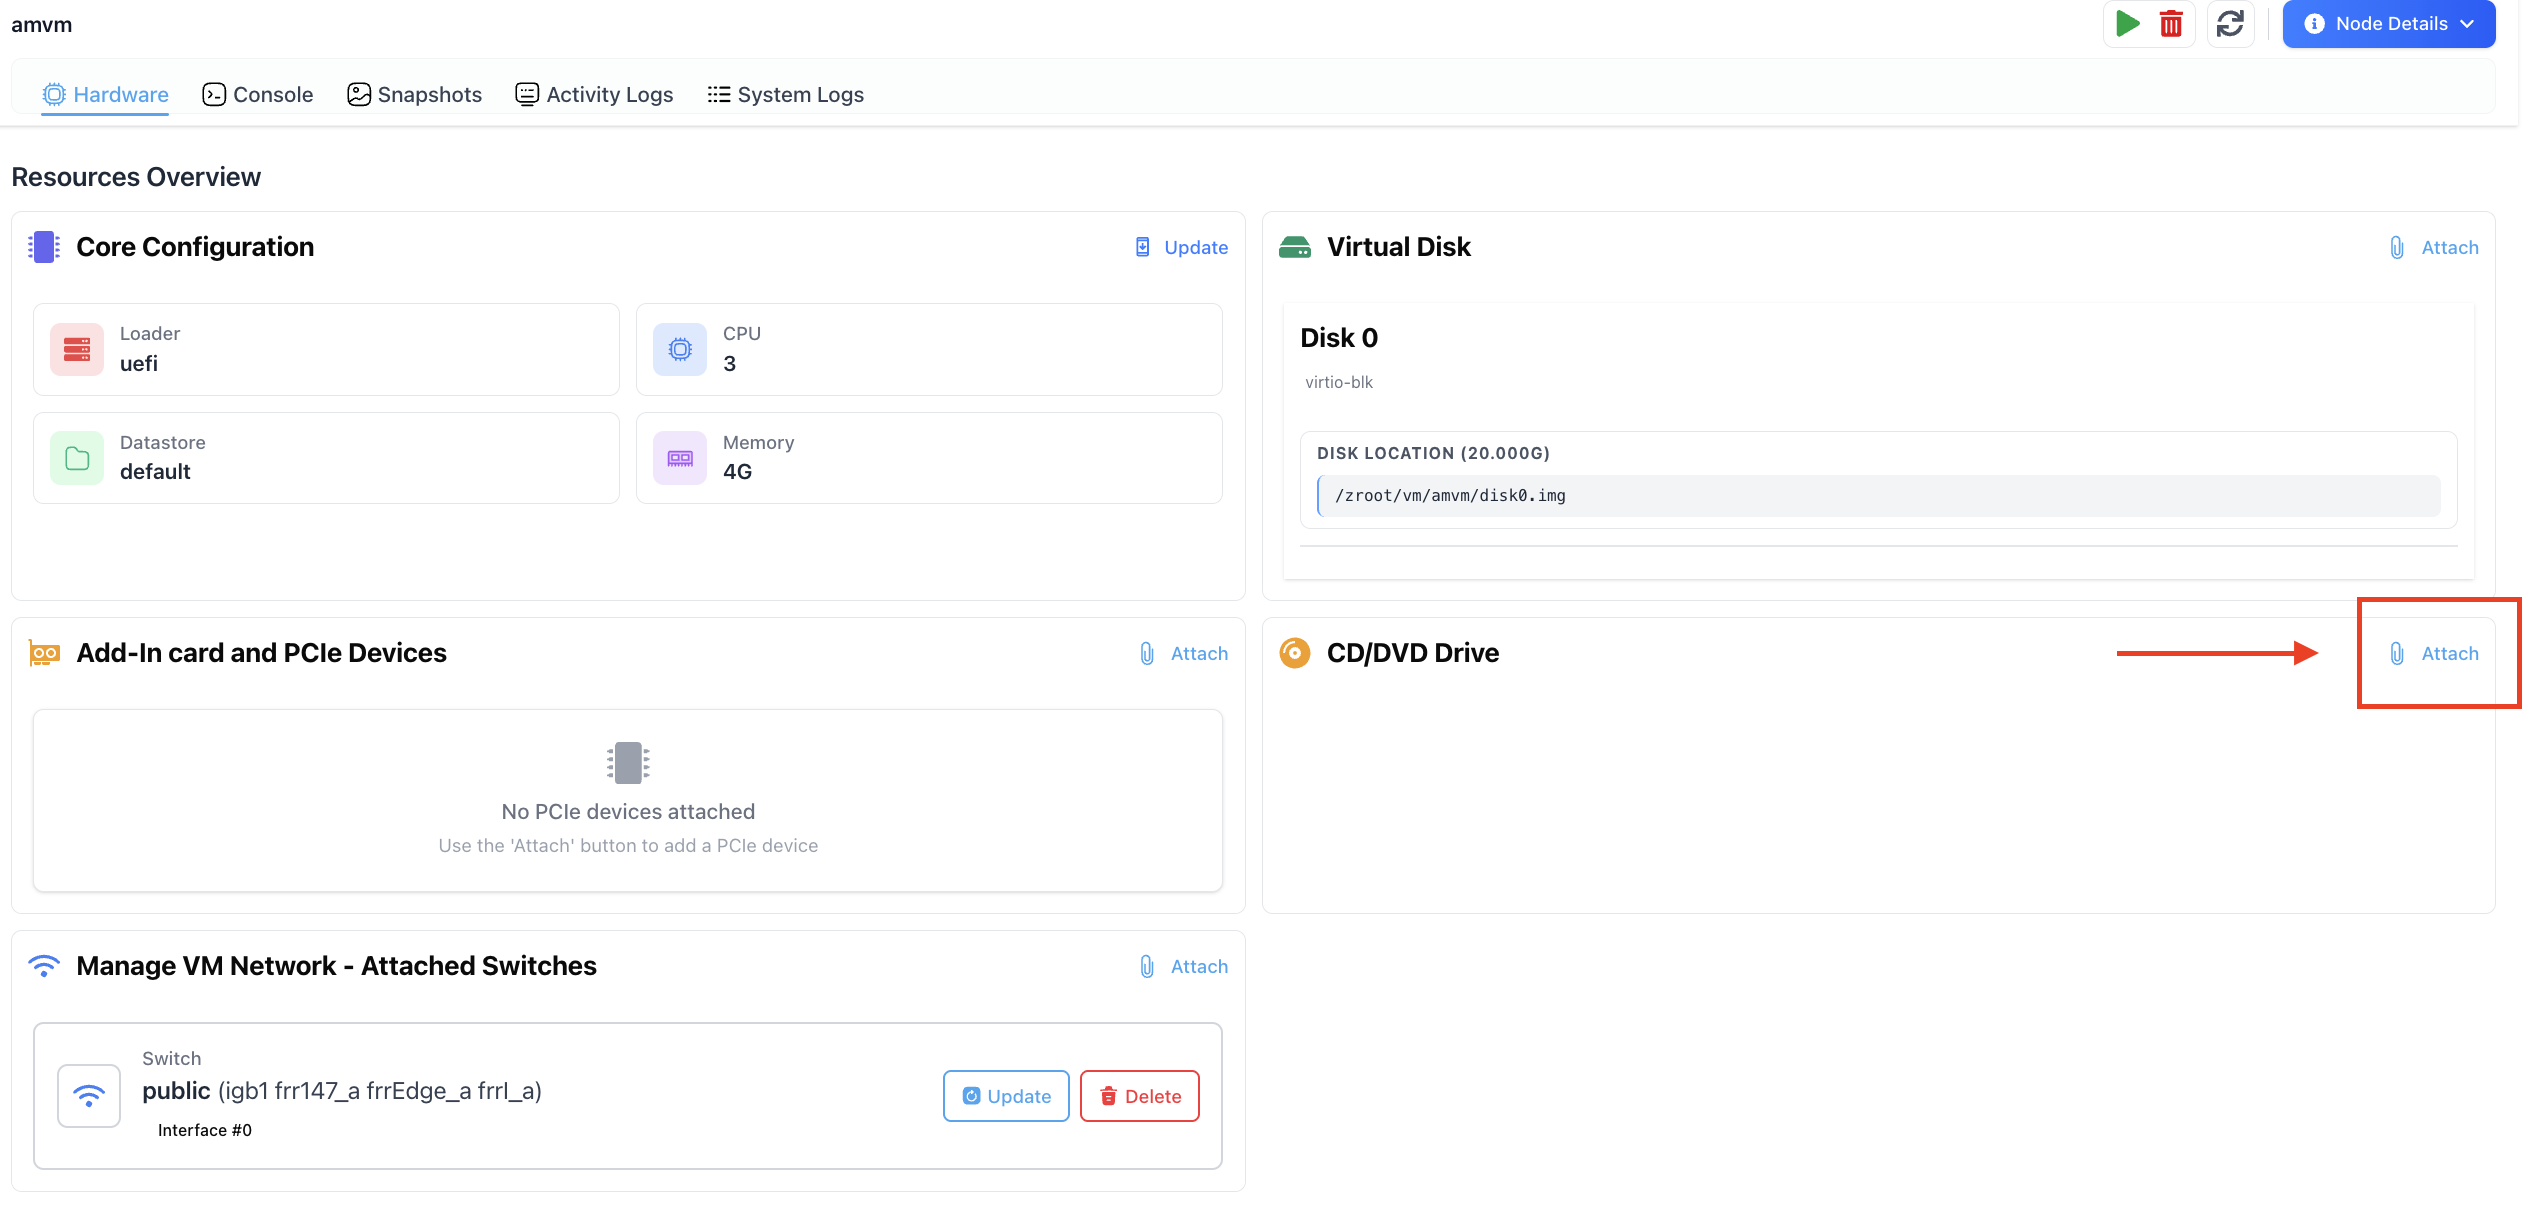
Figure: Attach Windows ISO
Select VM configurations on the drive selection popup
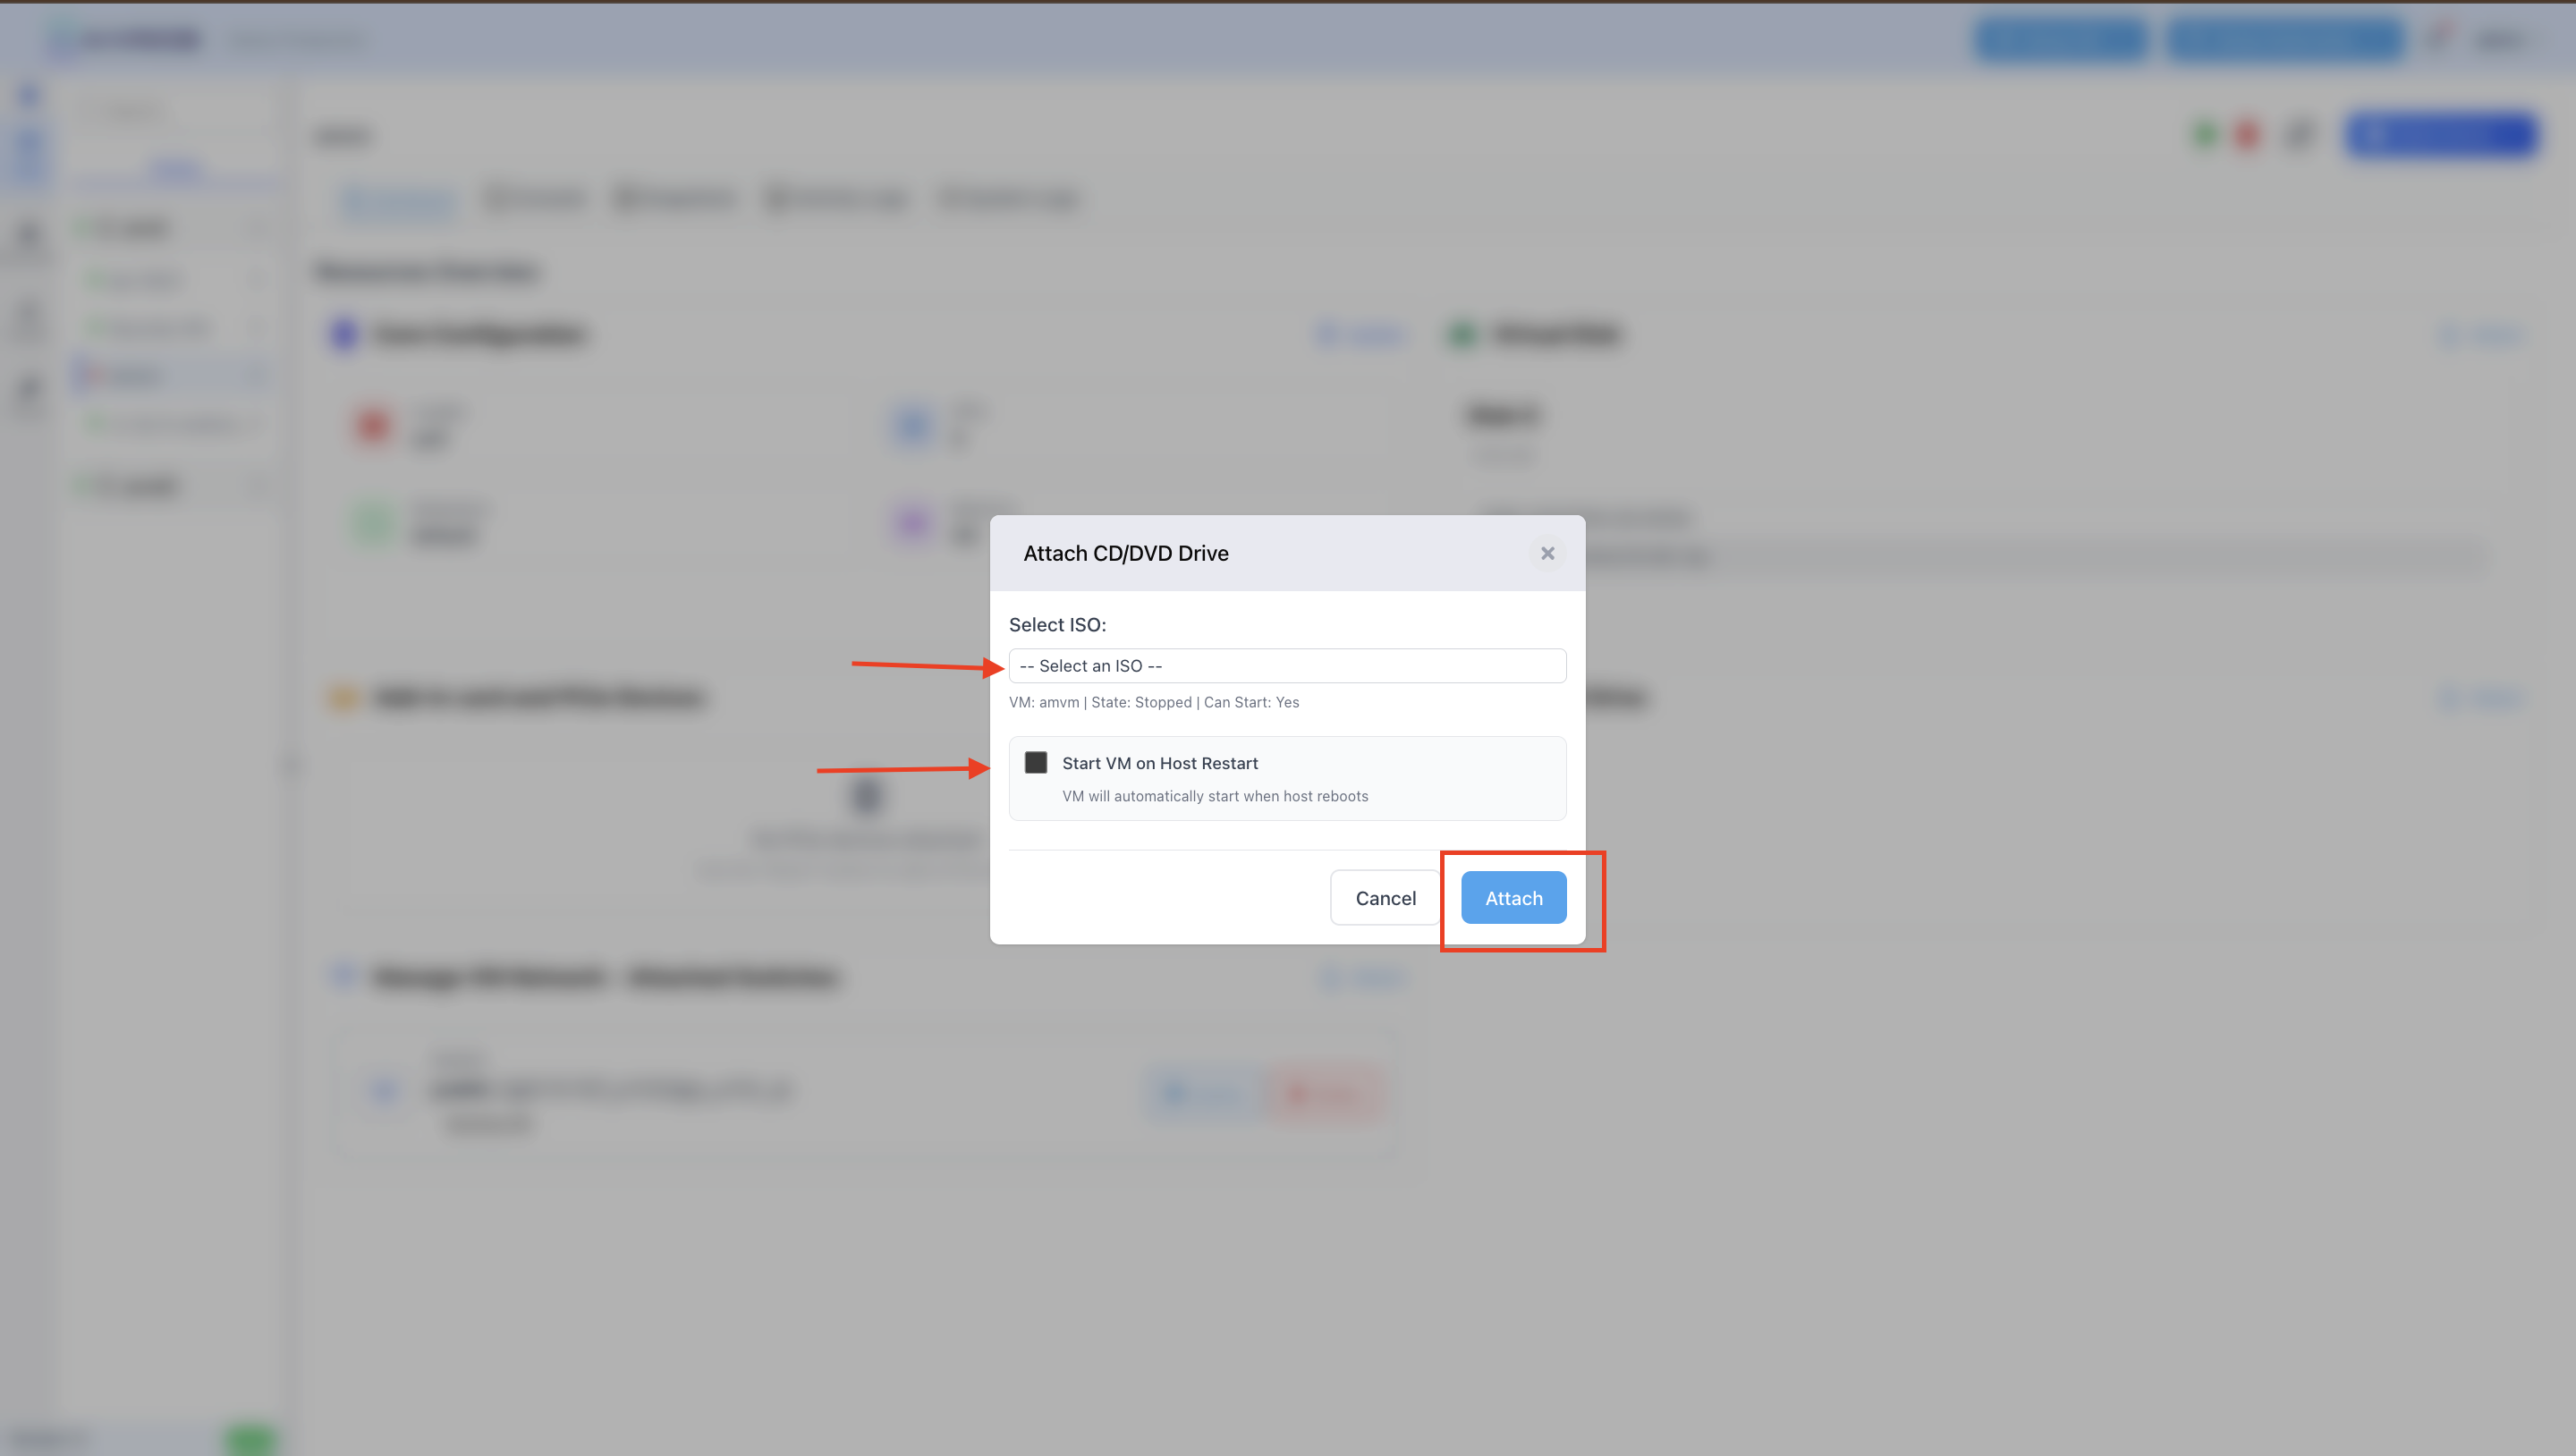
Figure: Attach Windows ISO Popup
Select ISO and Attach: Choose Windows 10 ISO and click “Attach”
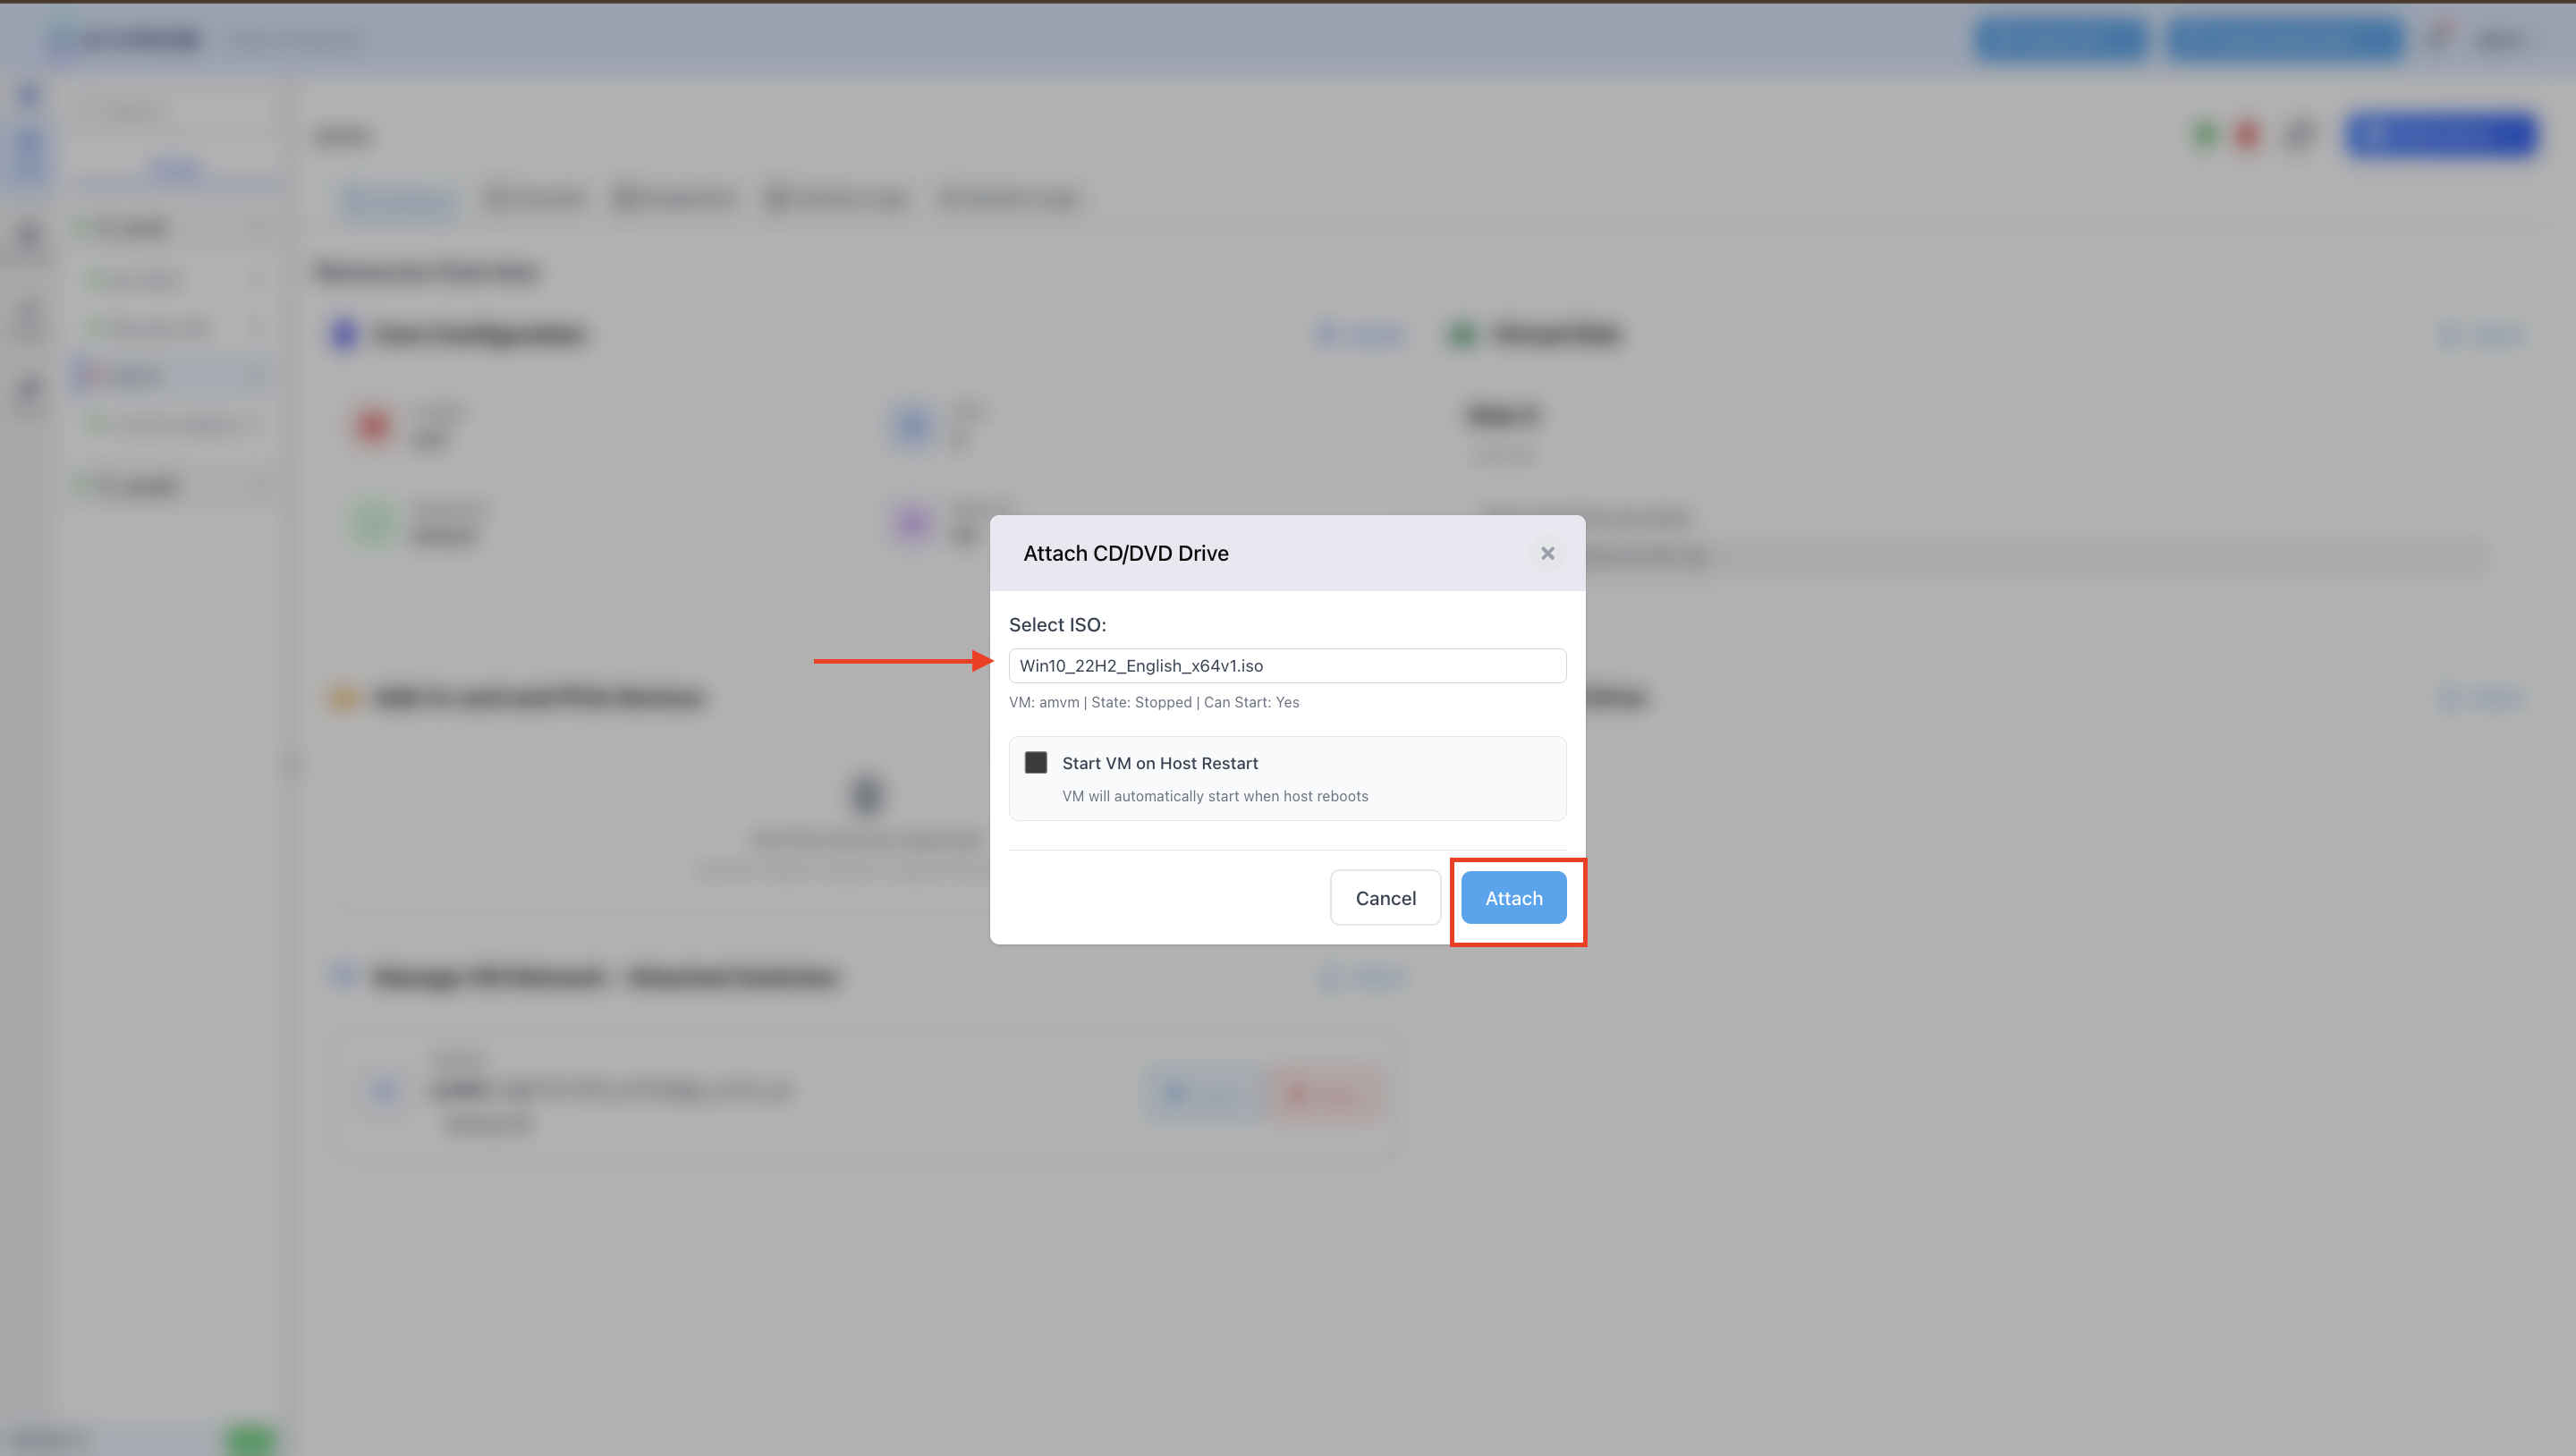
Figure: Windows ISO Attached
View Attached Drives: Confirm ISO is attached in VM configuration Visually
Figure: Attached ISO View
Post-Creation Steps
Power On: Start the virtual machine
Figure: Power On Windows VM
Windows Installation: Follow standard Windows 10 setup process
VirtIO Driver Installation: Install drivers during or after Windows setup
System Updates: Apply Windows updates and configure as needed
Note
Only Windows 10 is currently supported
UEFI loader is required for proper Windows 10 functionality
VirtIO drivers are essential for optimal performance
Minimum system requirements: 2 CPU cores, 4GB RAM, 20GB storage
Cloud-Init VM Setup
Cloud-Init Overview
Cloud-Init setup provides automated VM deployment with pre-configuration capabilities, supporting:
FreeBSD: Automated FreeBSD deployment with cloud-init
Ubuntu: Automated Ubuntu deployment with cloud-init integration
Note
Please upload and download a raw image (.raw) if it is not available during the setup. To do this, navigate to the node-level ISO section in the interface.
Cloud-Init Configuration Process
Setup Method Selection: Choose “Cloud-Init Setup” from available options
Server Selection: Select target server for VM deployment
Basic VM Configuration: Configure VM name, loader, and OS
Resource Allocation: Set CPU, memory, and storage parameters
User Account Setup: Configure initial user account and authentication
Network Configuration: Set network parameters (DHCP or static)
VM Creation: Deploy the cloud-init enabled virtual machine
VM Basic Configuration
Step 1: Select Server and Basic VM Details
Server Selection: Choose the target server for VM deployment.
VM Name: Enter a unique name for your virtual machine.
Operating System: Select the desired OS (FreeBSD or Ubuntu).
Note
Cloud-Init setup only supports raw disk images (.raw format).
Step 2: Storage and Network Configuration
Storage Pool: Select the storage pool for the VM’s disk.
Disk Size: Specify the size of the virtual disk.
Network Switch: Choose the network switch for VM connectivity.
DNS Zone: Select the DNS zone for the VM’s hostname.
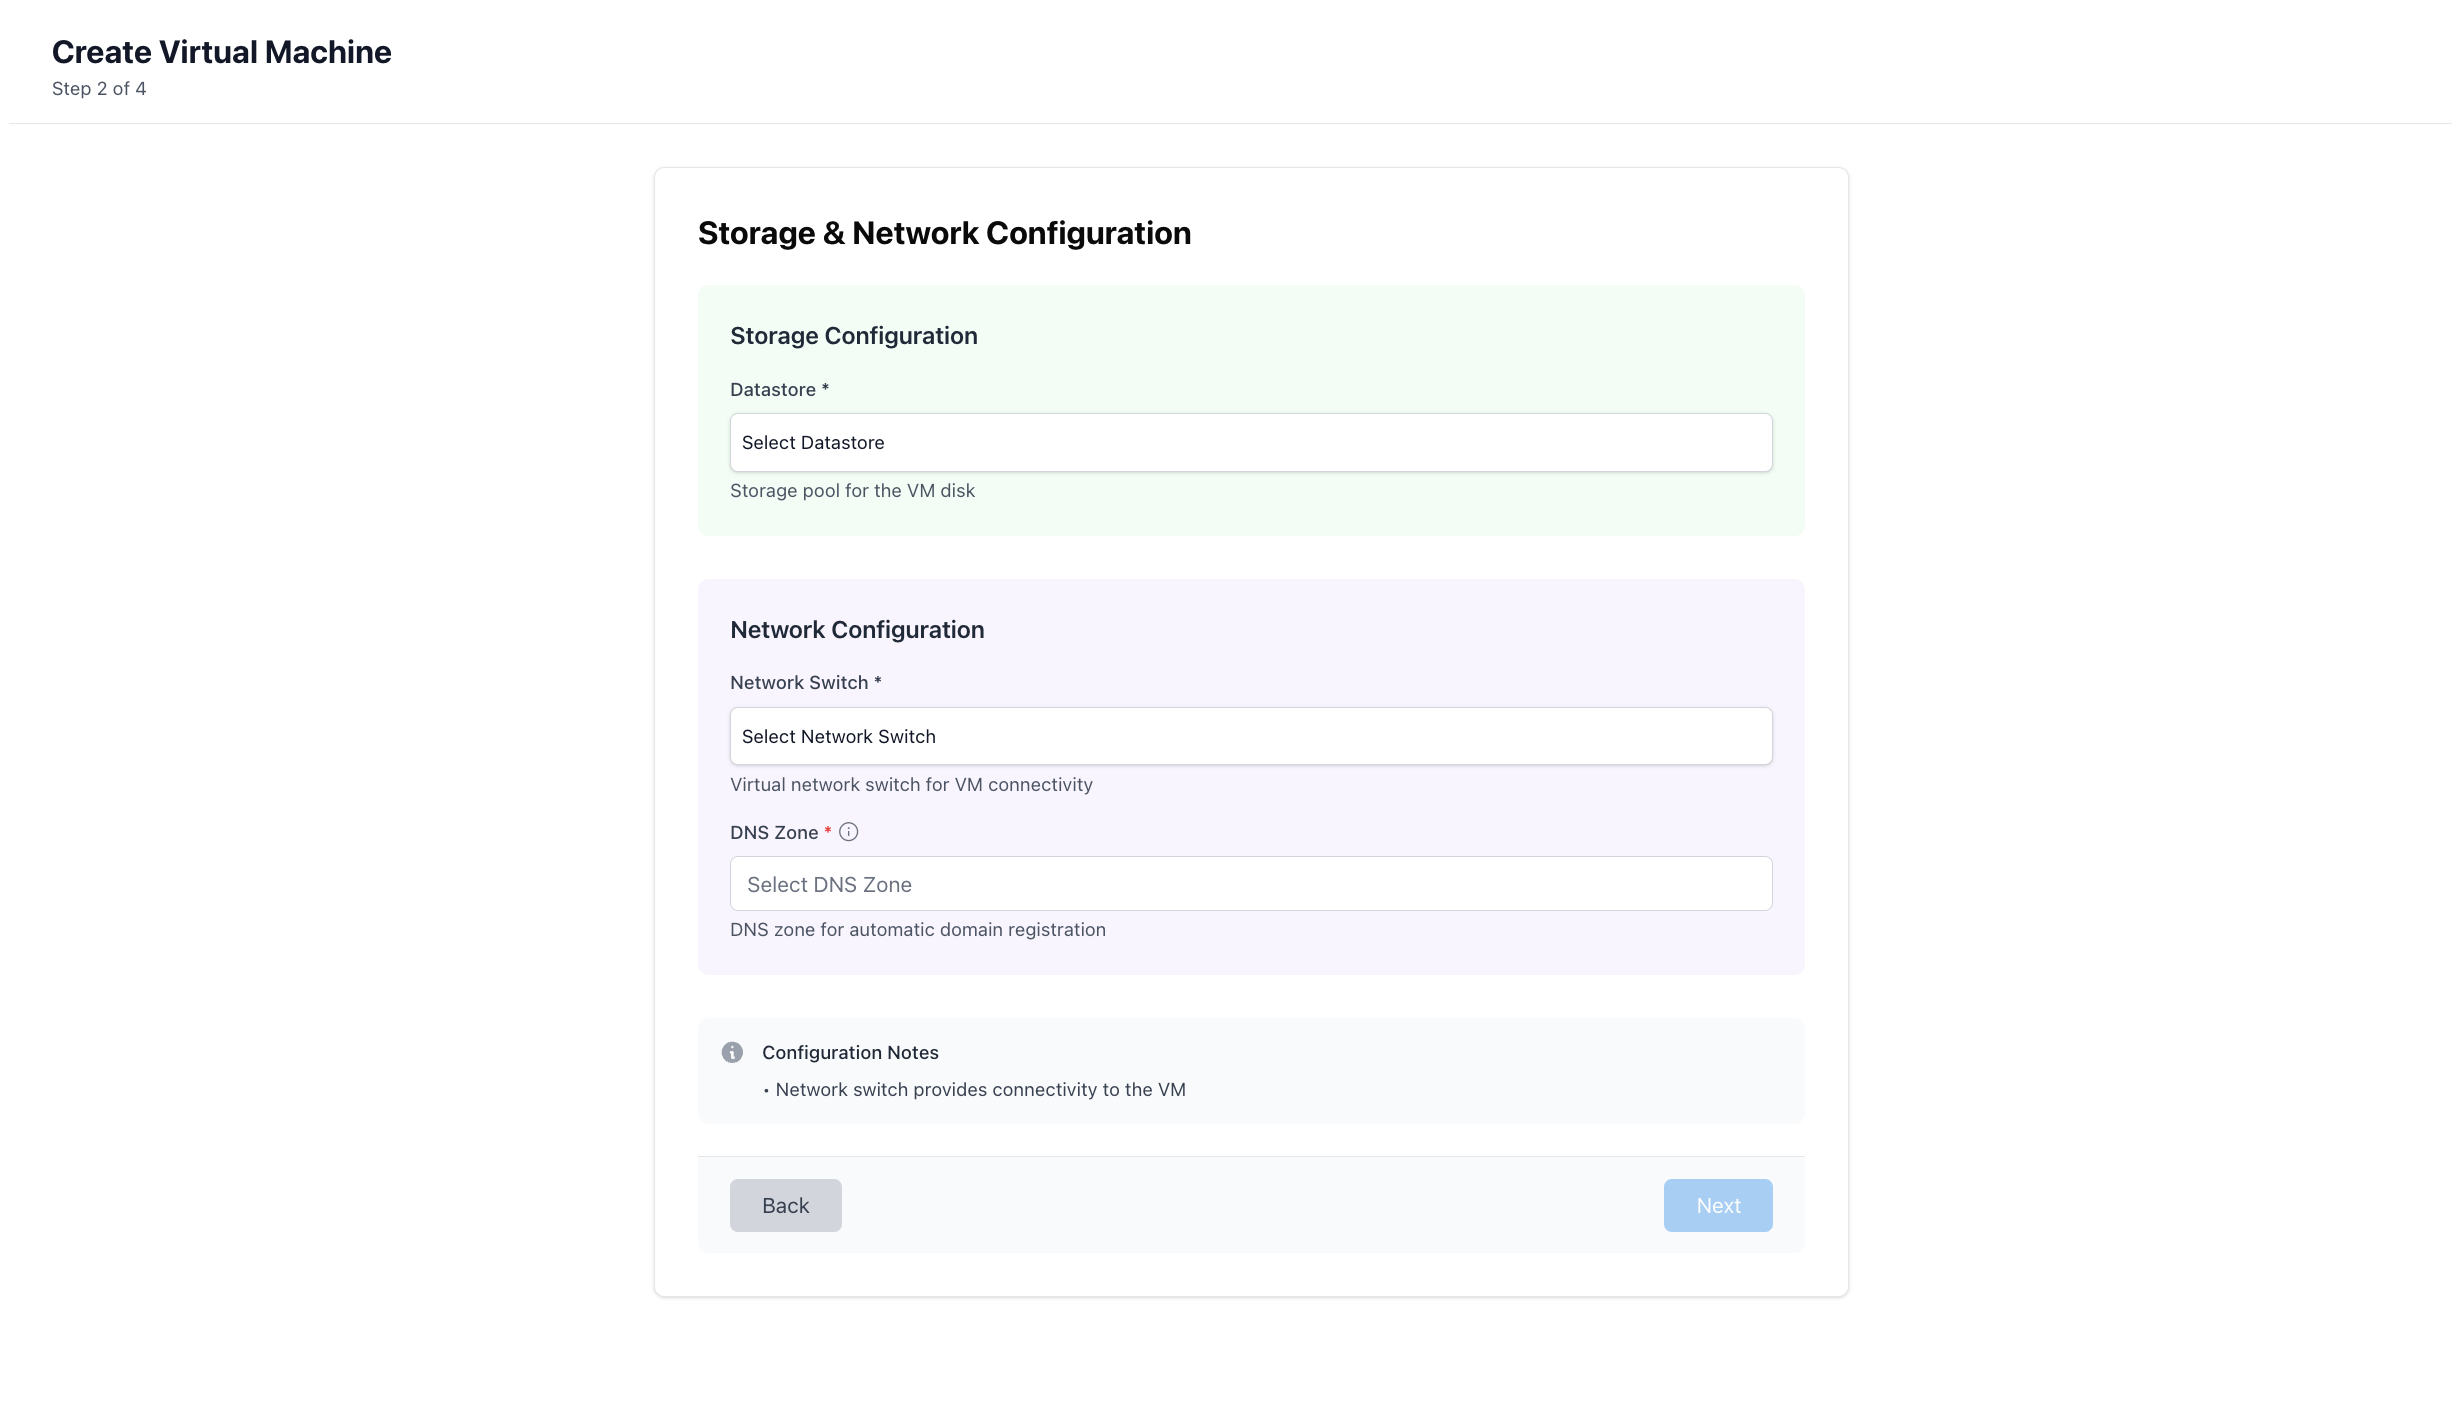
Step 3: Hardware Configuration
CPU Cores: Allocate the number of CPU cores.
Memory: Set the amount of RAM for the VM.
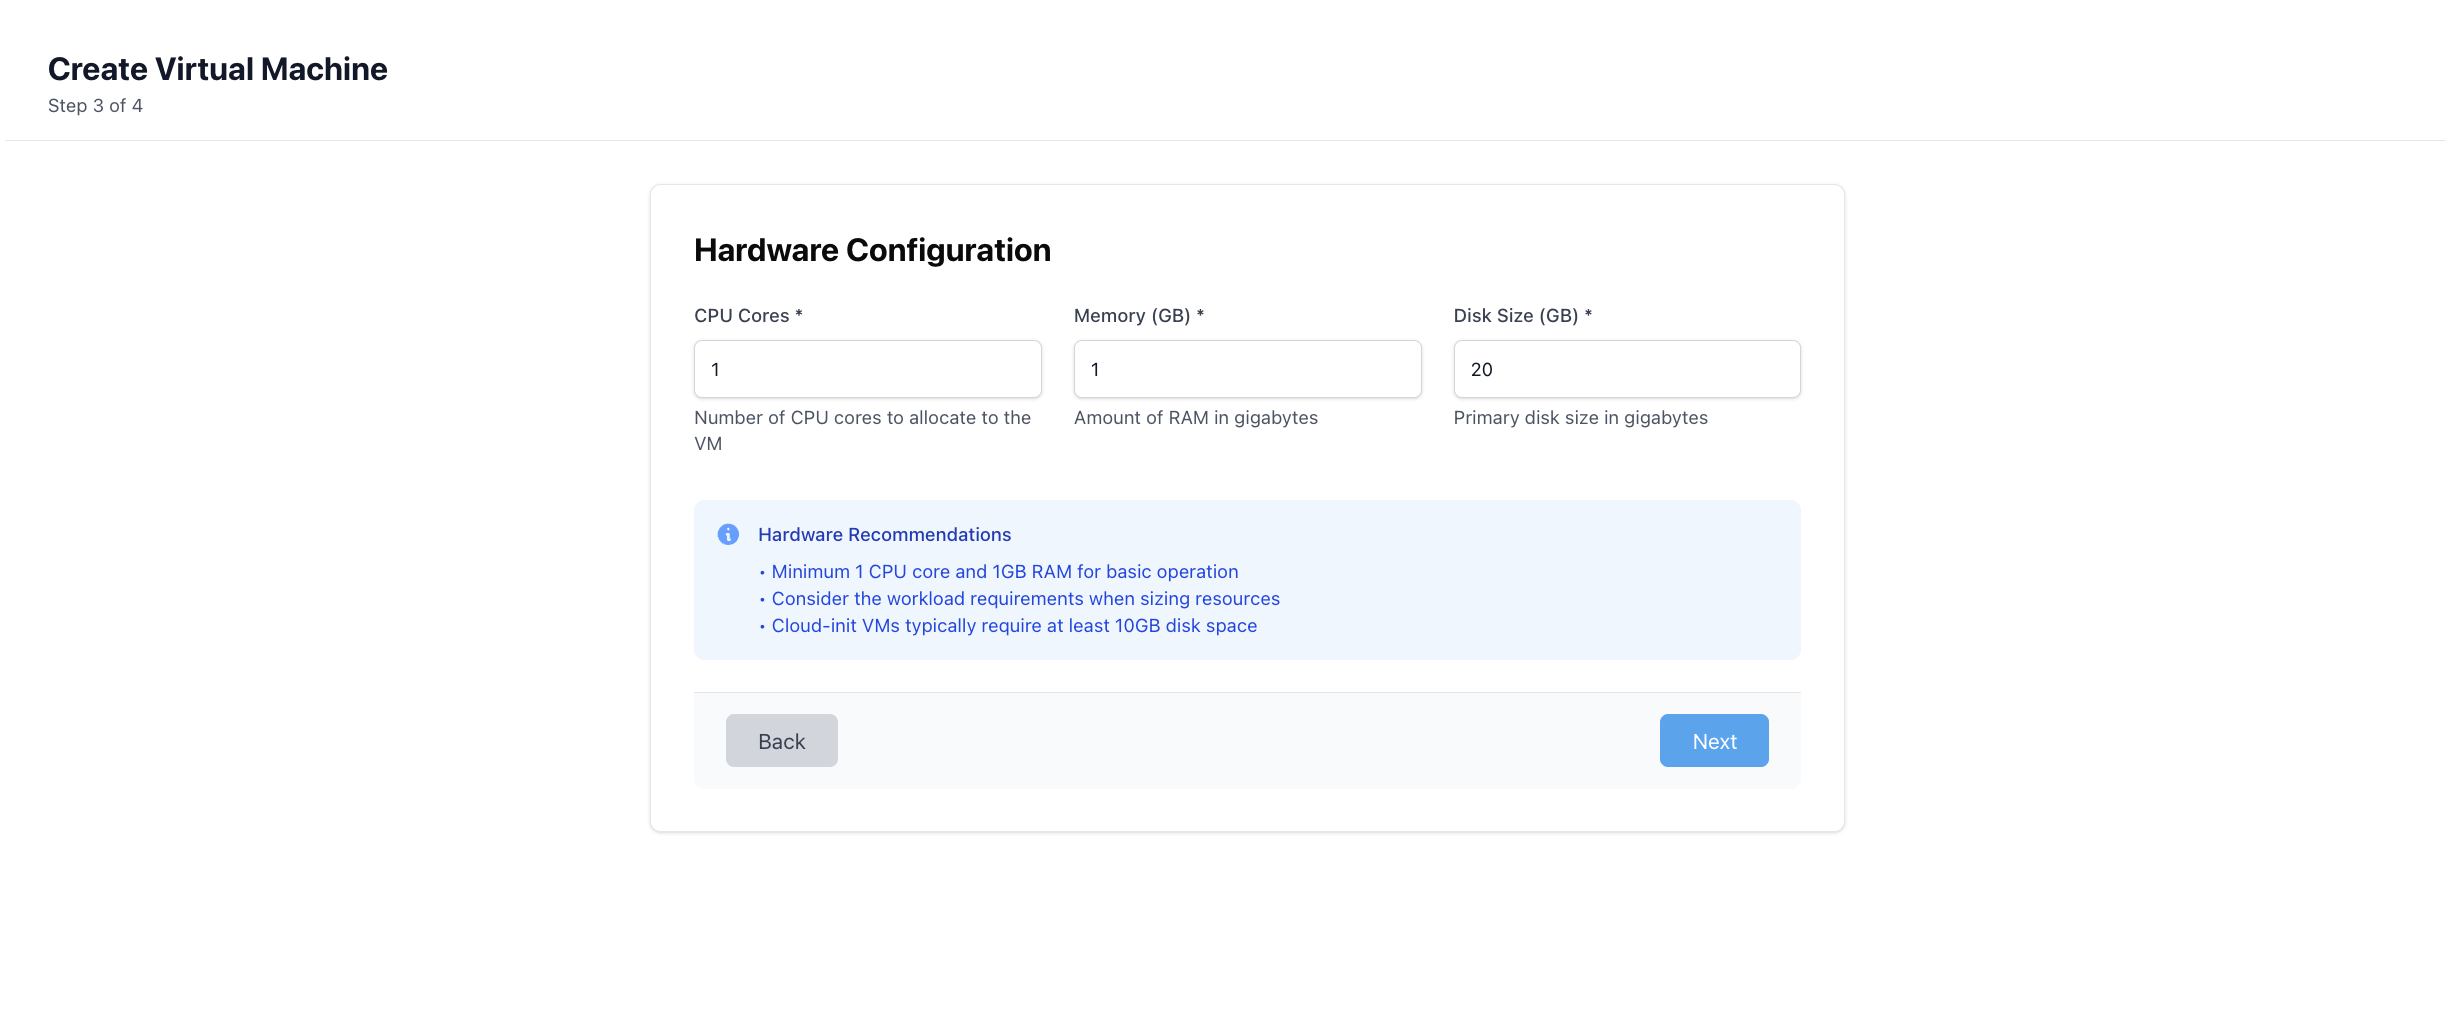
User Account Configuration
Cloud-Init VMs require initial user account setup:
Username: Primary user account for the VM
Password: Secure password for user account authentication
SSH Public Key (Optional): Add SSH public key for passwordless authentication
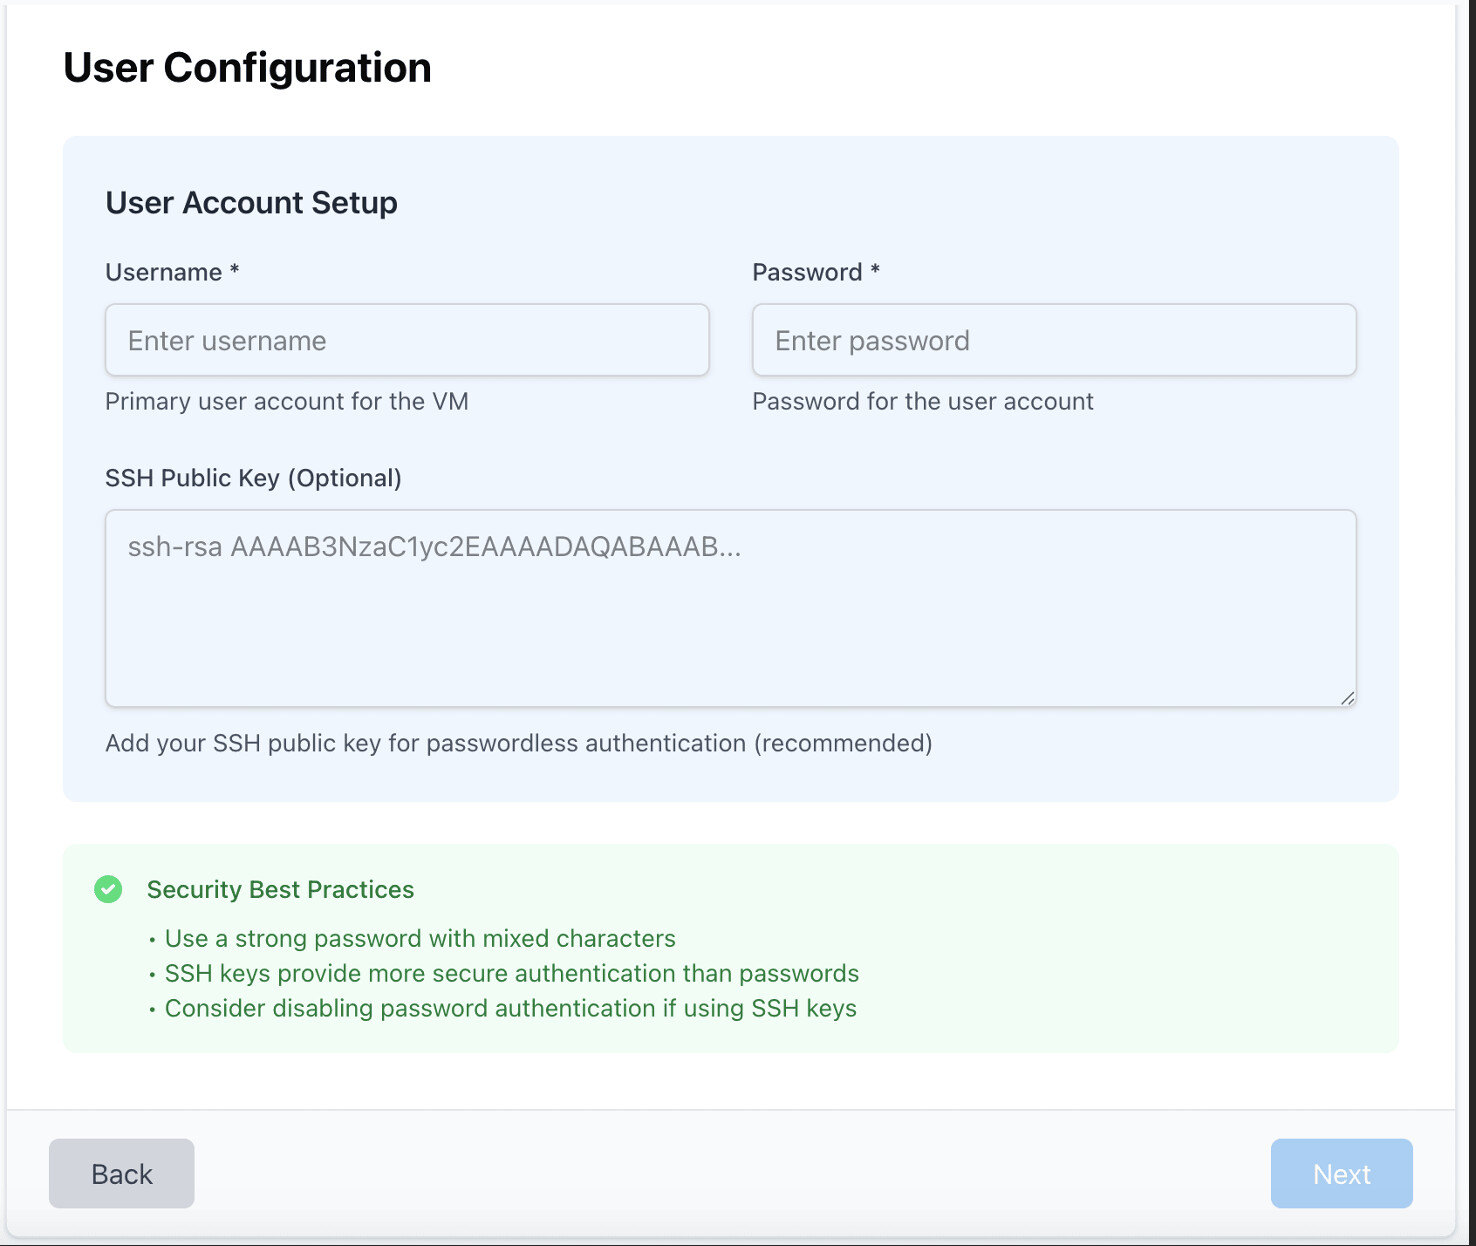
SSH Key Authentication
Configure SSH key authentication for your virtual machines.
SSH Key Format
Provide your SSH public key in standard format (e.g.,
ssh-rsa,ssh-ed25519).Paste the public key directly into the VM setup form or upload as required.
Key Benefits
Enables passwordless authentication for secure remote access.
Reduces risk of brute-force password attacks.
Simplifies automation and remote management.
Multiple Keys Support
You may specify multiple SSH public keys for a VM.
Each key grants access to authorized users.
Key Management
SSH keys are managed centrally via the Karios interface.
Administrators can add, remove, or update authorized keys for each VM.
Regularly review and rotate SSH keys.
Note
Always keep your private SSH keys secure and never share them. Only authorized public keys should be added to the VM configuration.
Network Configuration Options
DHCP Configuration (Default): - Automatic IP address assignment - Dynamic network configuration - Simplified setup process
Static IP Configuration: - Static IP Address: Manually specify IP address - Subnet Mask: Configure network subnet mask - Domain Name: Set domain name for the VM
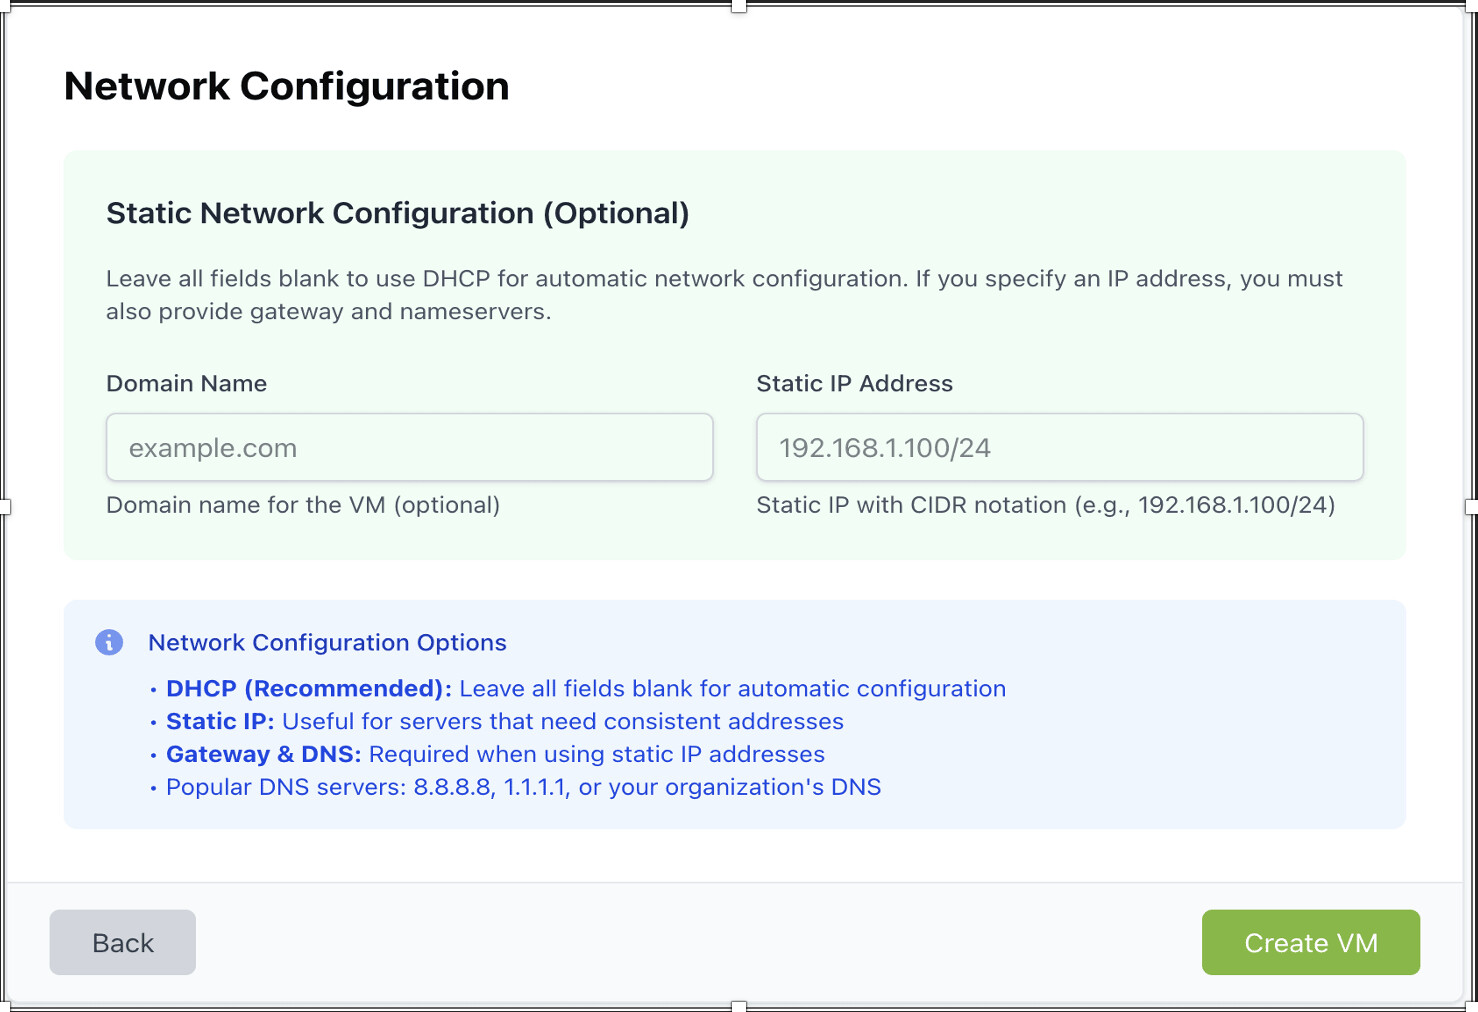
VM Access Best Practices
The system provides recommendations to ensure safe and reliable VM operations:
Strong Passwords: Use complex passwords with a mix of uppercase, lowercase, numbers, and special characters.
SSH Key Authentication: Prefer SSH keys over passwords for VM access; they offer stronger protection and reduce brute-force risks.
Password Disabling: When SSH keys are configured, consider disabling password authentication for remote access.
Network Configuration: Apply appropriate network policies, such as firewalls and VLAN segmentation, to protect VM traffic.
VM Deployment Process
Pre-Deployment Validation
Before creating a VM, the system performs several validation checks:
Network Switch Availability: Ensure a virtual switch exists and is ready to attach to the VM’s NIC (see Networking → Switches → Create).
OS ISO Availability: Confirm the required installation ISO is present and attachable. If missing, upload or download the ISO from Node → ISOs.
Resource Availability: Verify sufficient CPU, memory, and storage capacity on the target node.
Configuration Validity: Validate all VM parameters (vCPU, memory, disk, NIC) for compatibility with the selected node.
VM Creation Process
The VM creation workflow includes:
Configuration Review: Review all VM settings before proceeding.
Resource Reservation: Reserve the specified resources on the target server.
VM Instantiation: Create the virtual machine with the chosen configuration.
OS Installation: Install the operating system (automatic for cloud-init setups).
Initial Configuration: Apply initial configuration settings, such as user accounts and network parameters.
Service Startup: Start VM services and validate basic functionality.
Post-Creation Verification
After VM creation, perform the following checks:
VM Status: Confirm the VM is running and accessible via the management interface.
Network Connectivity: Test network connectivity and verify correct configuration.
User Access: Ensure user accounts and authentication methods (password or SSH key) are working.
Service Functionality: Validate that all required services within the VM are operational.
VM Lifecycle Management
VM Management Interface
Once a VM is created, the VM management interface provides comprehensive control through several key sections:
Click on the icon highlighted below to navigate to the VM management interface. All created VMs will be listed here.
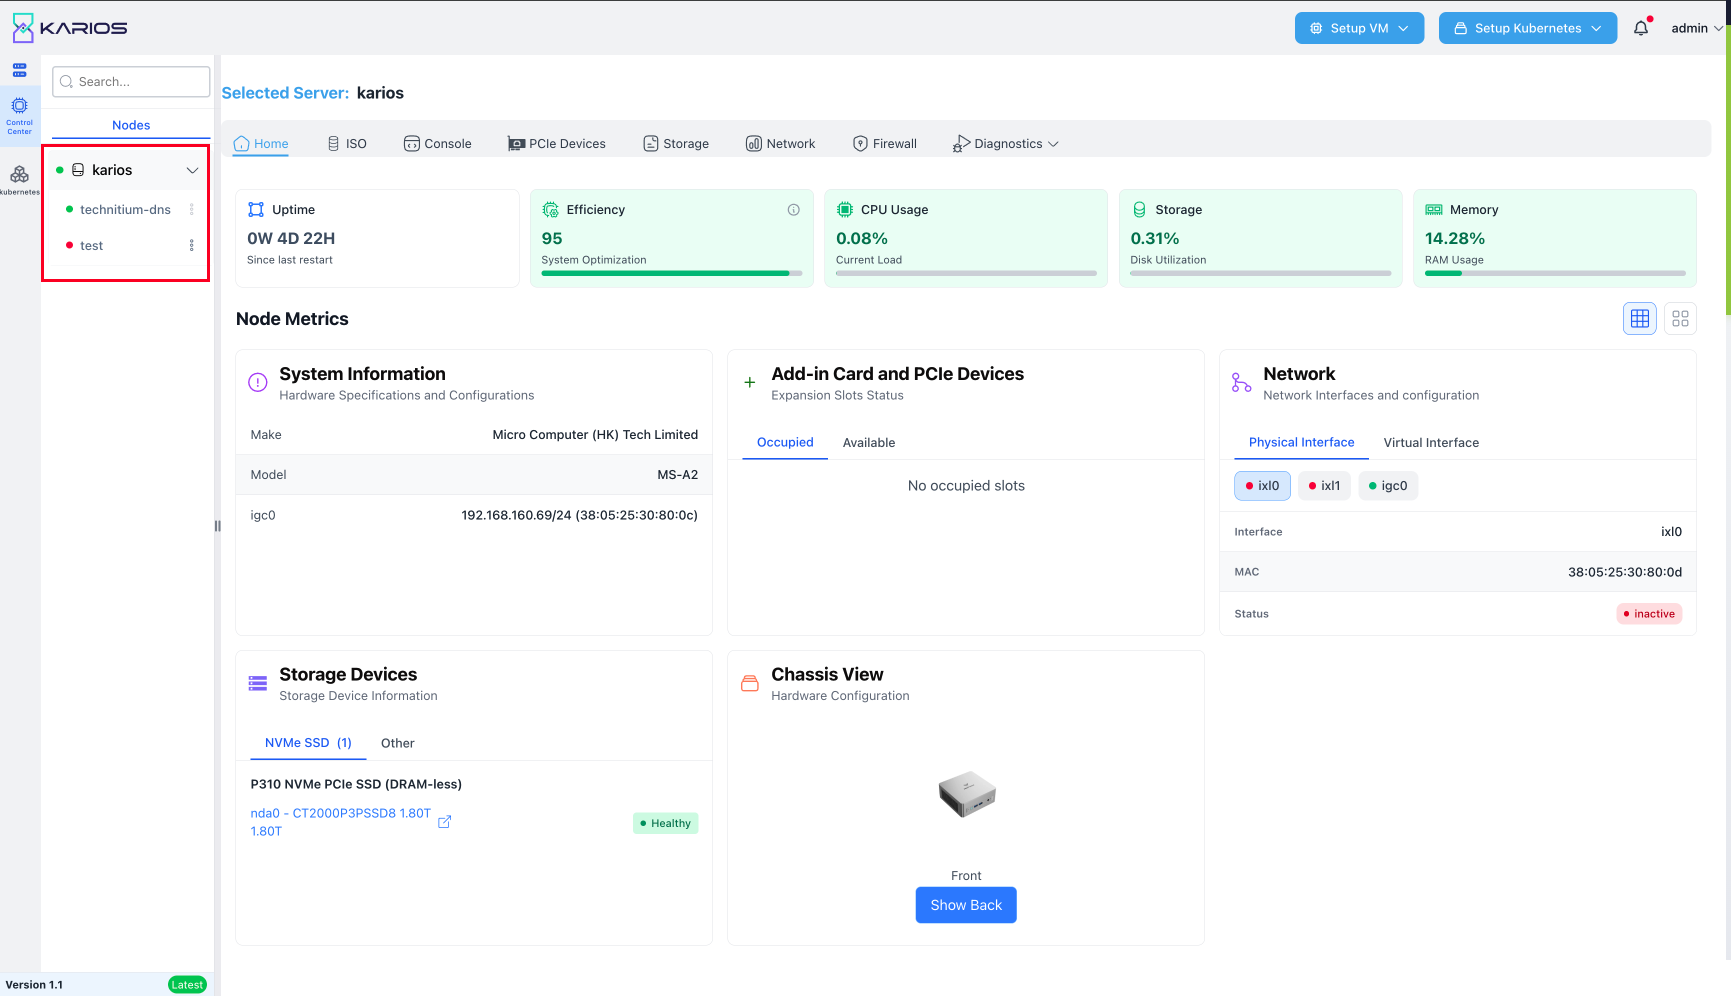
Hardware Tab: Configure VM hardware specifications and resources
Console Tab: Direct console access to the virtual machine
Snapshots Tab: Create and manage VM snapshots
Activity Logs Tab: View VM operation history and logs
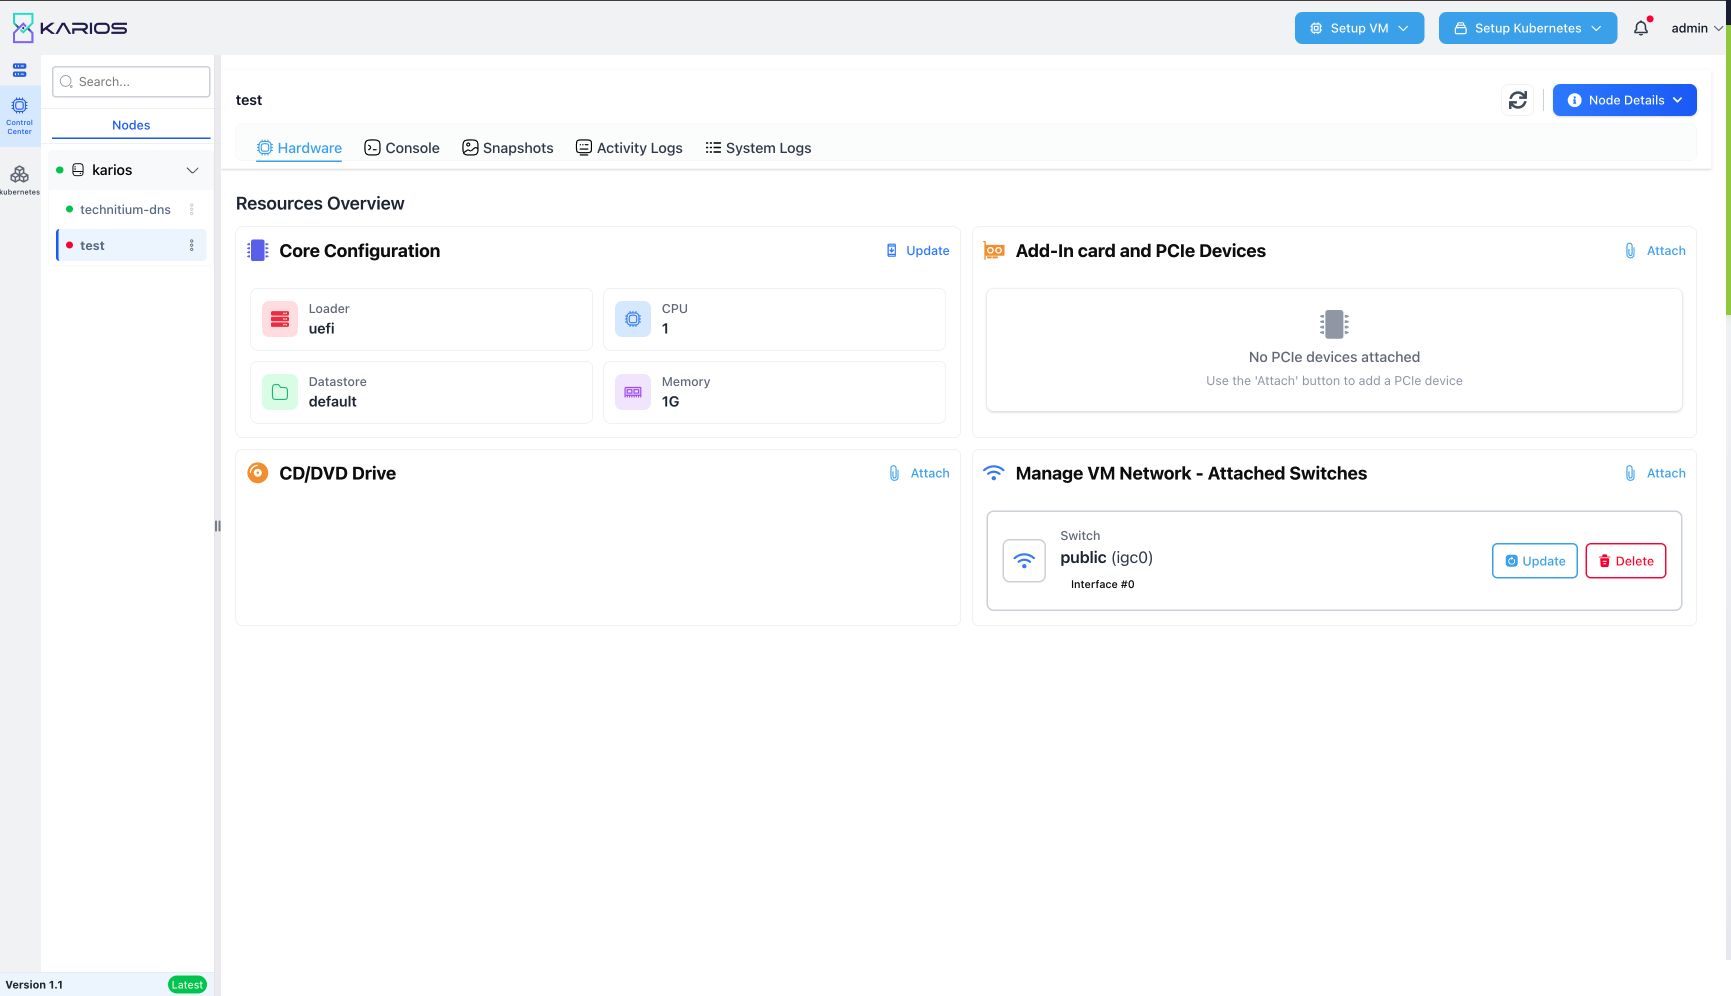
VM Hardware Configuration
The Hardware tab allows dynamic modification of VM specifications:
VM Details Configuration: Adjust CPU and memory allocation
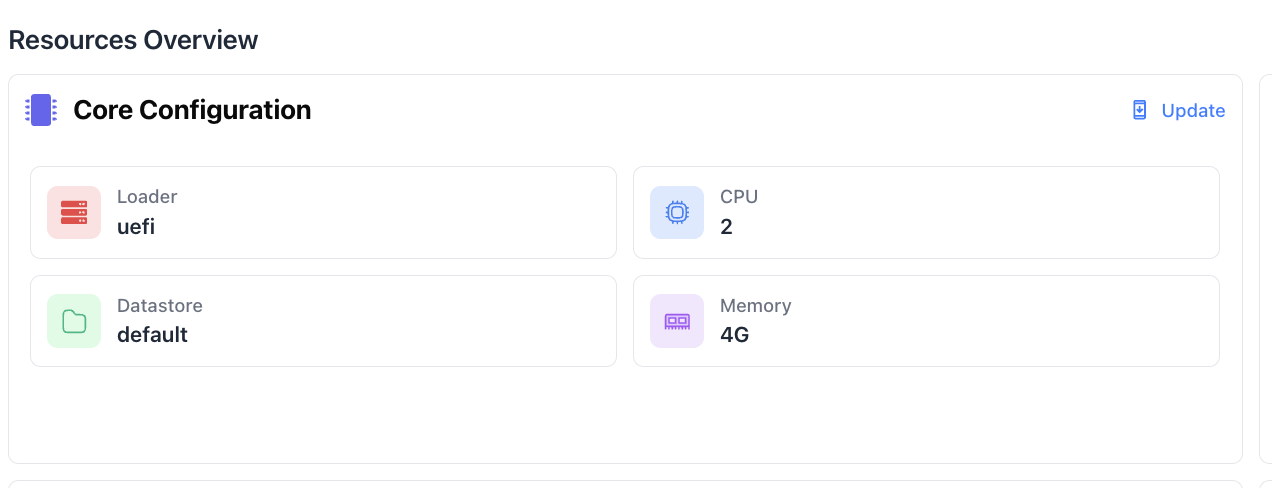
CD/DVD Drive Management: Attach ISO images for installation or boot
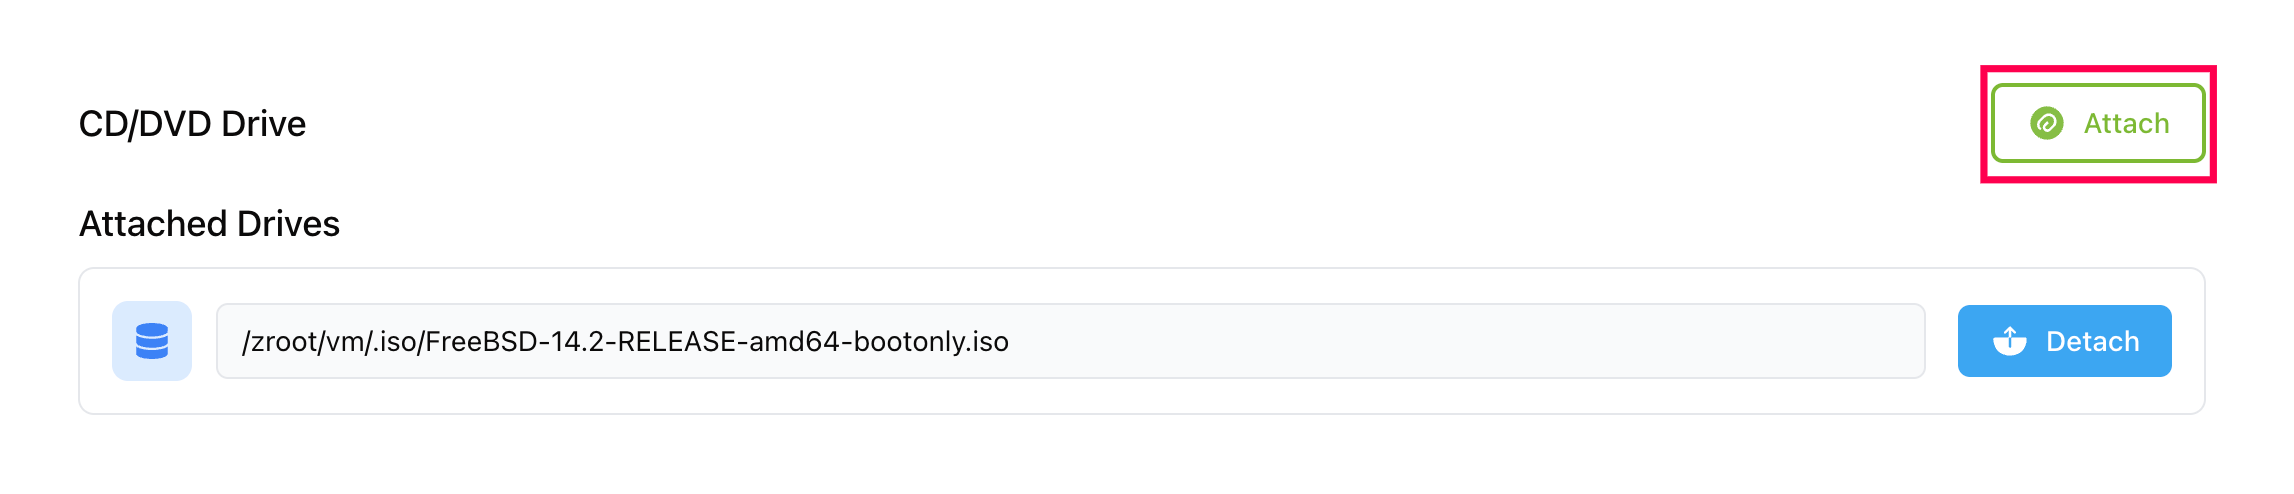
Network Switch Management: Configure network interfaces and switches
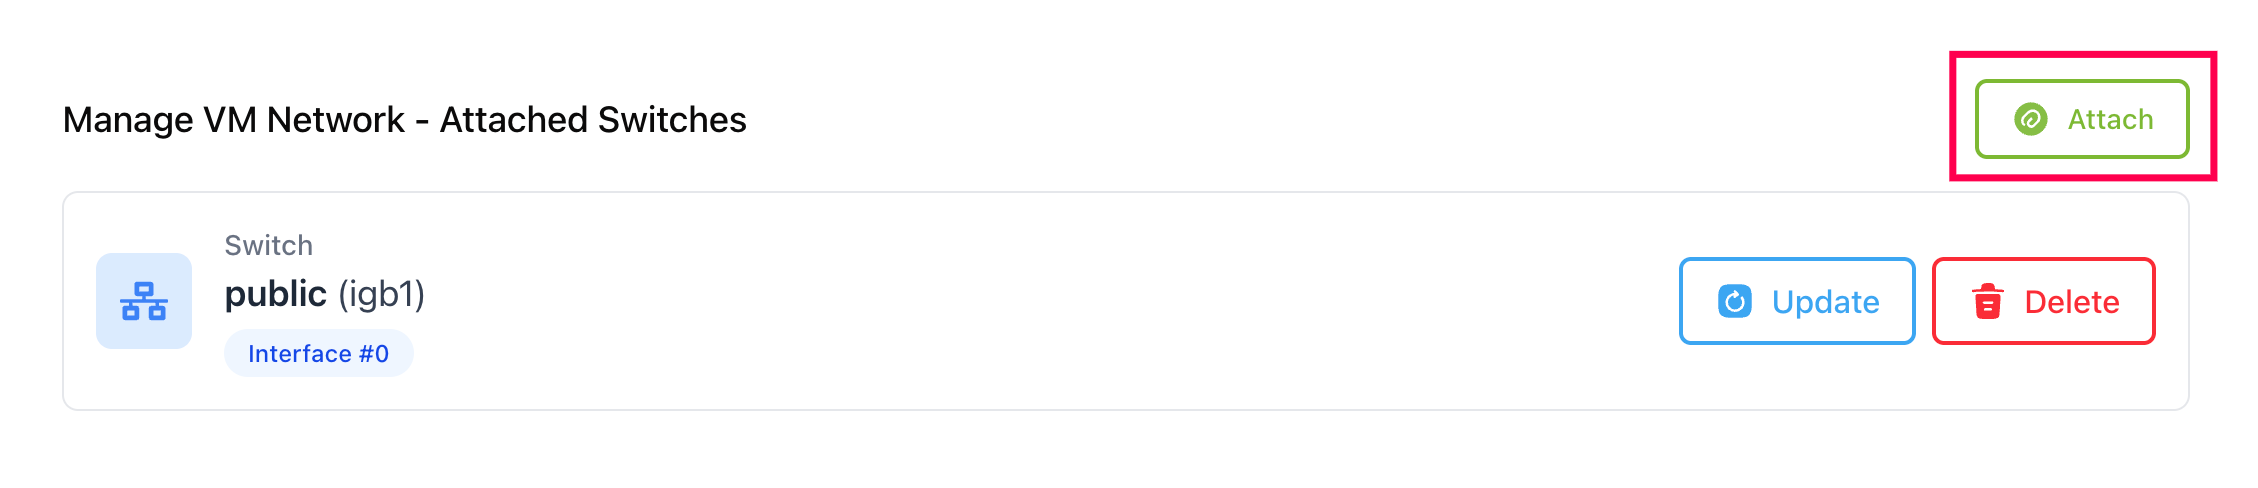
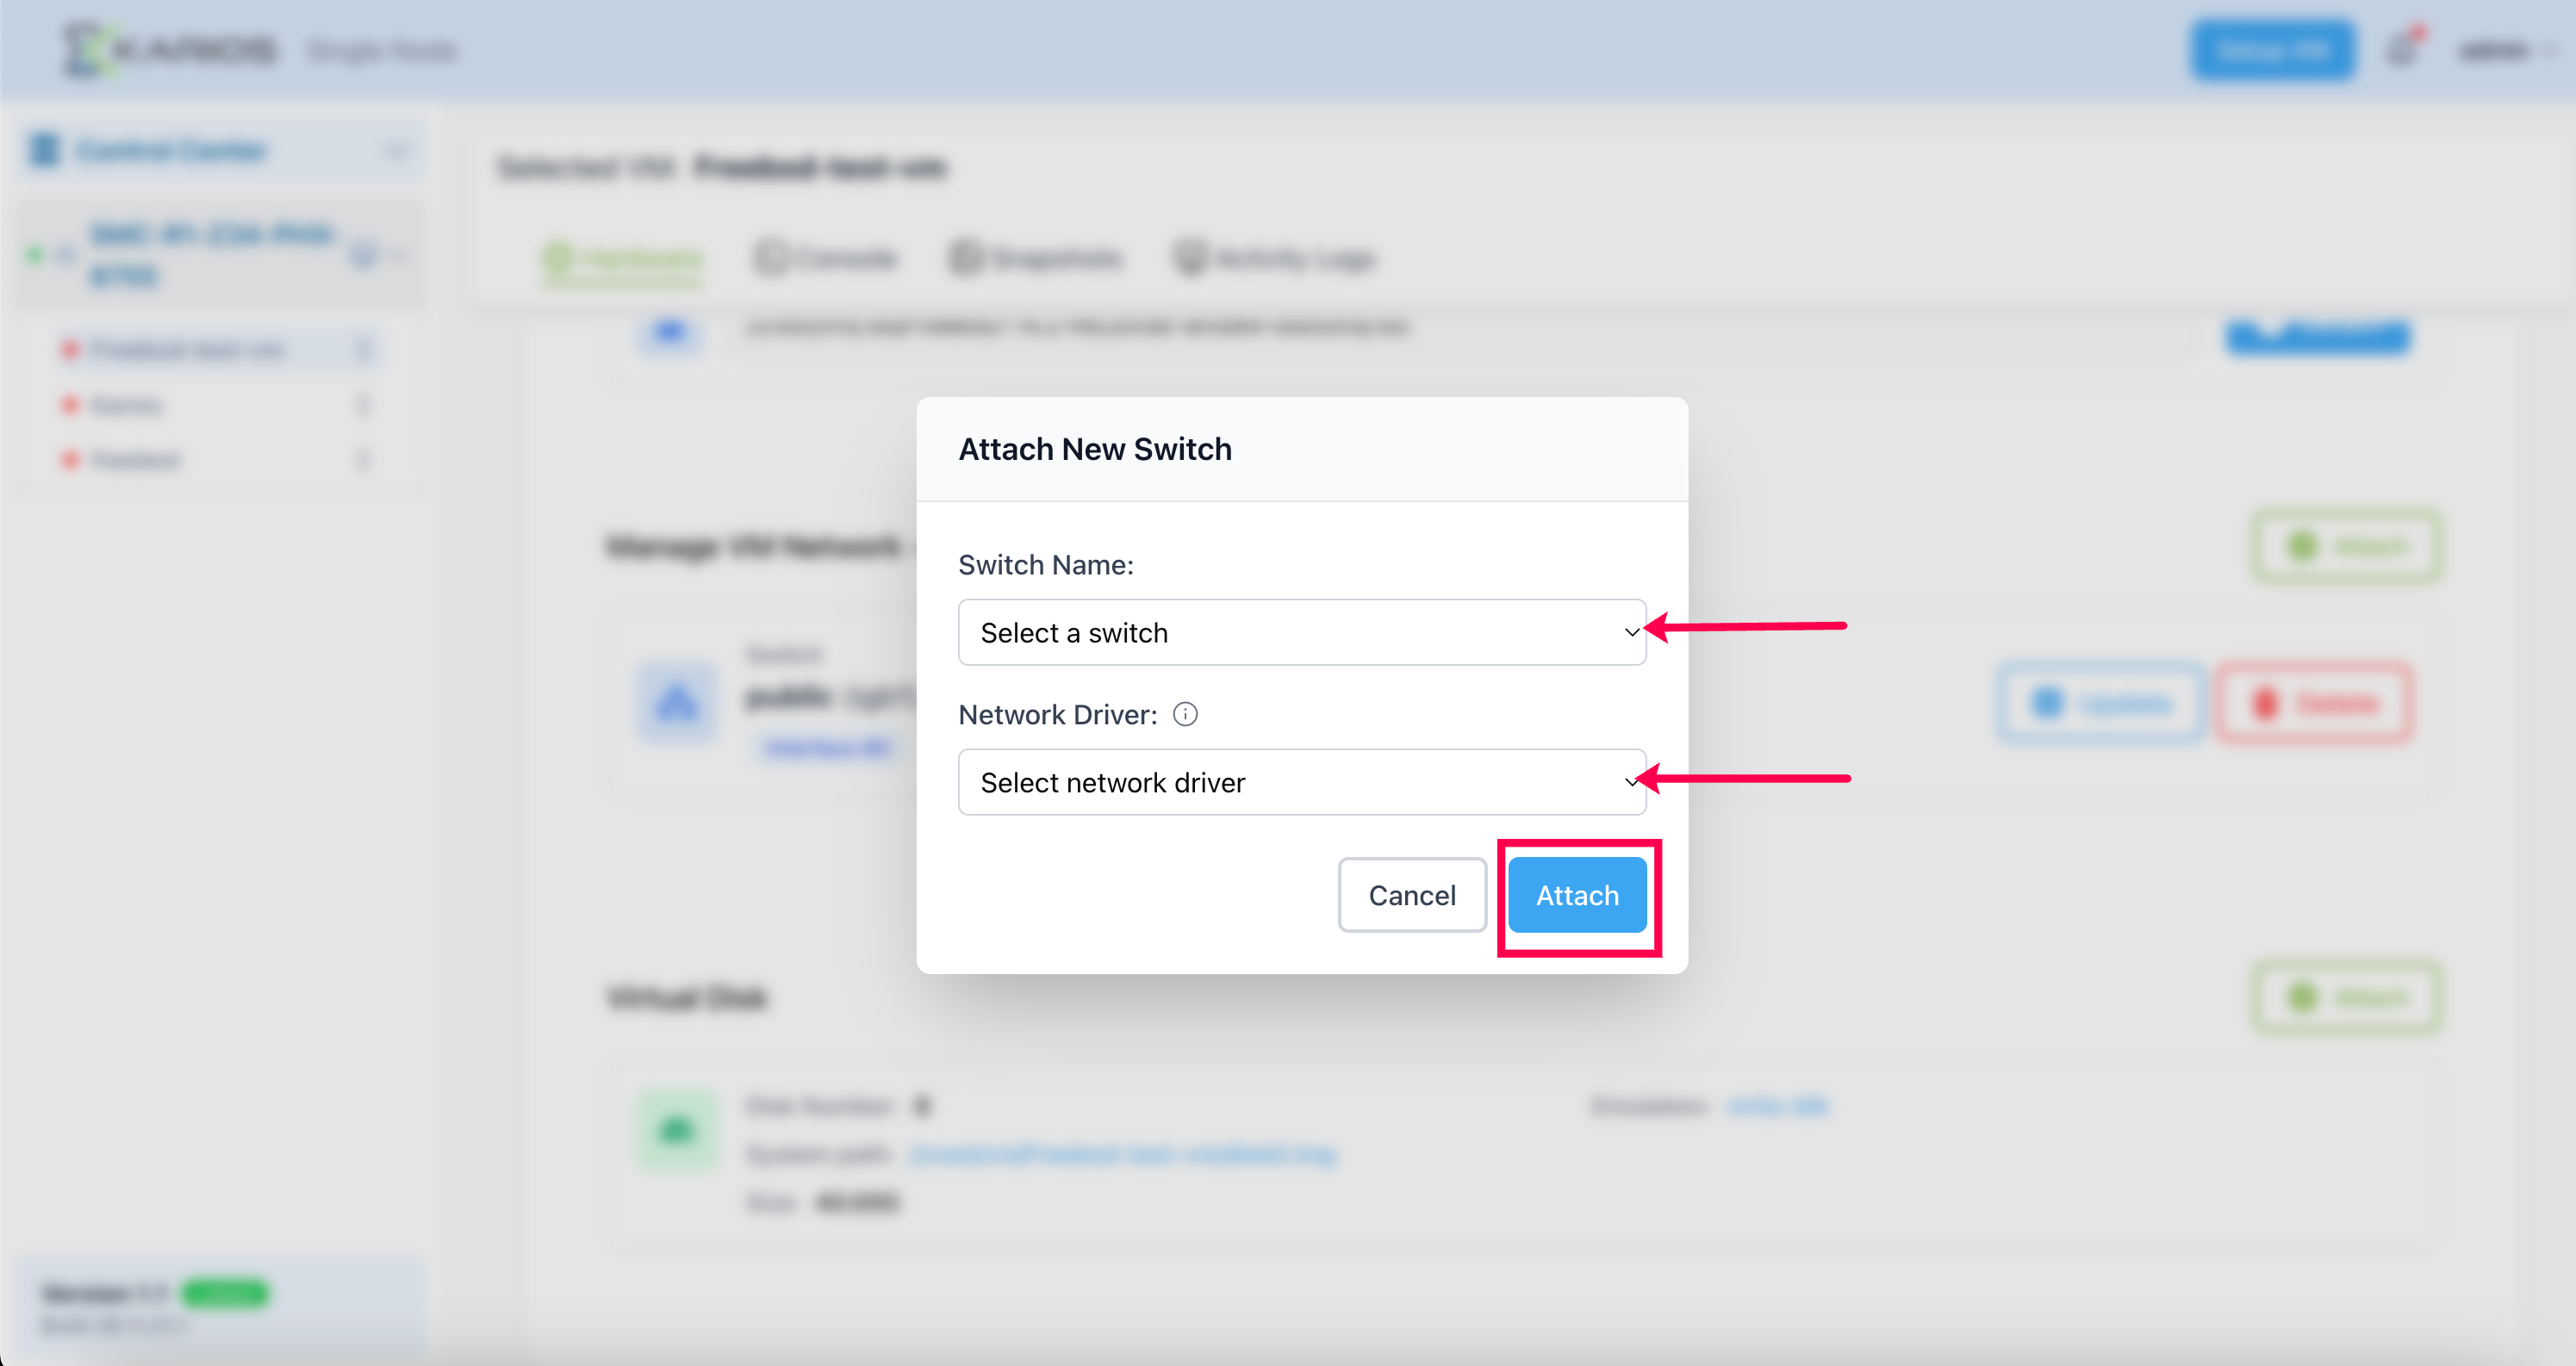
Update: Modify existing network configurations

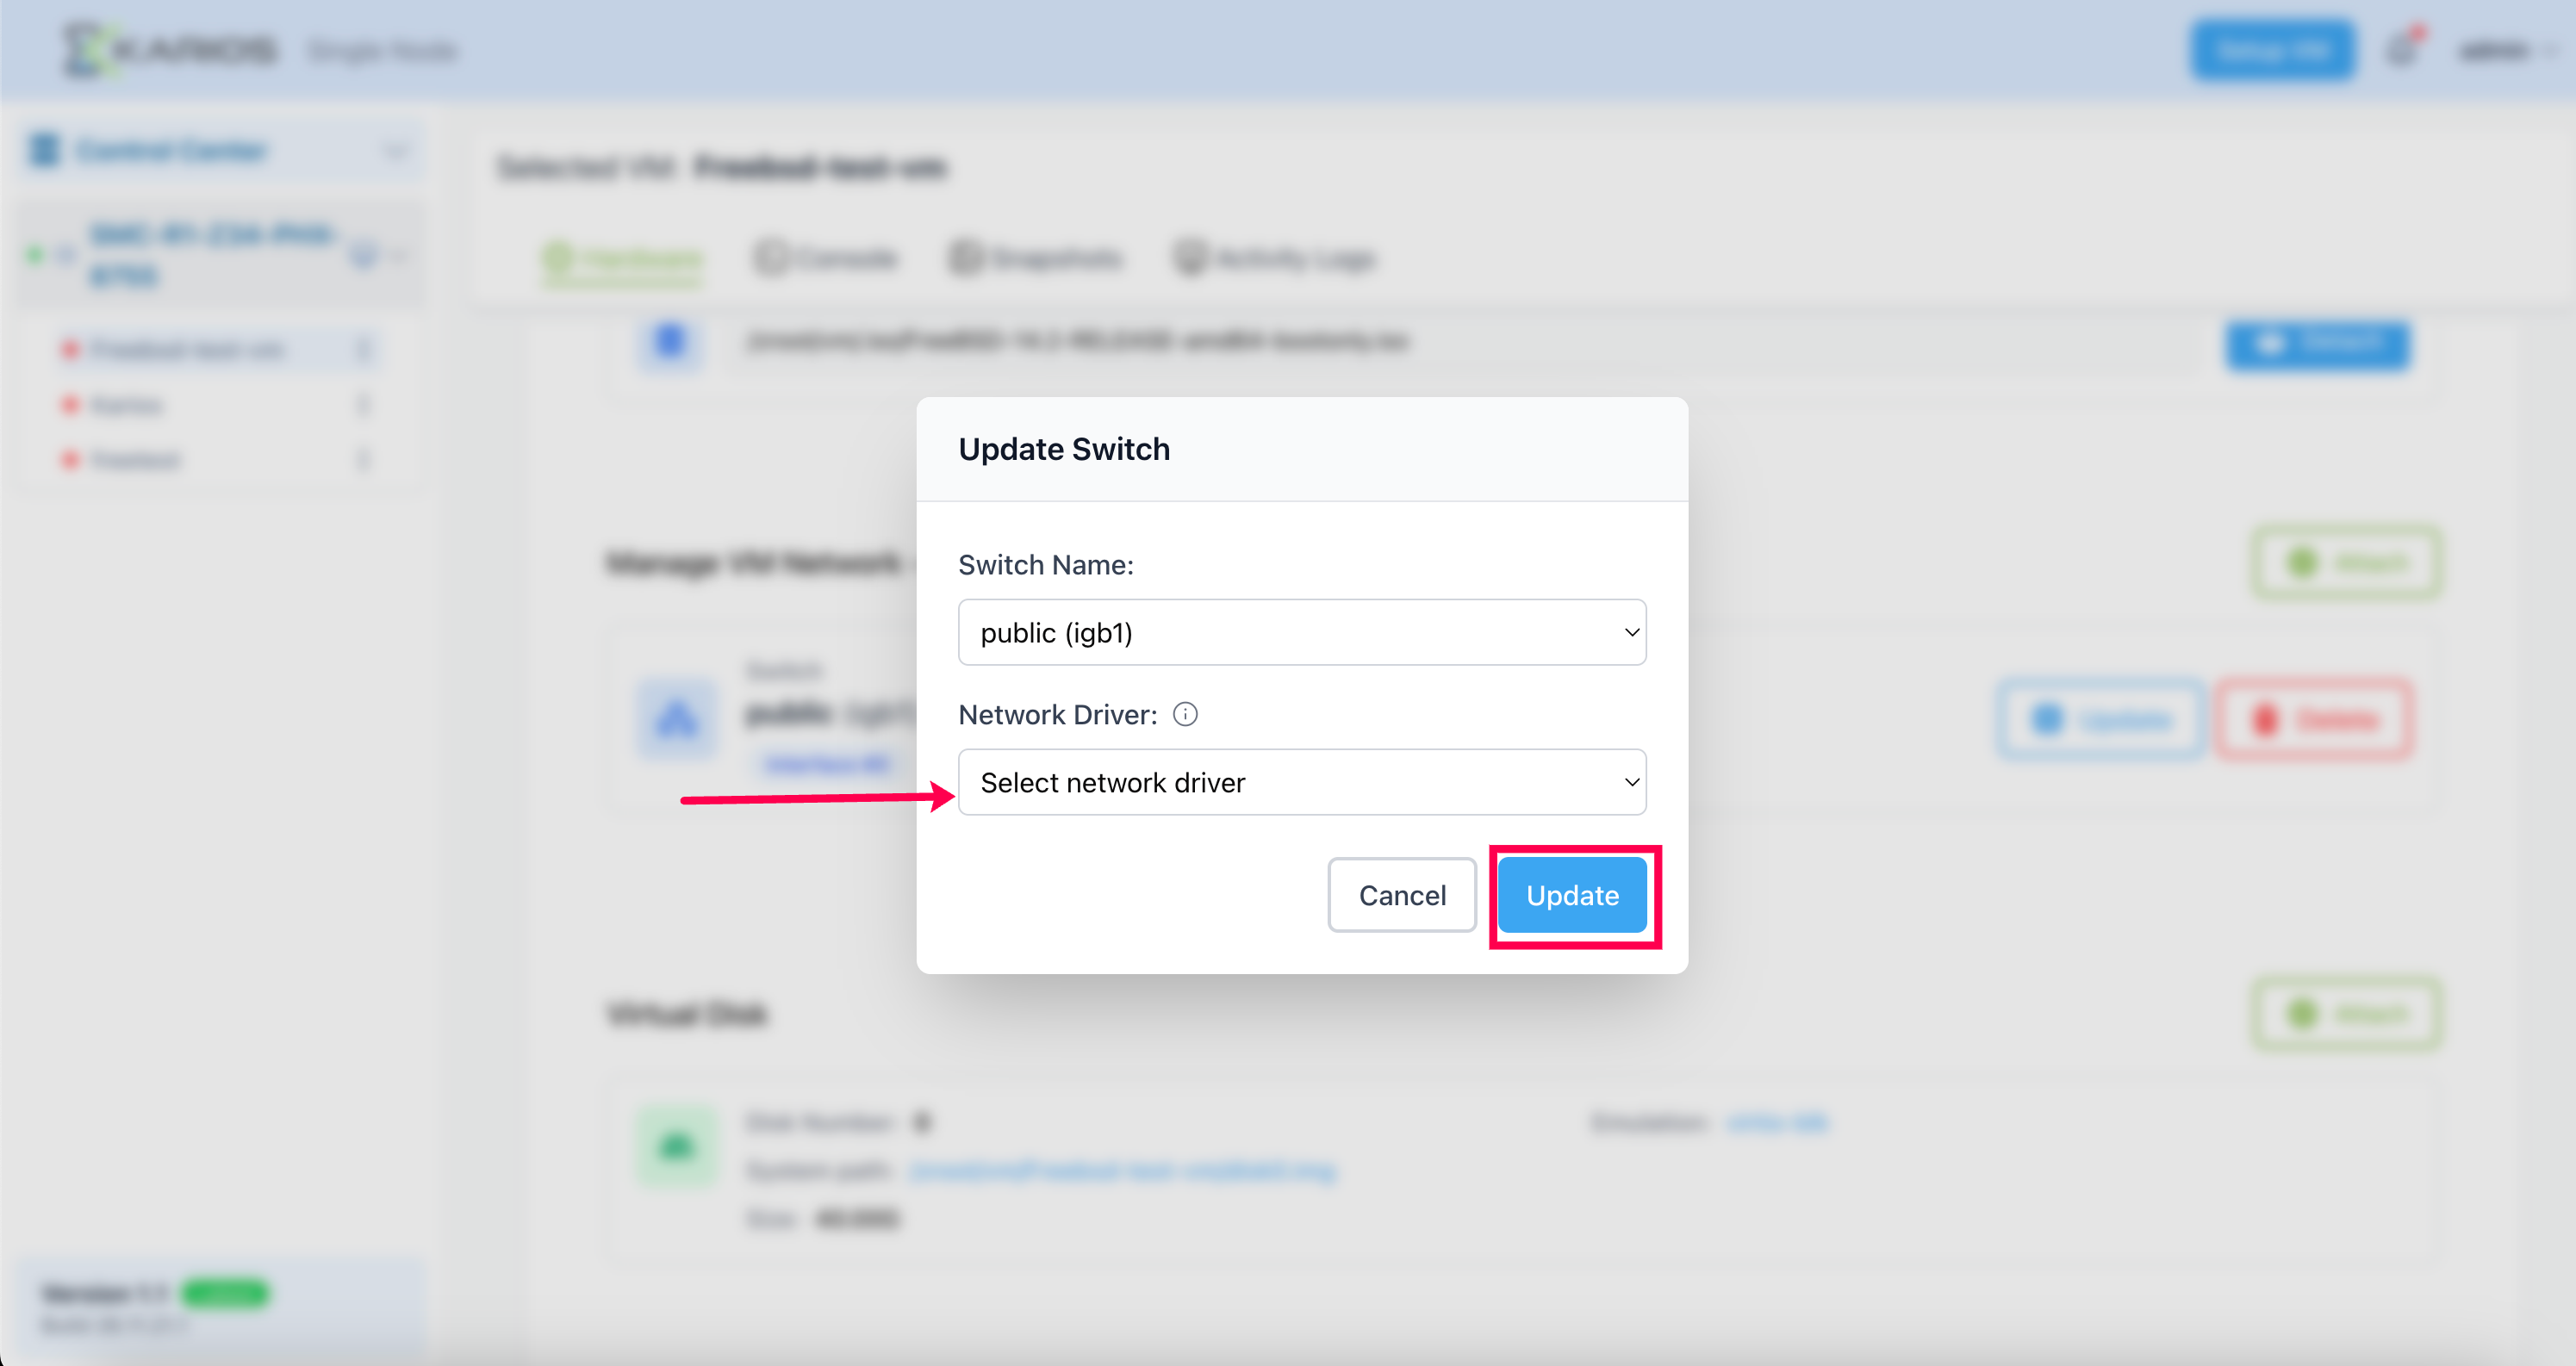
Virtual Disk Management: Attach virtual disks
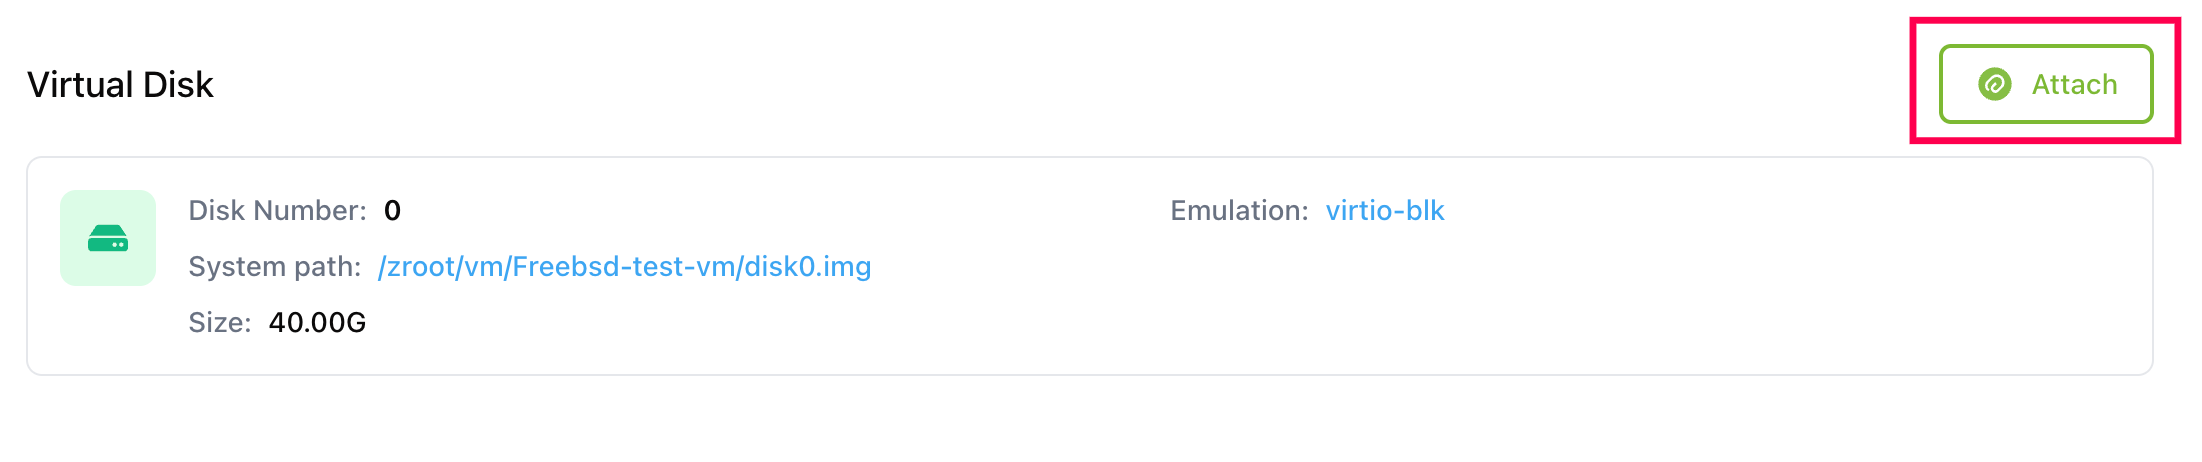
Attach Only Disk:
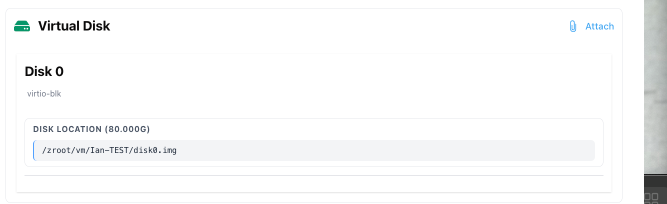
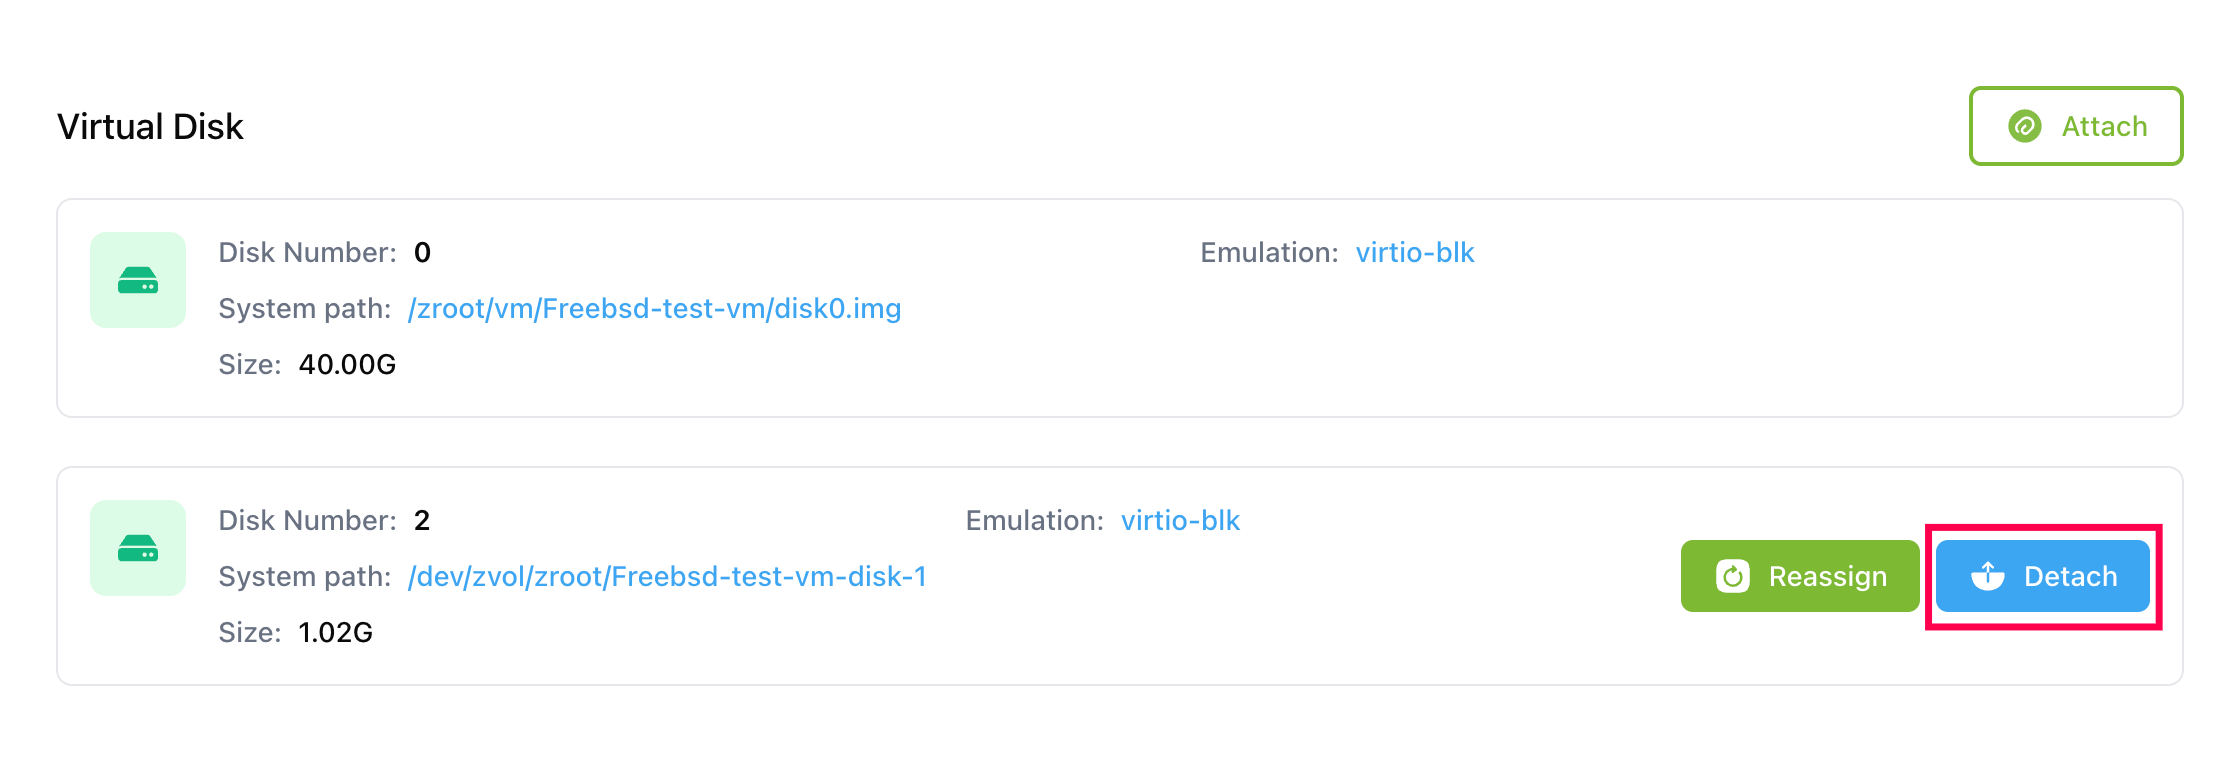
Reassign: Remove the virtual disk from the current vm and assign it to some other available vm in the node.
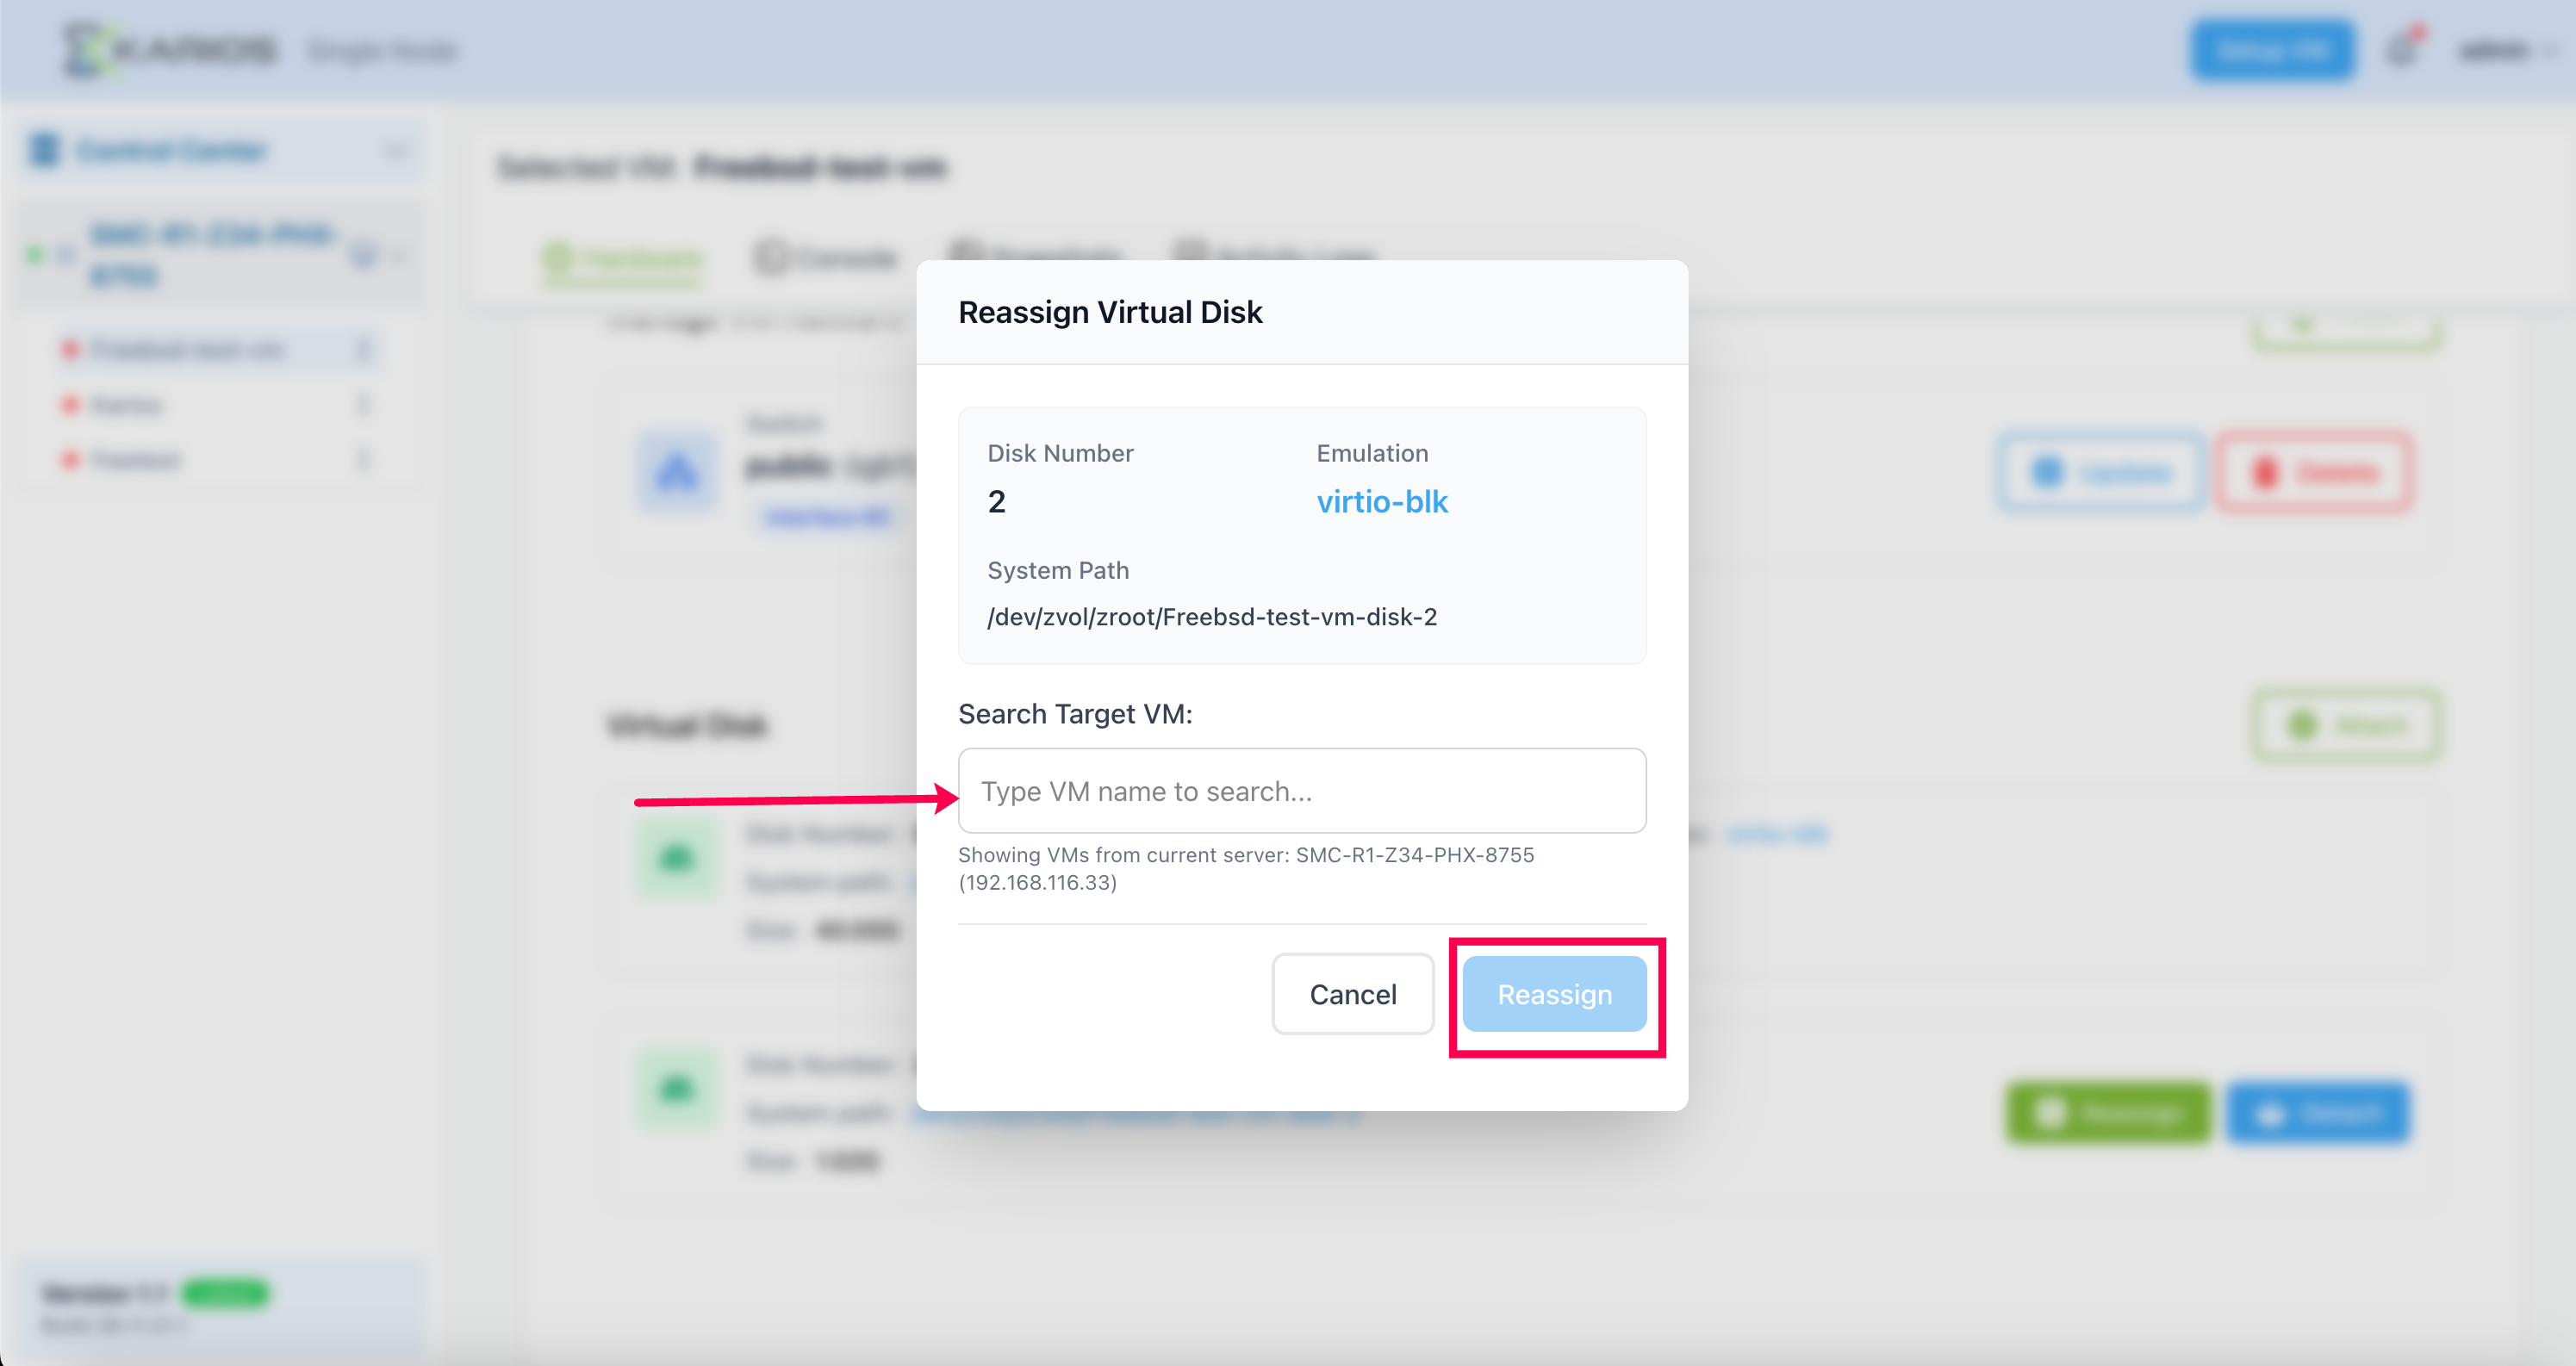
Delete: Delete the unused disk permanently

Attach PCIe Device: Attach PCIe devices like GPU and NIC to the VM. Click on the “Attach” button to attach the PCIe device.
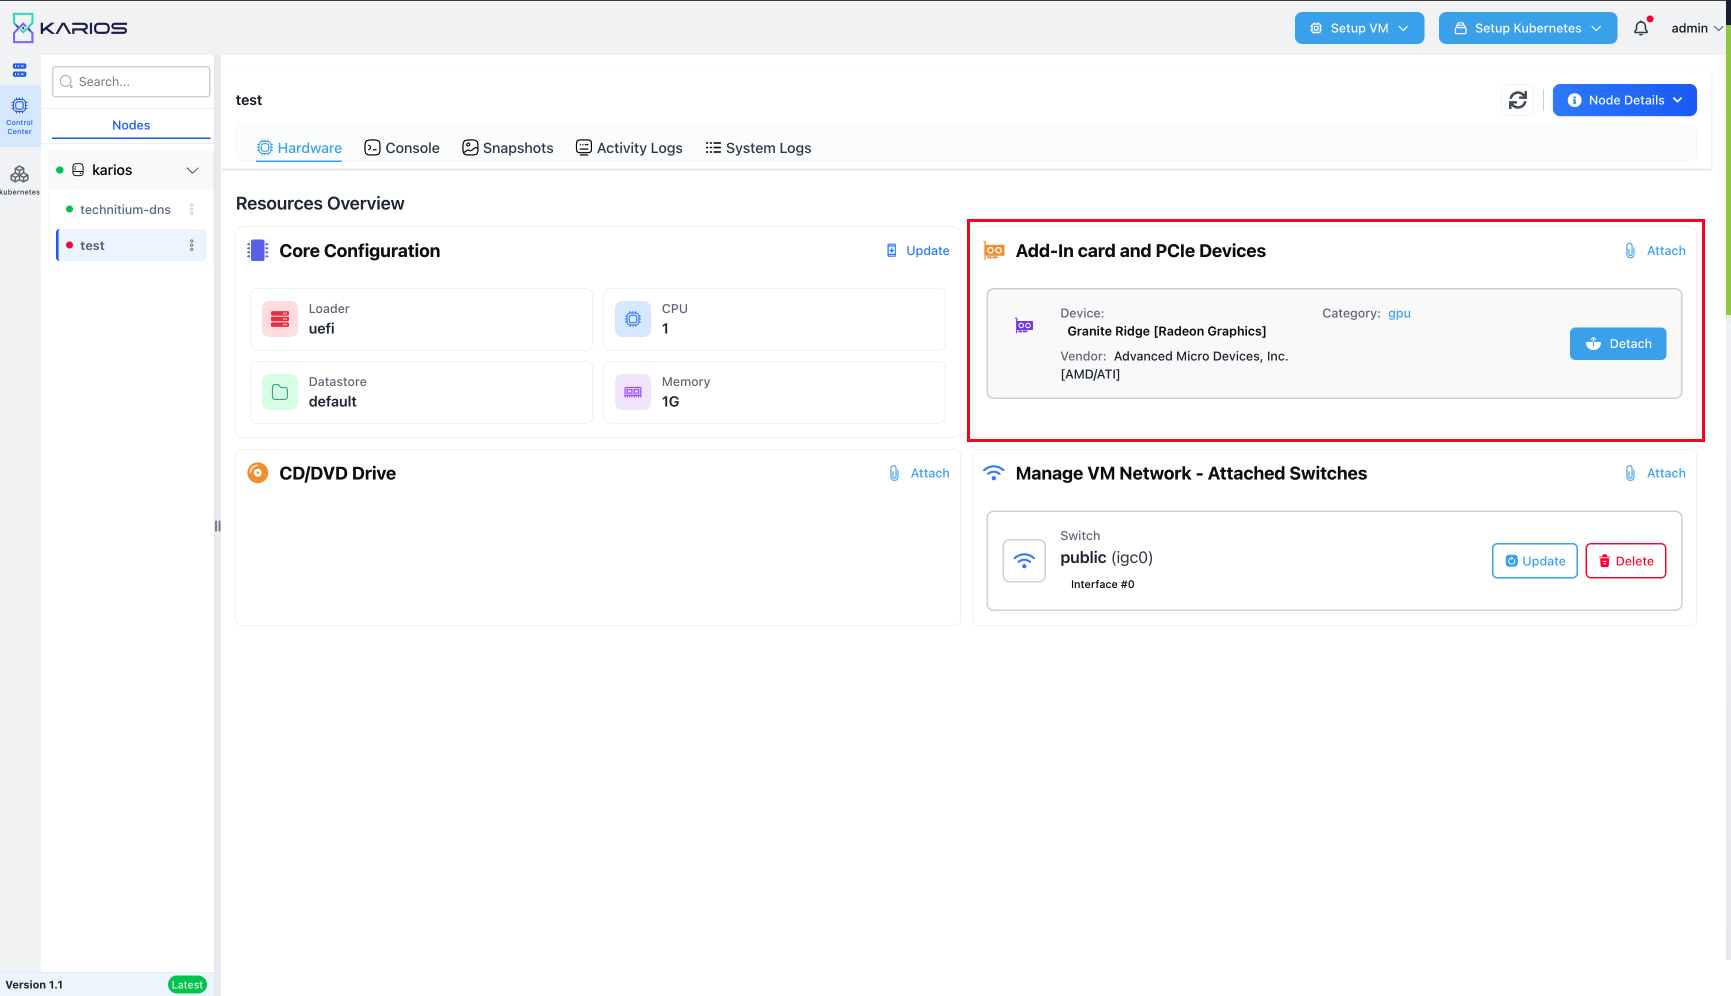
Note
When passing through NVIDIA GPUs to virtual machines running Linux-based operating systems, ensure you blacklist the nouveau driver to prevent conflicts with NVIDIA proprietary drivers.
Select the PCIe devices to attach to the VM and click on the “Attach Devices” button.
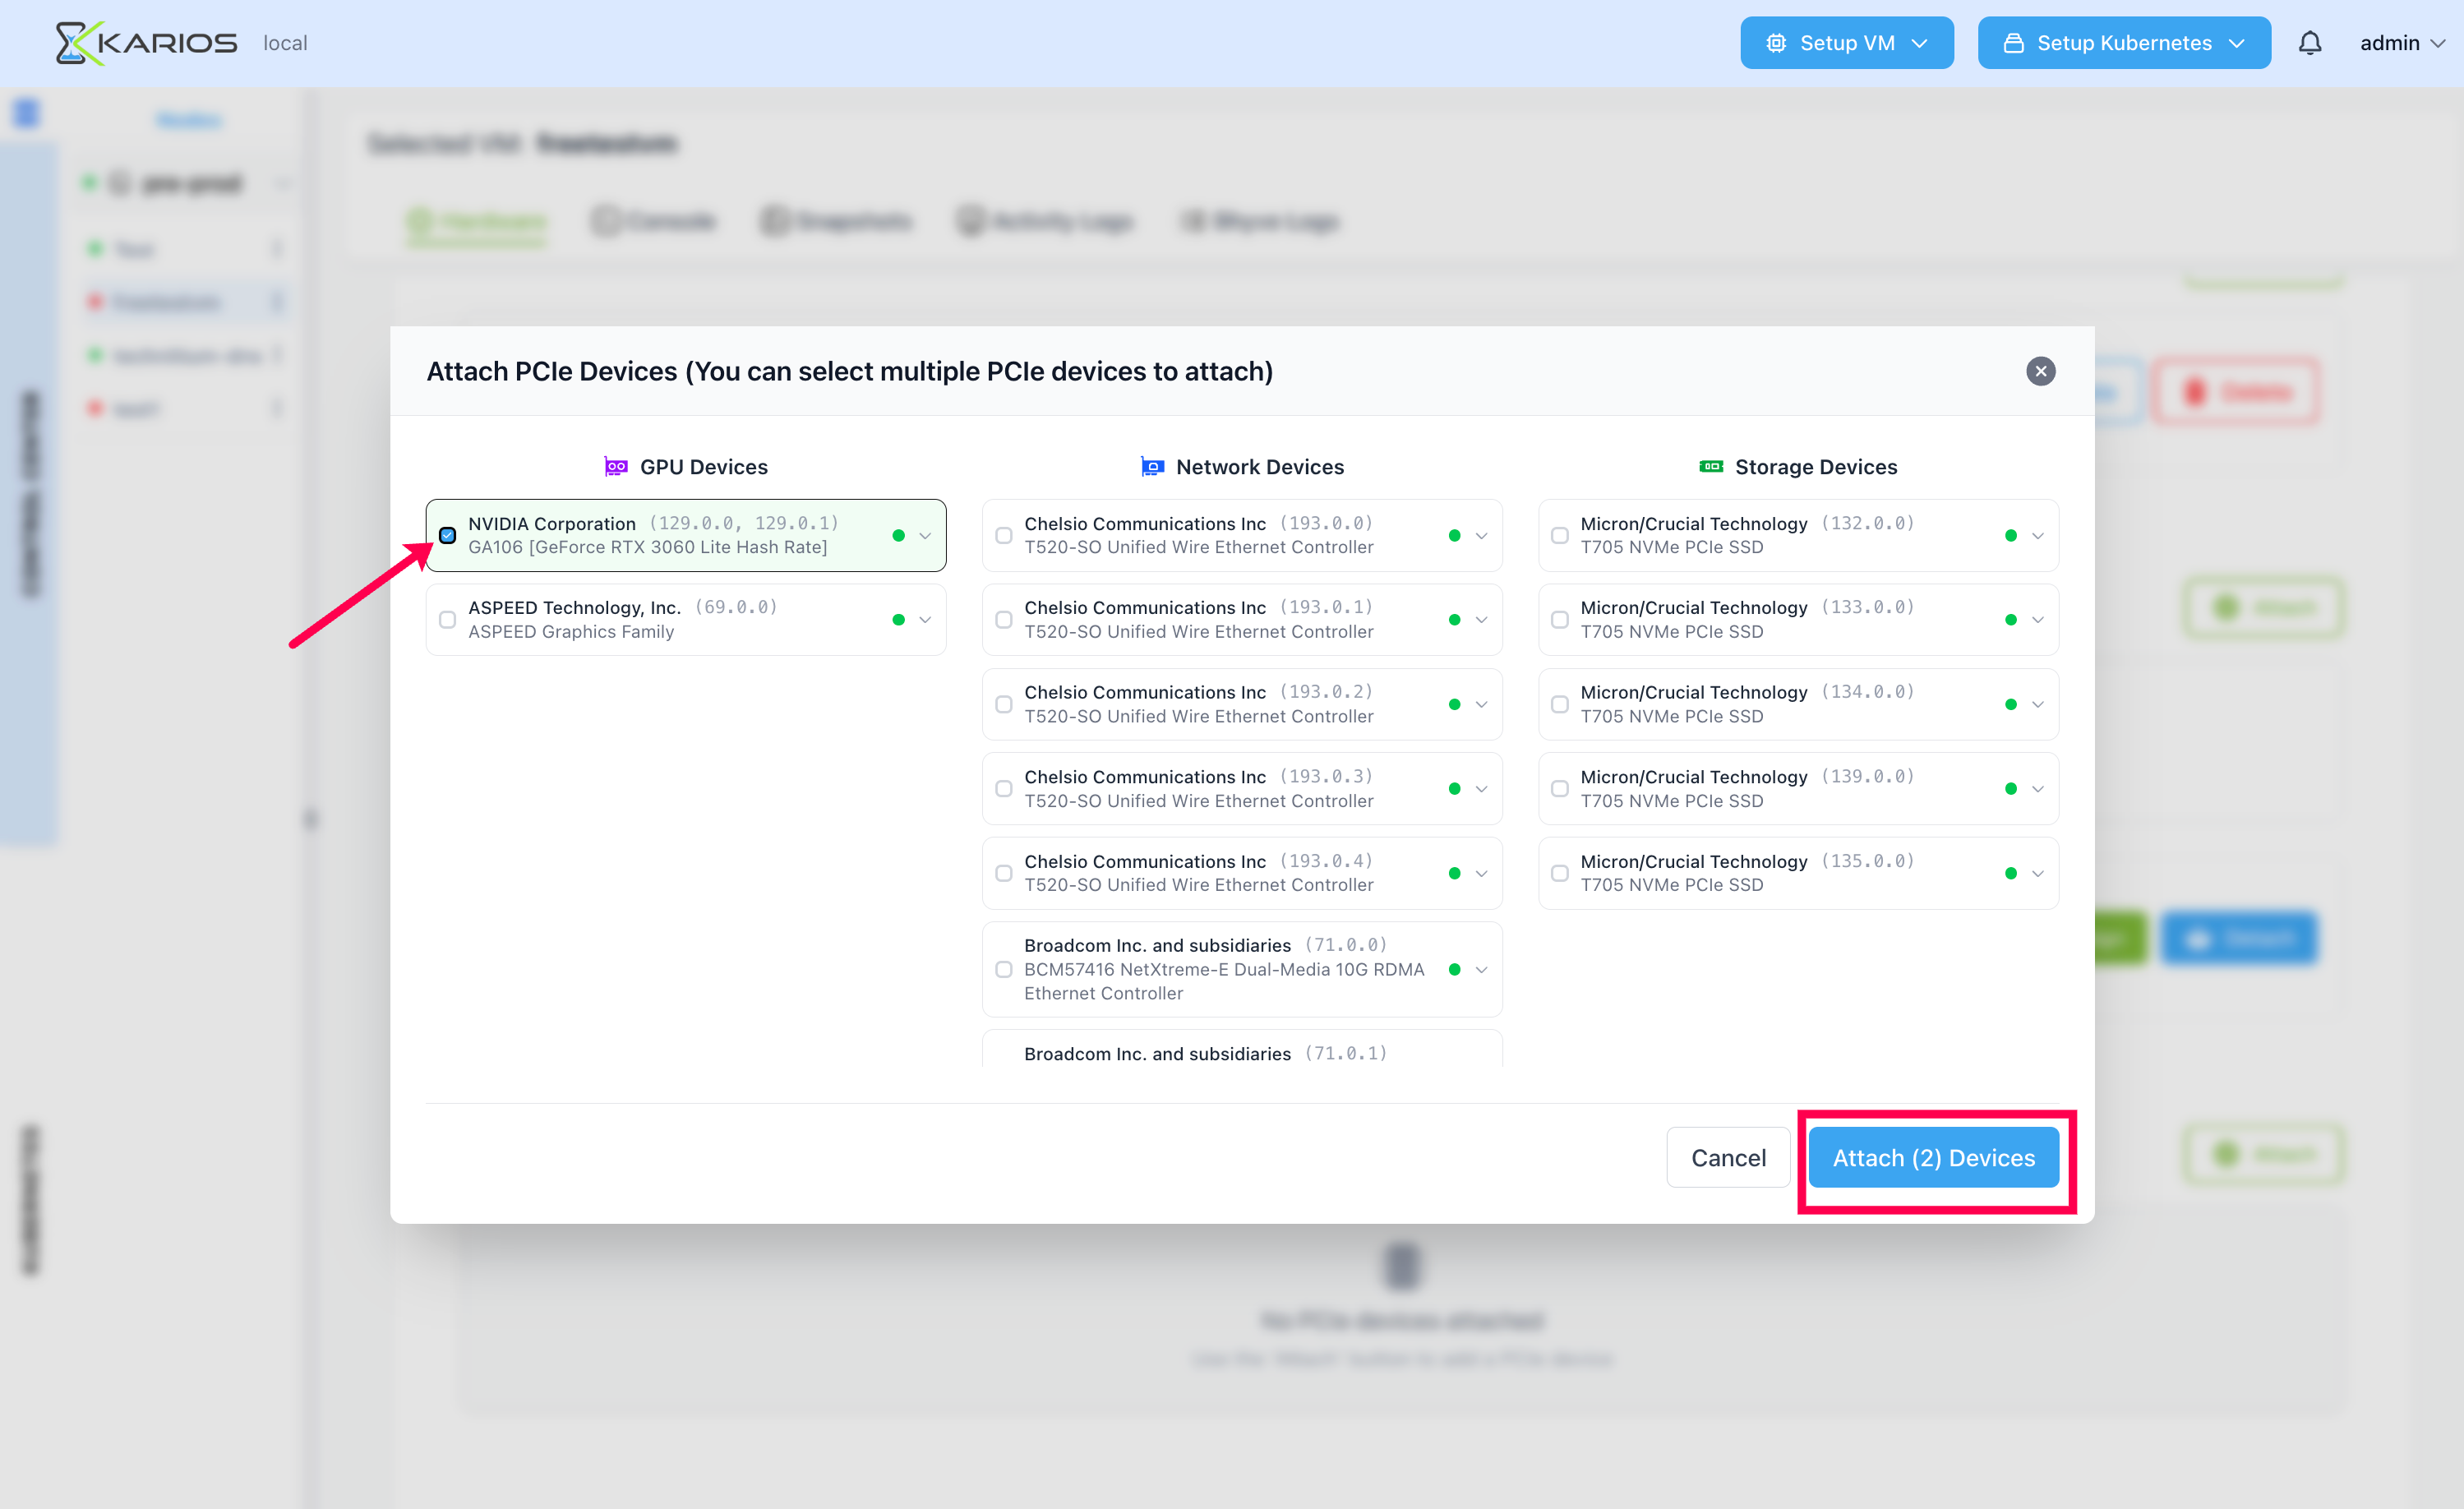
Confirm the PCIe devices to be attached to the VM. Click on the “Attach Devices” button to proceed.
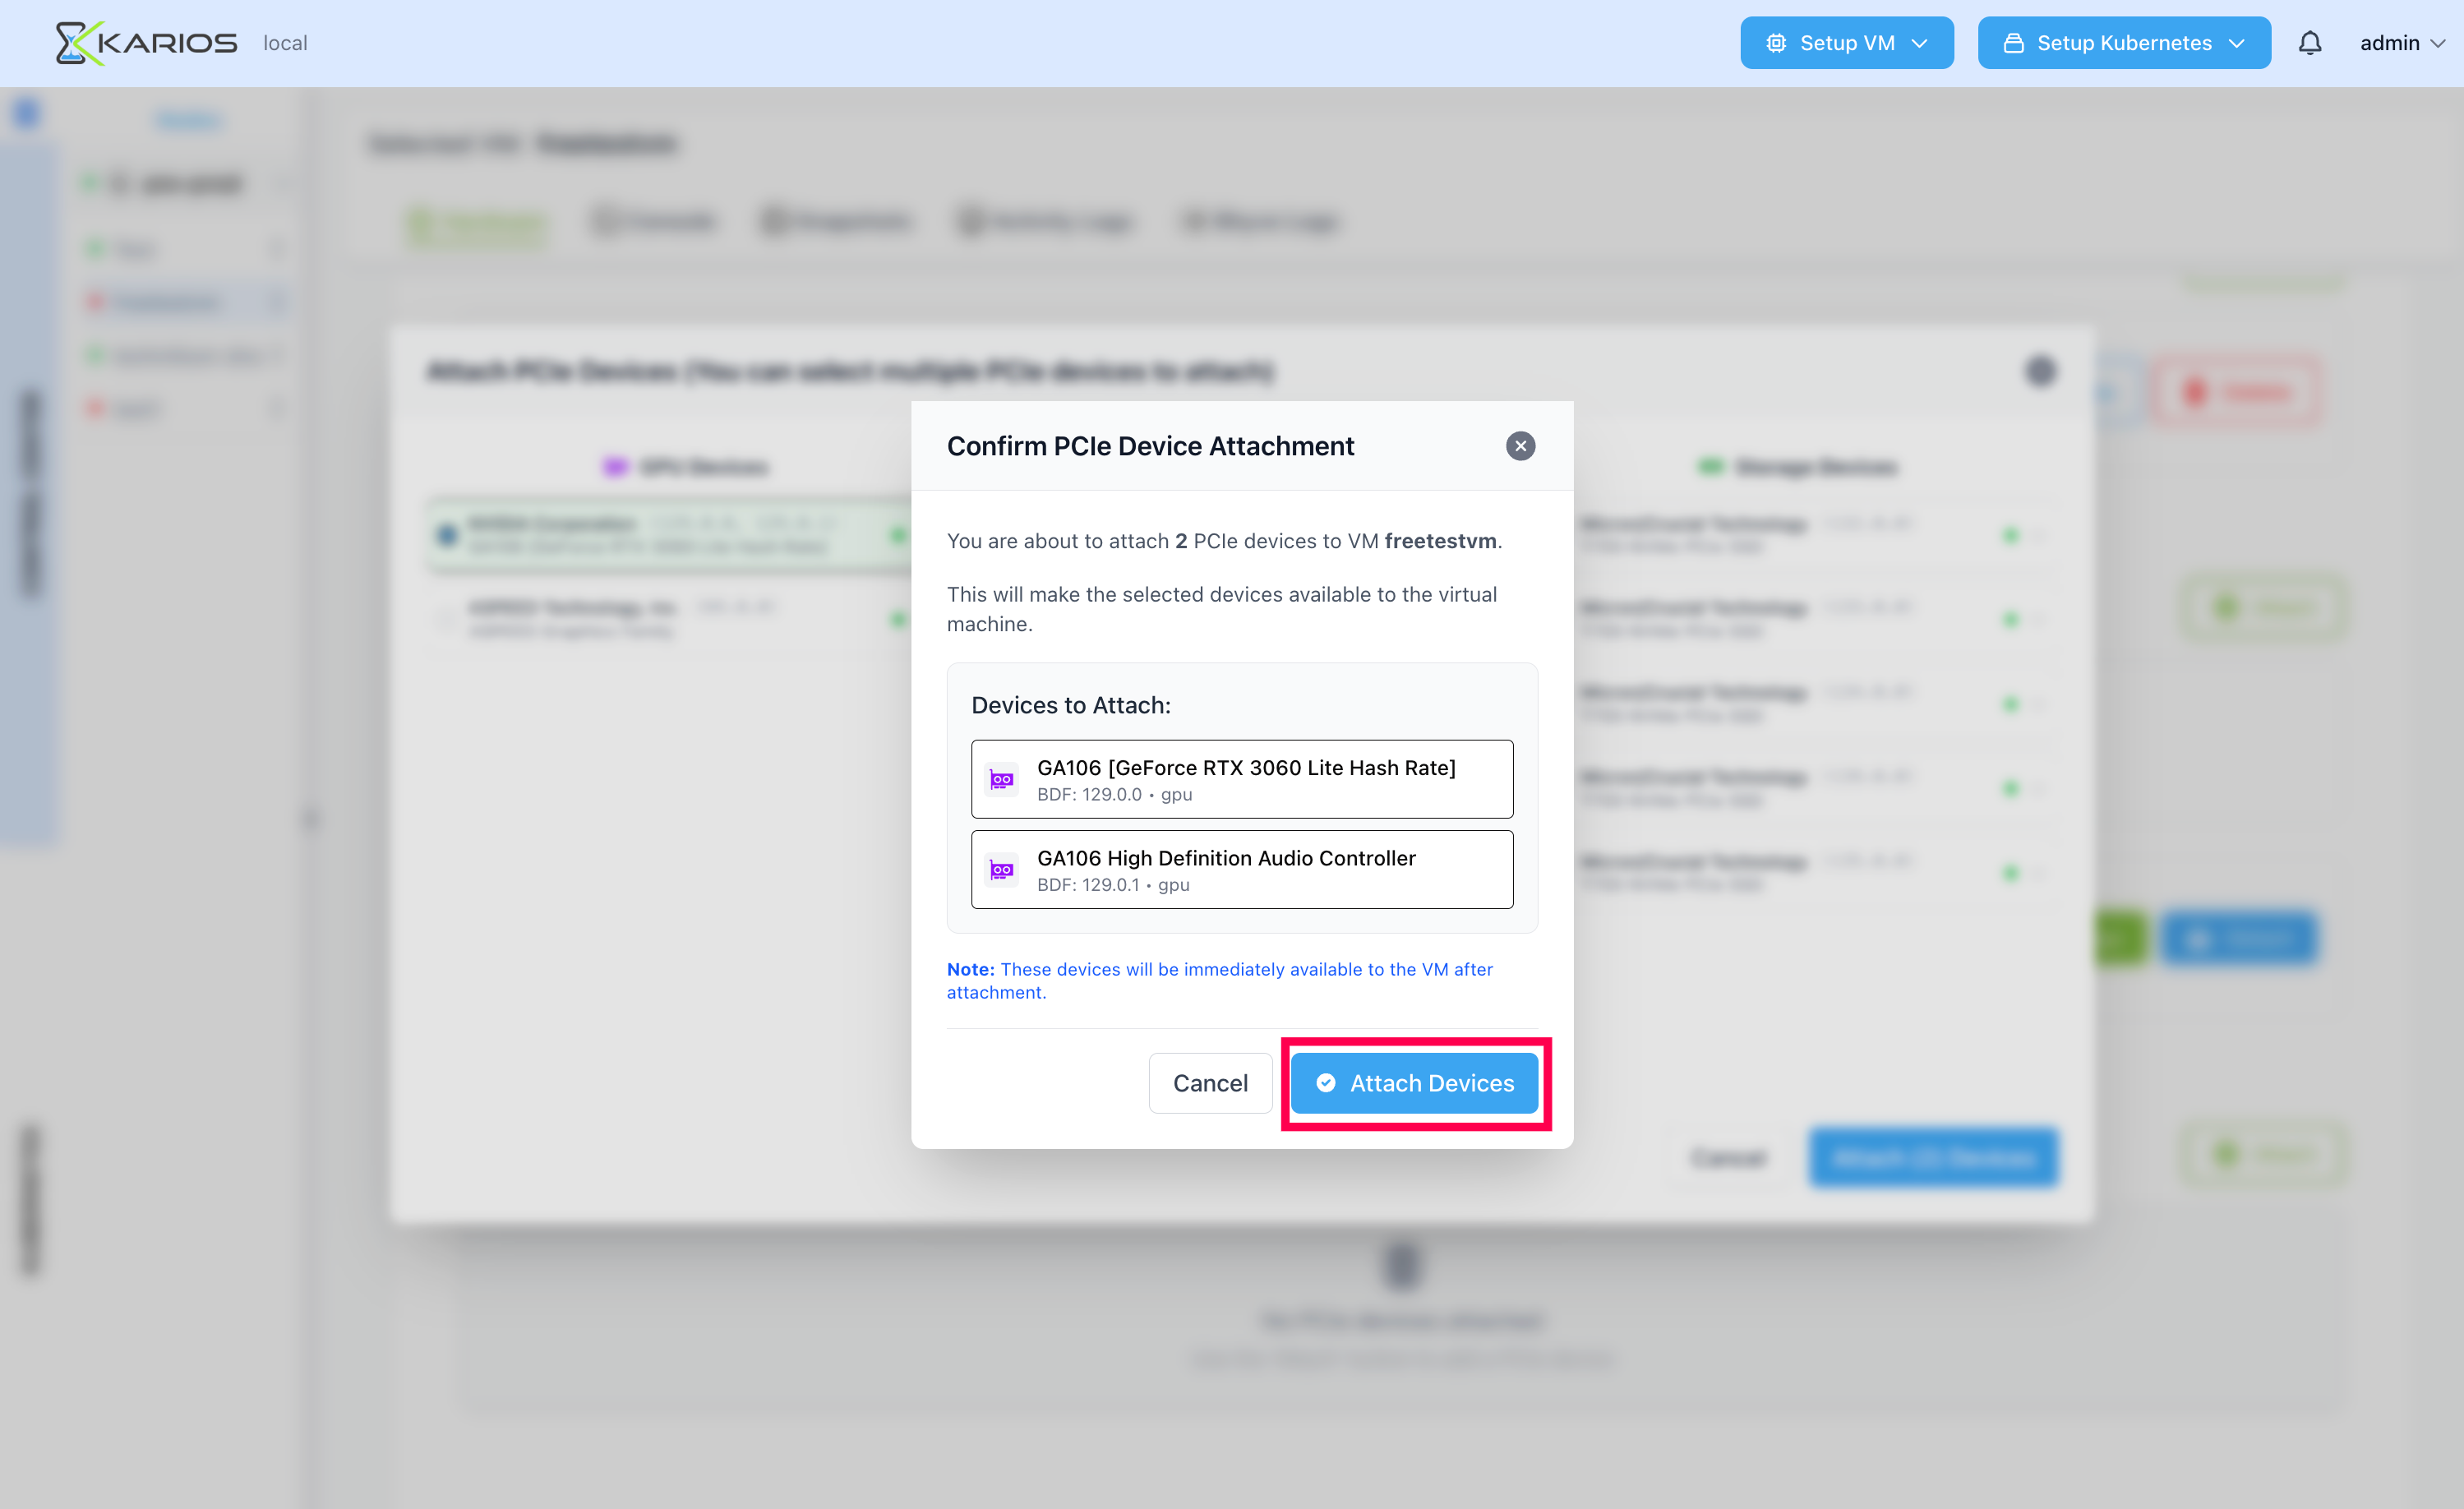
Attached devices will be listed in the Hardware tab.
Detach PCIe Device: Detach the PCIe devices from the VM. Click on the “detach” button to detach the PCIe device.
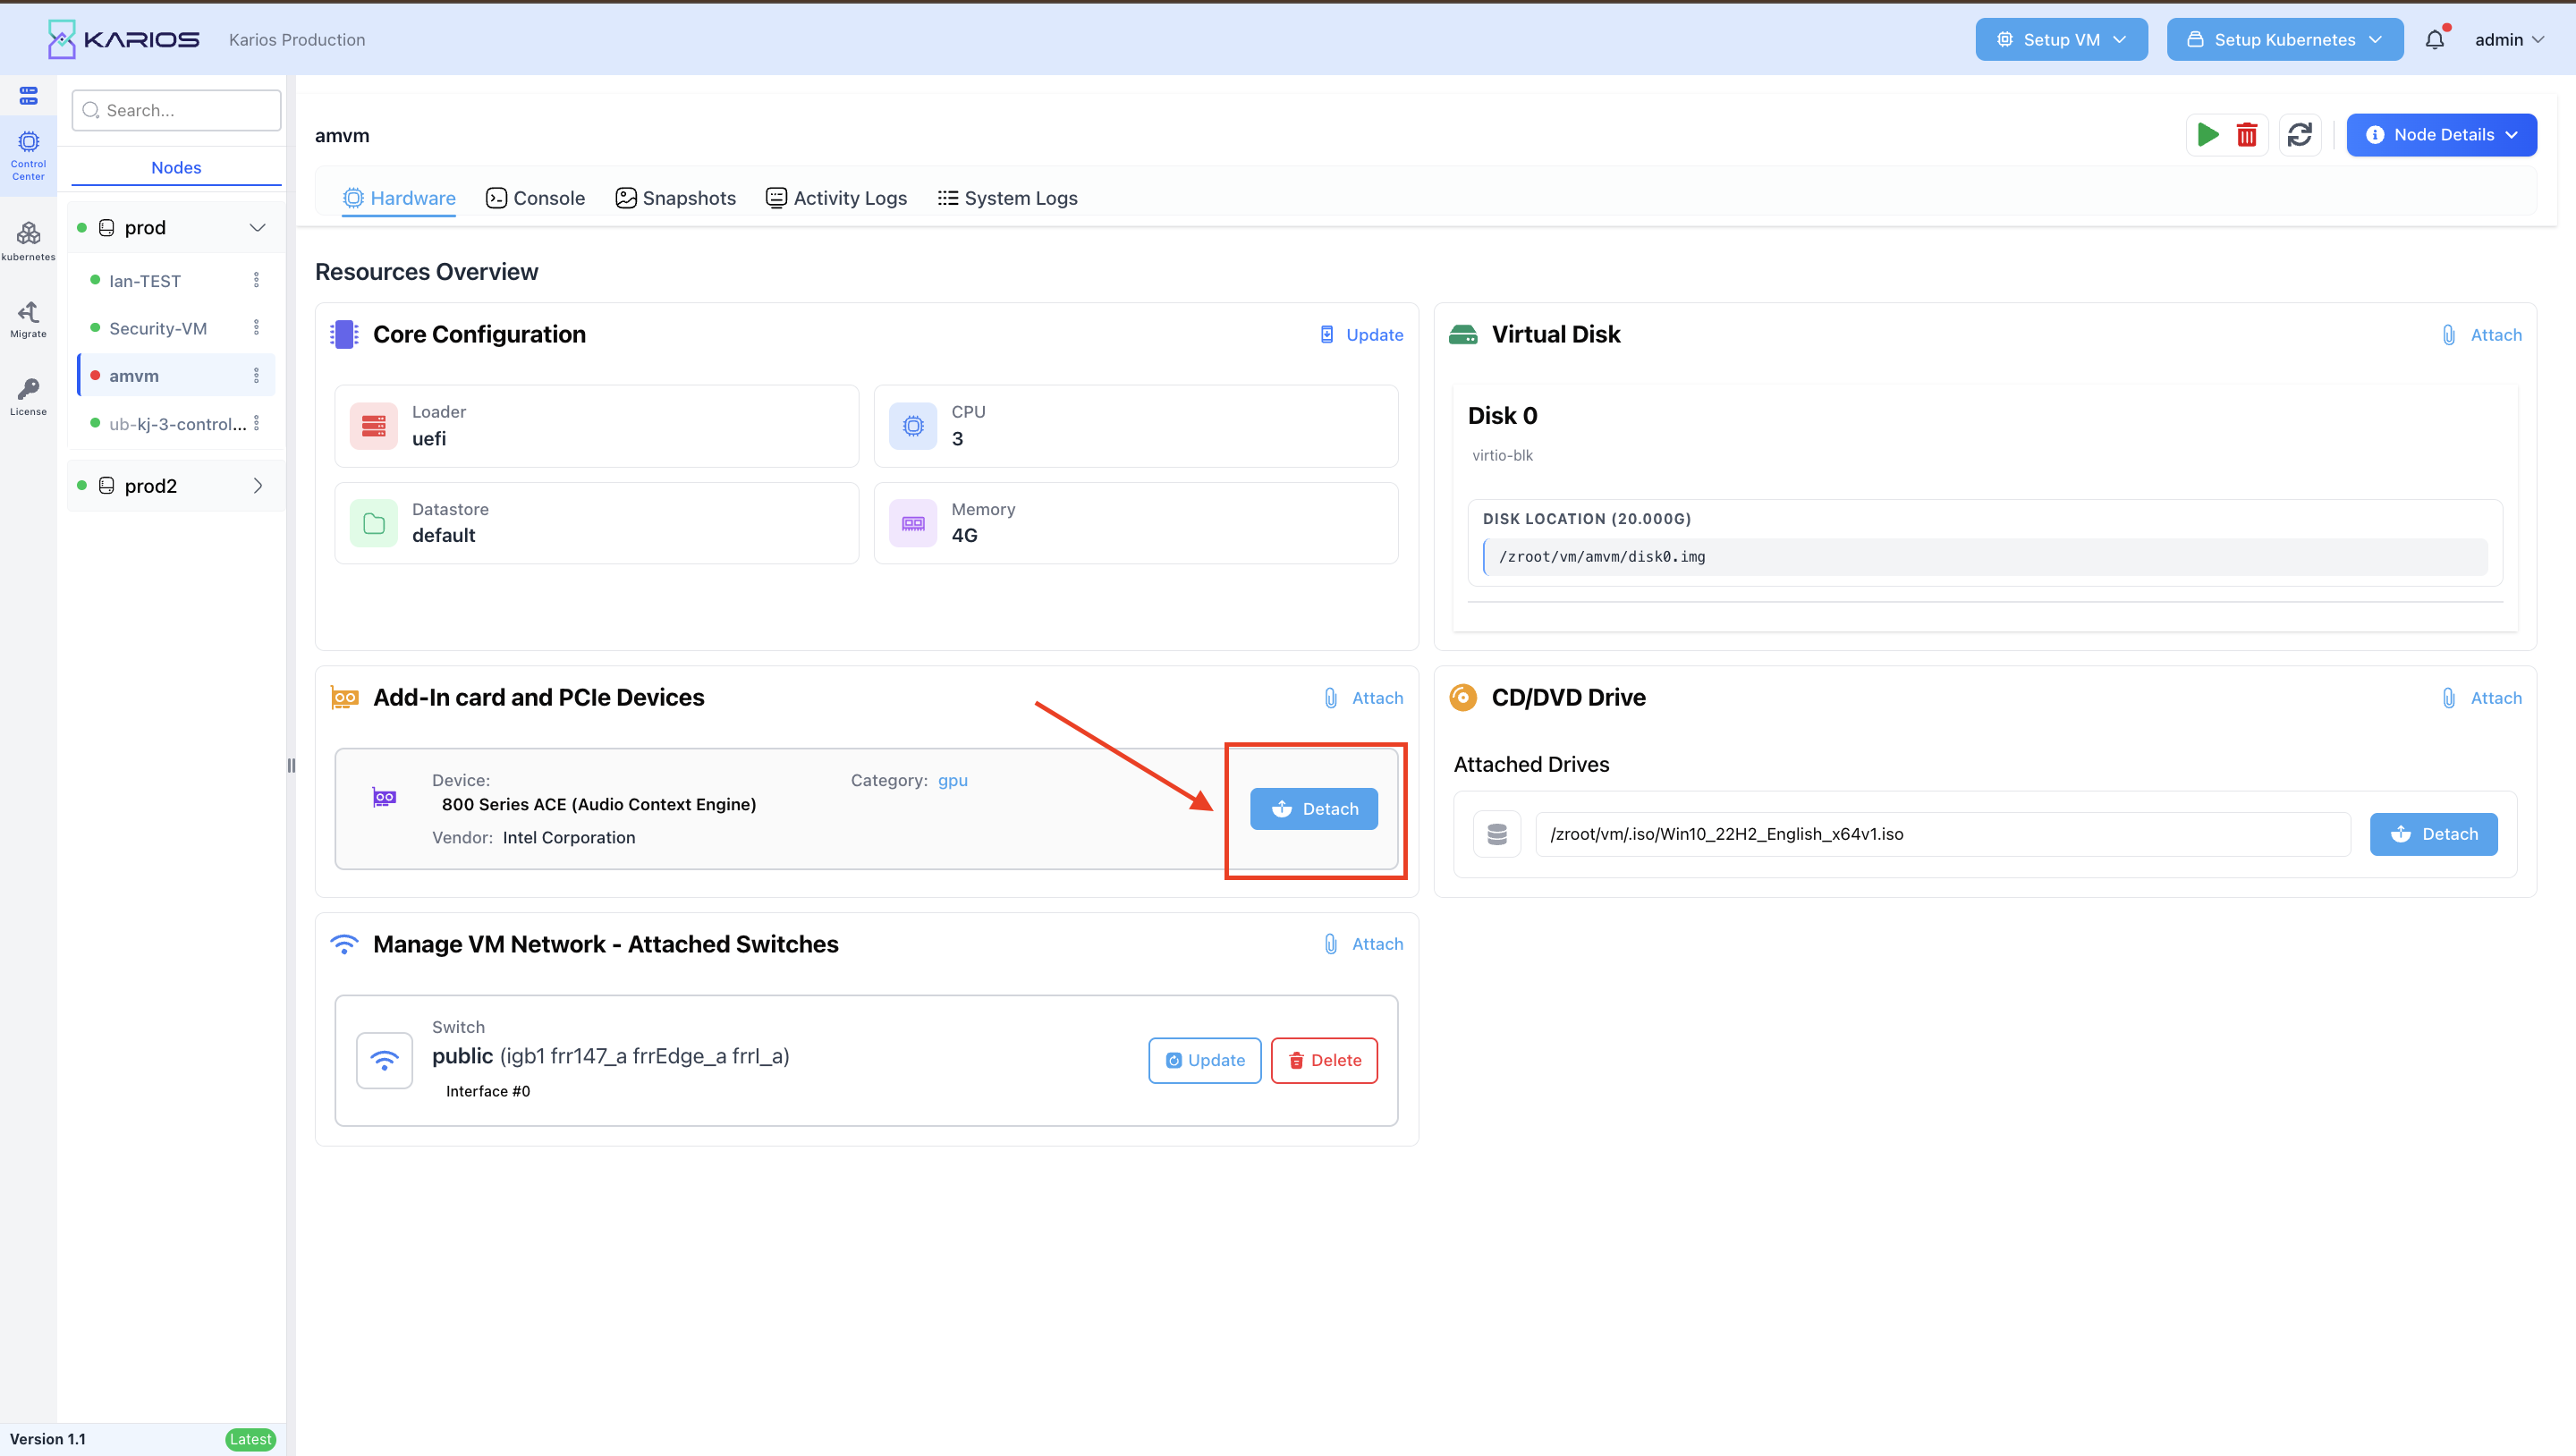
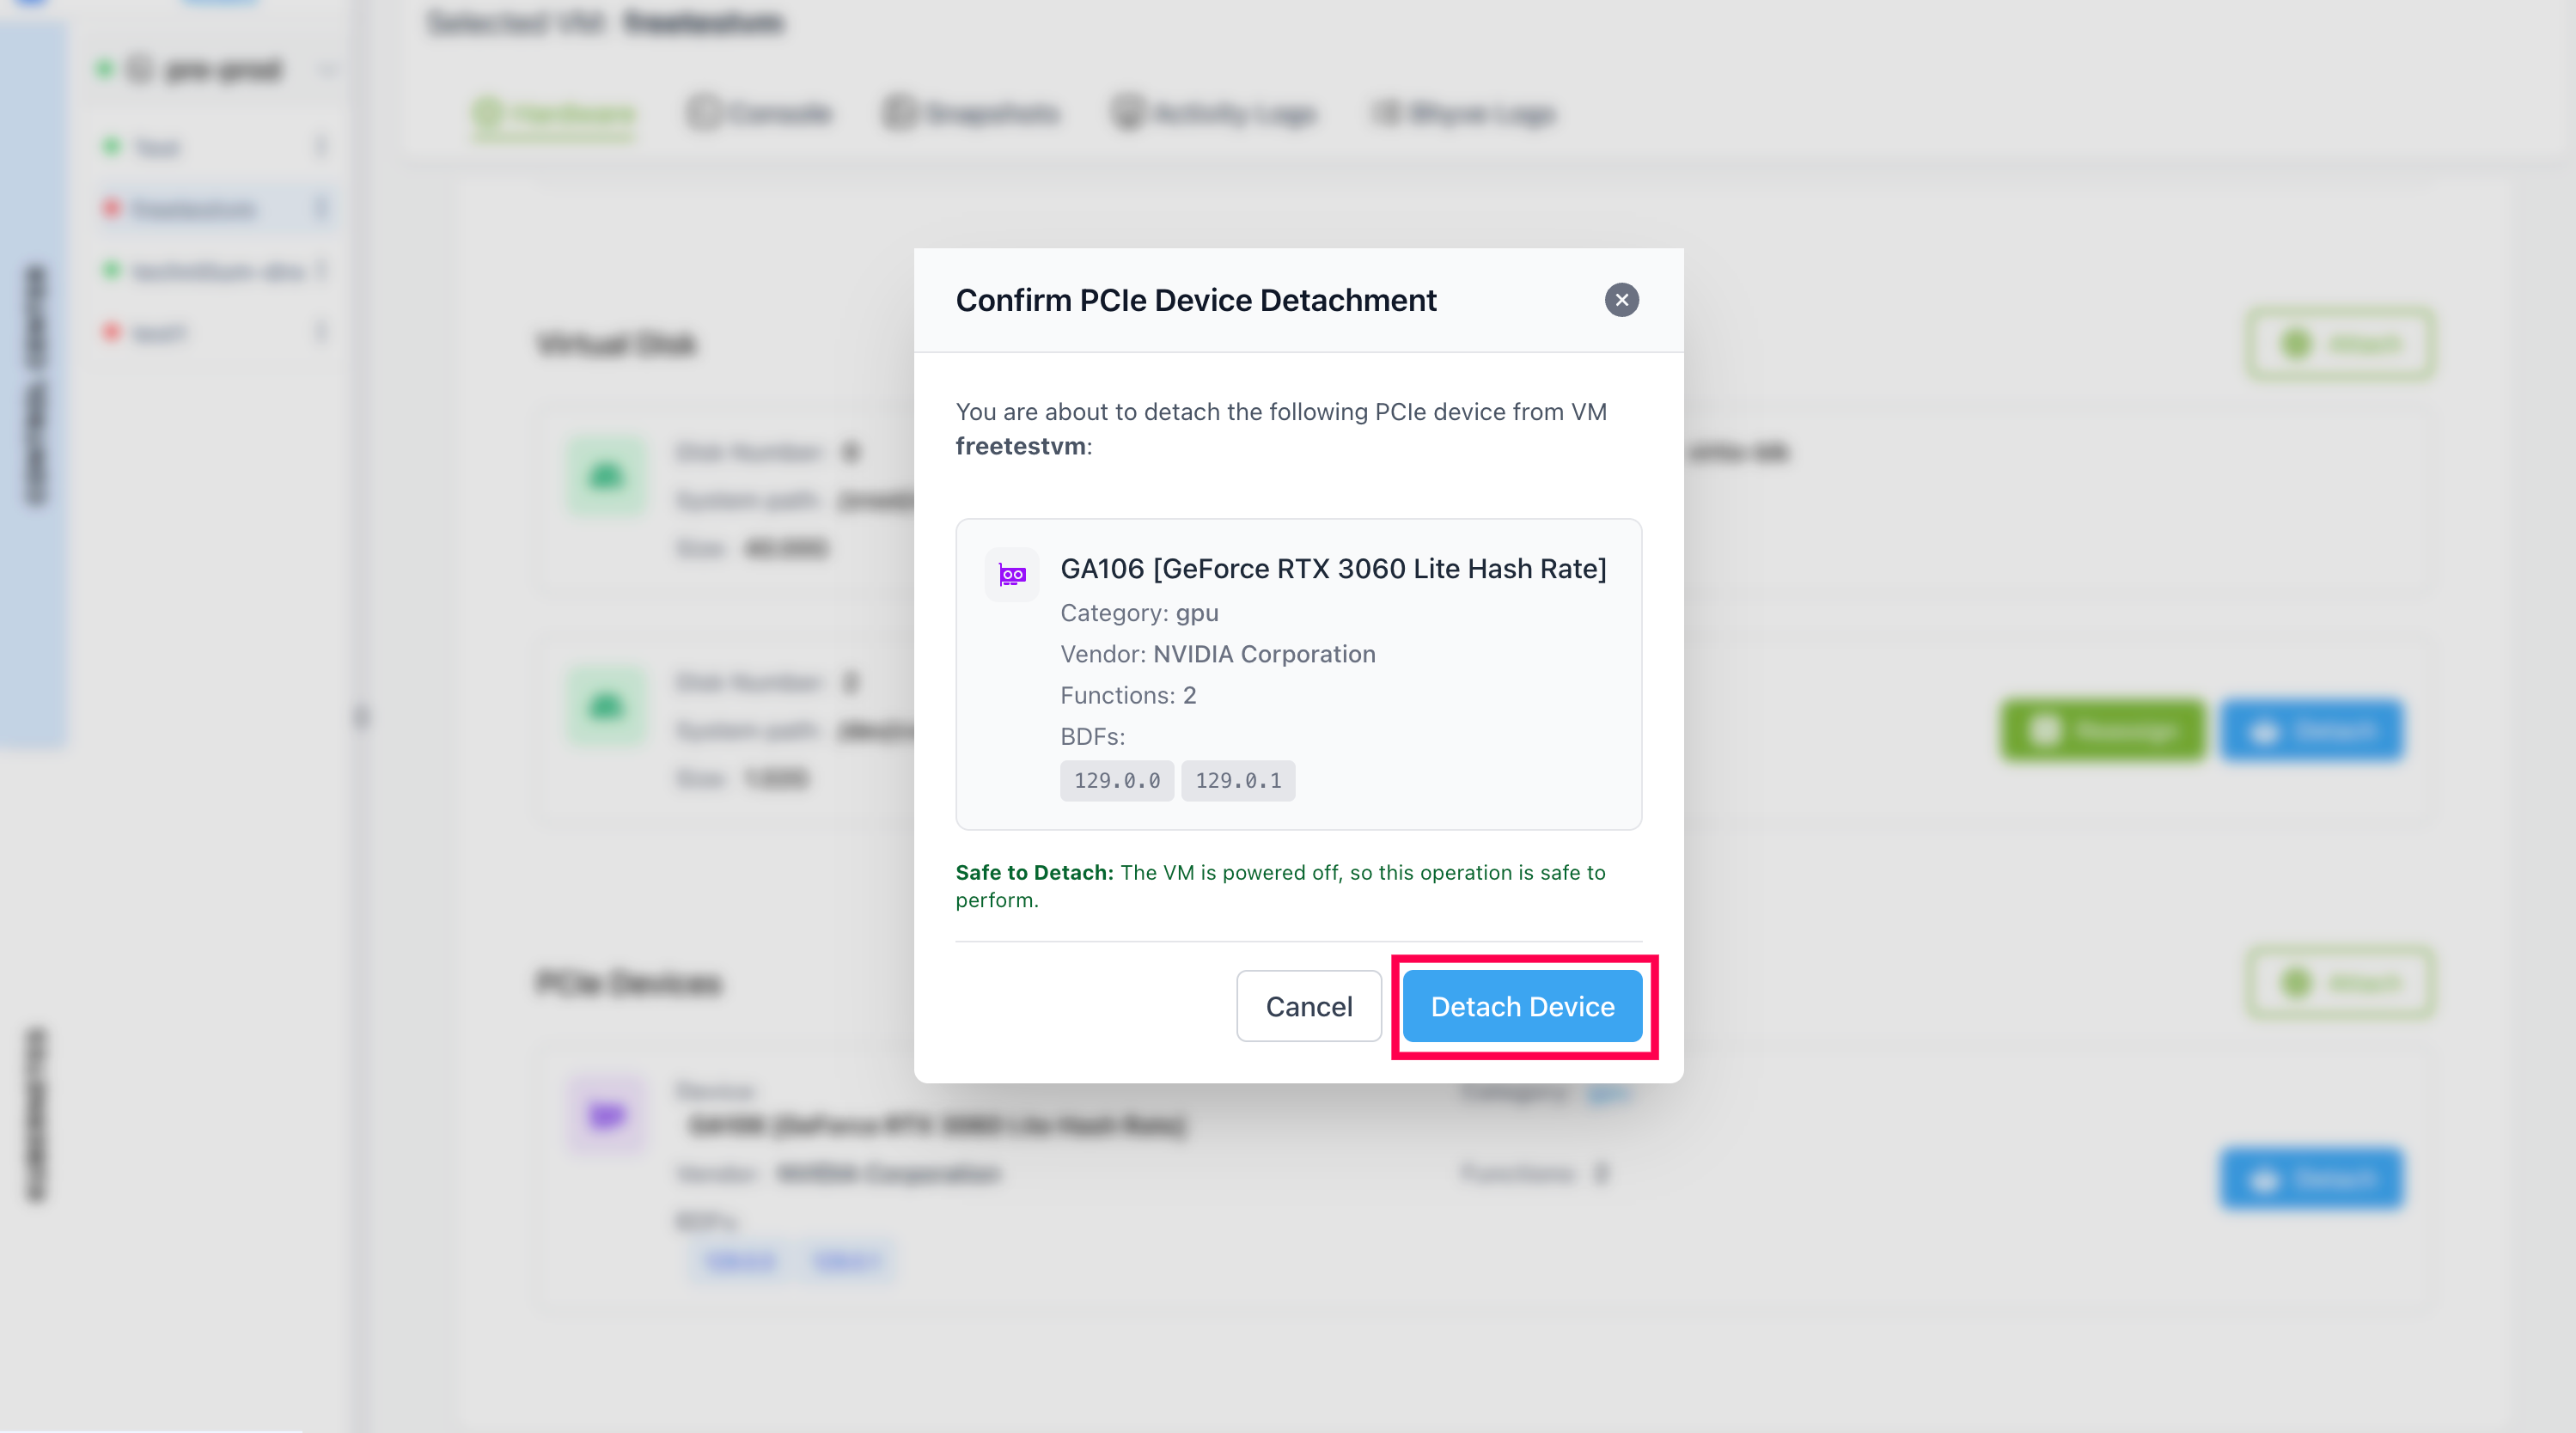
VM Power Operations
Standard VM management operations include:
Start: Power on the virtual machine
Stop: Gracefully shut down the virtual machine
Restart: Reboot virtual machine
Reset: Force restart the virtual machine
Rename: Create a new name for the virtual machine
Power Off: Force power off the virtual machine
Clone: Create VM copies for testing or deployment
Snapshot: Create point-in-time VM snapshots
Delete: Remove the virtual machine permanently
VM Console Access
The Console tab provides direct browser-based access to the VM’s operating system:
Direct Console Access: Interact with the VM through a web-based console interface
Remote Management: Perform administrative tasks and troubleshooting directly from your browser
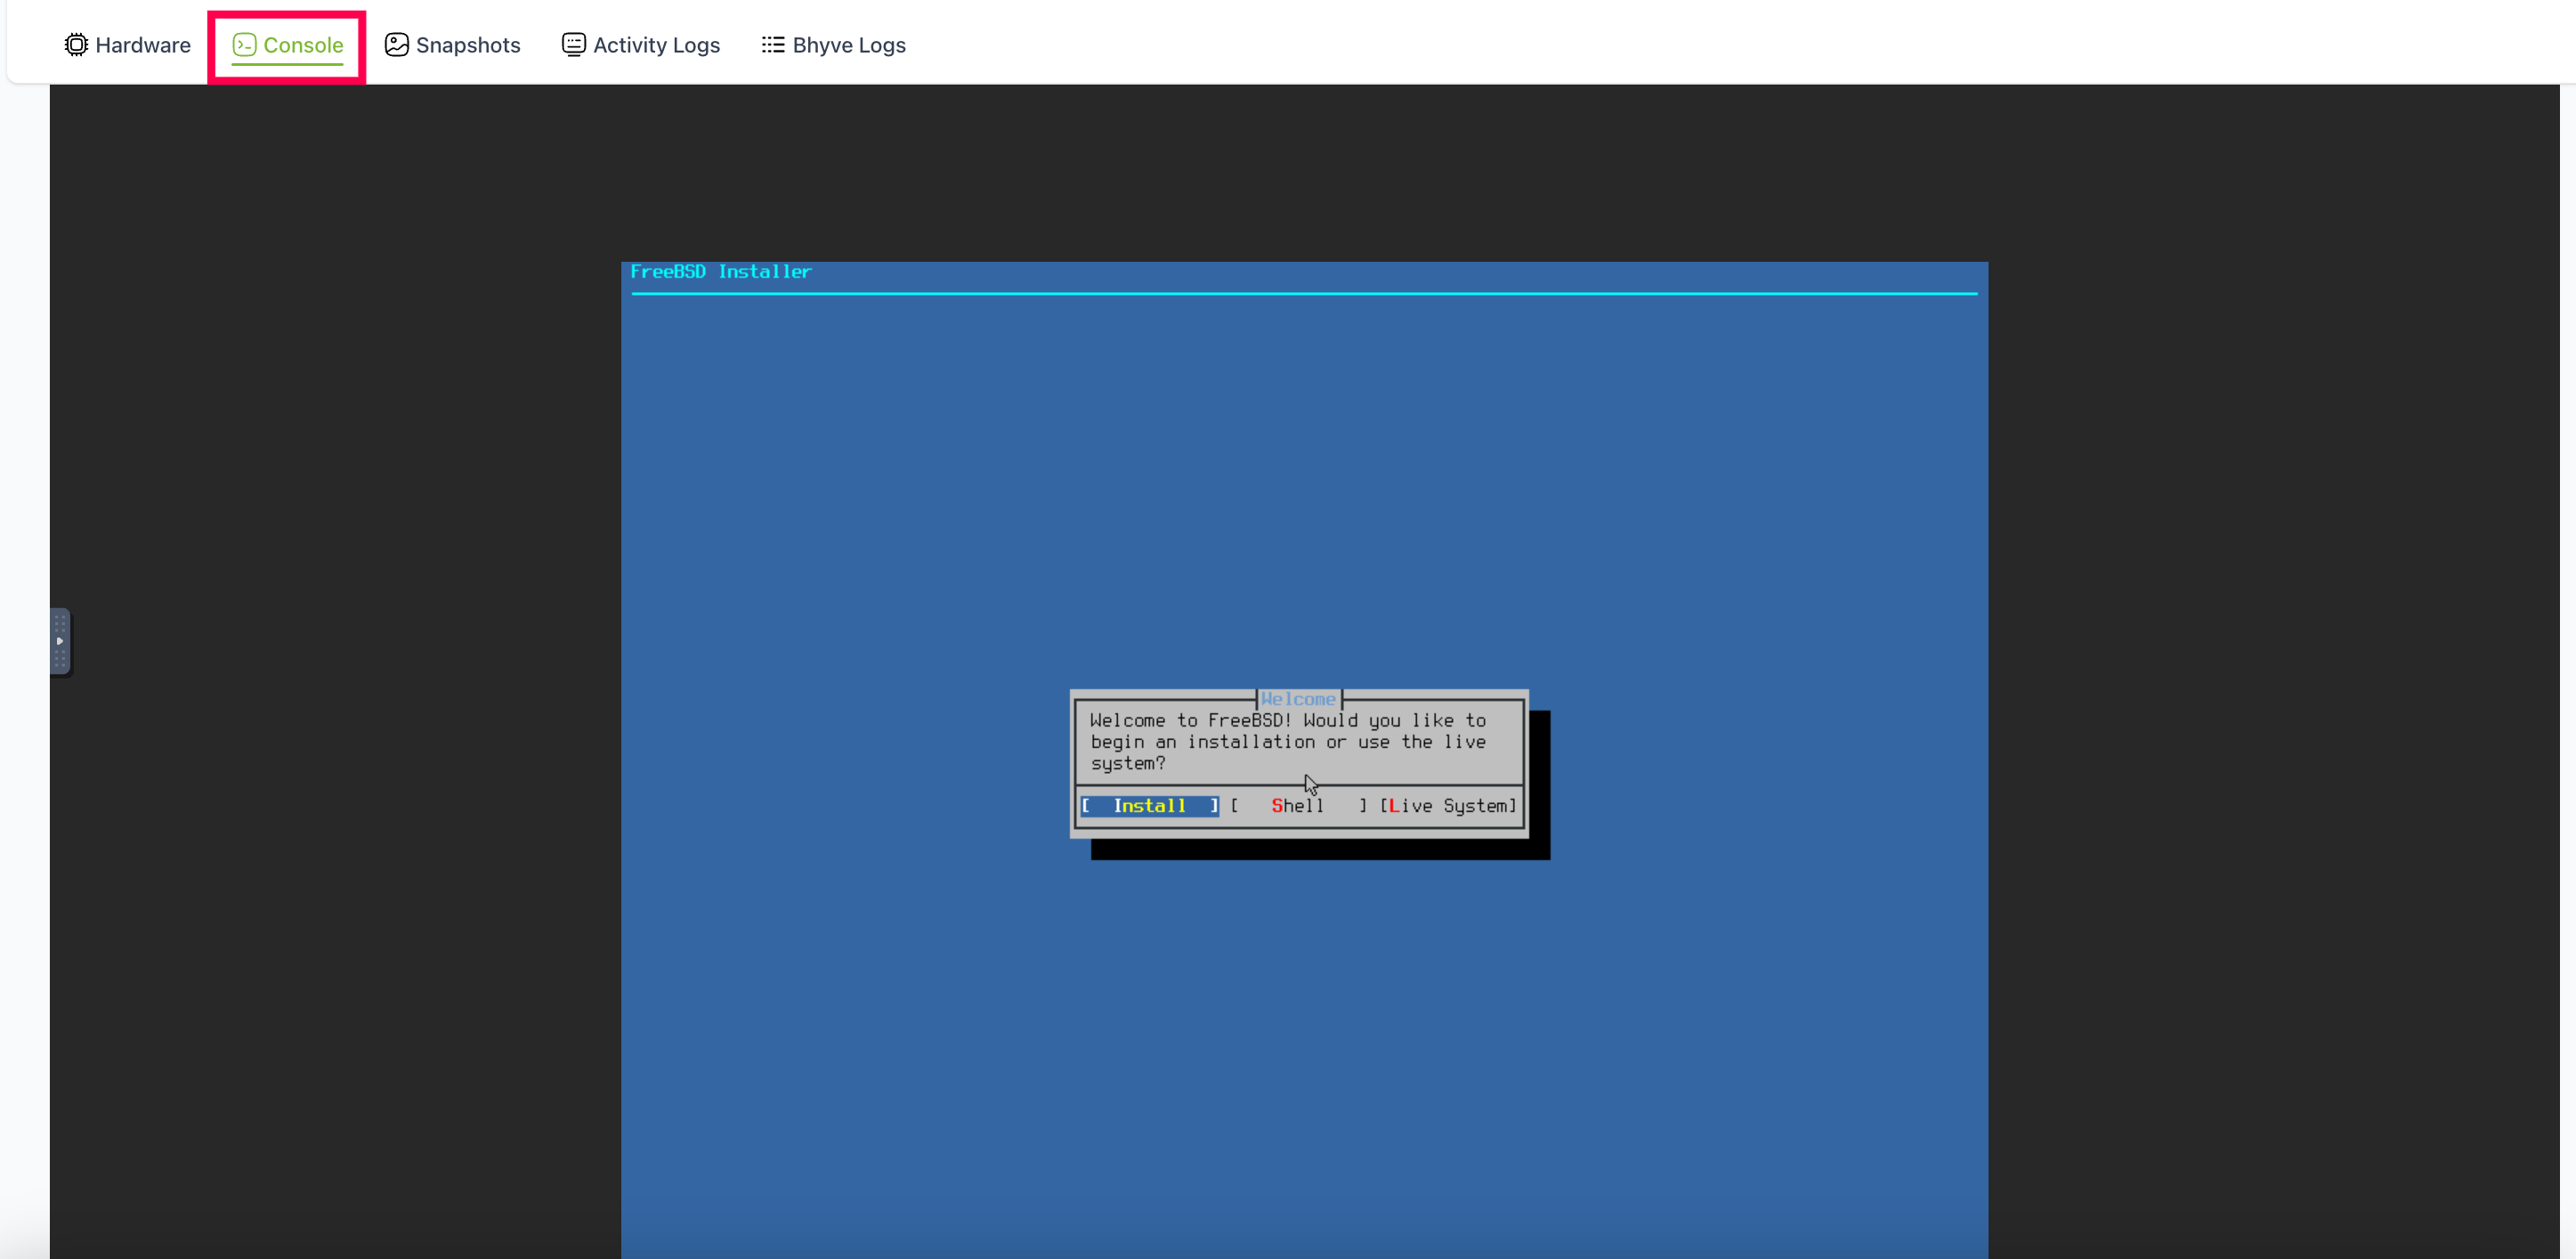
VM Snapshot Management
The Snapshots tab enables comprehensive snapshot operations:
Snapshot Creation: Create point-in-time snapshots of the VM state
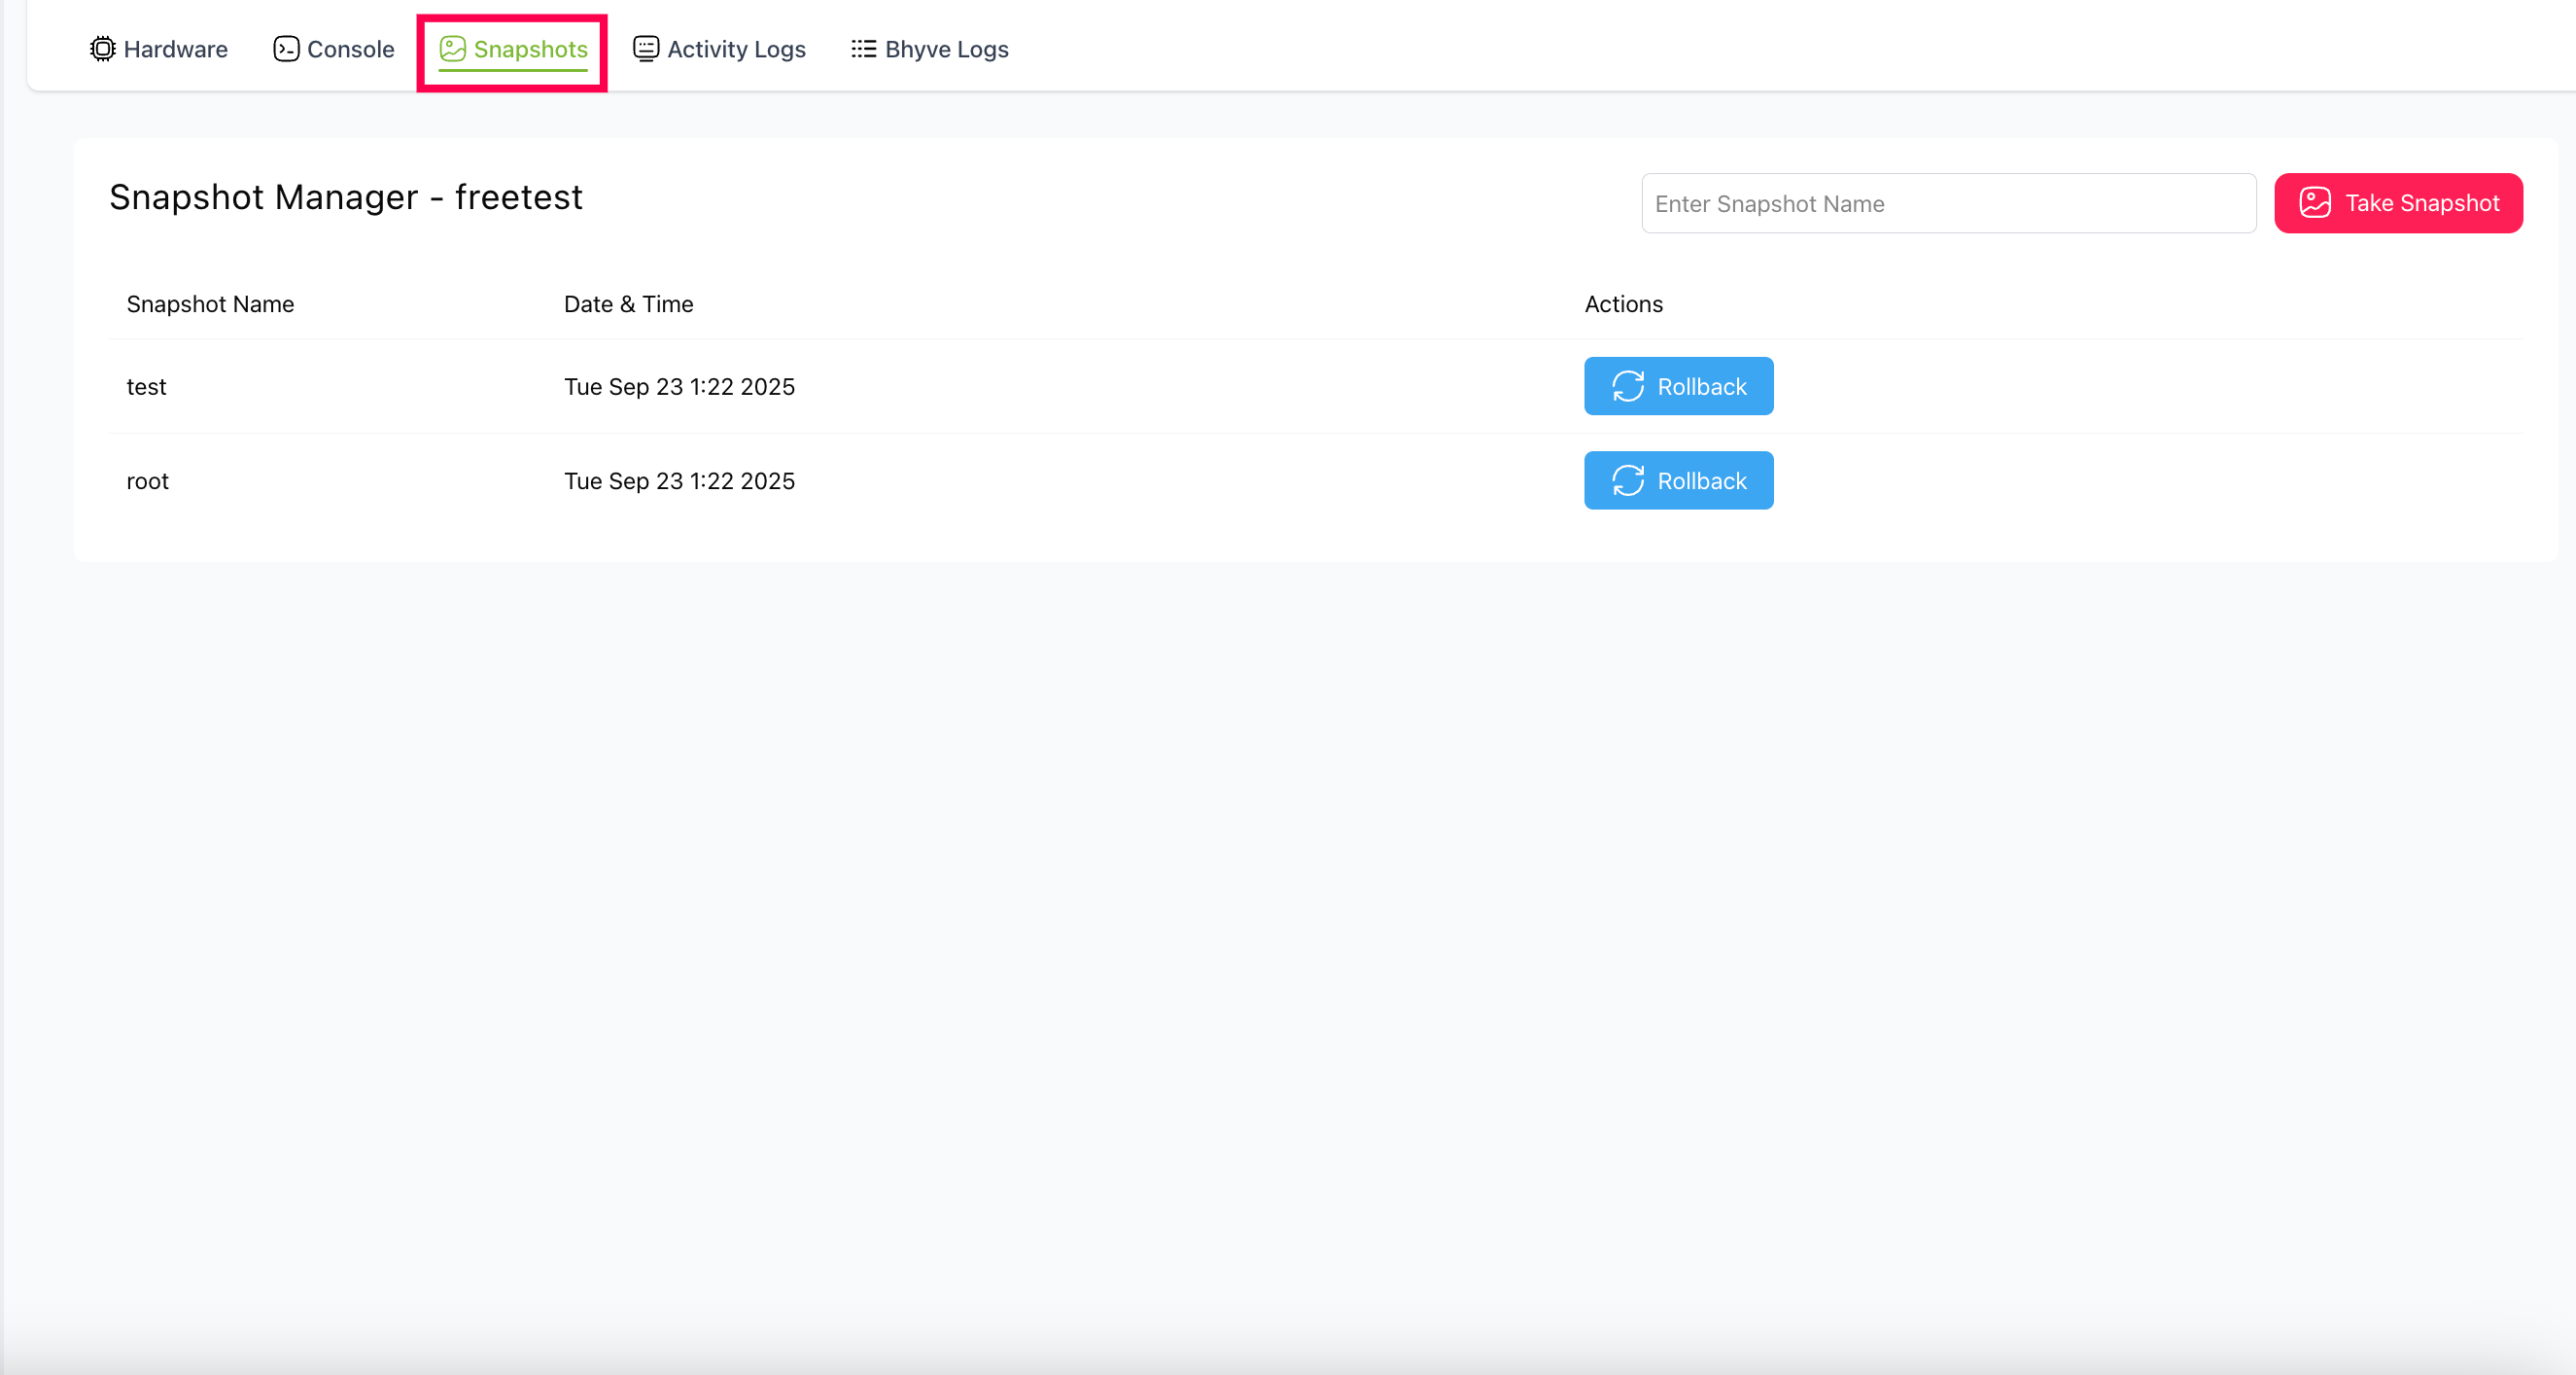
Snapshot Rollback: Restore the VM to a previous snapshot
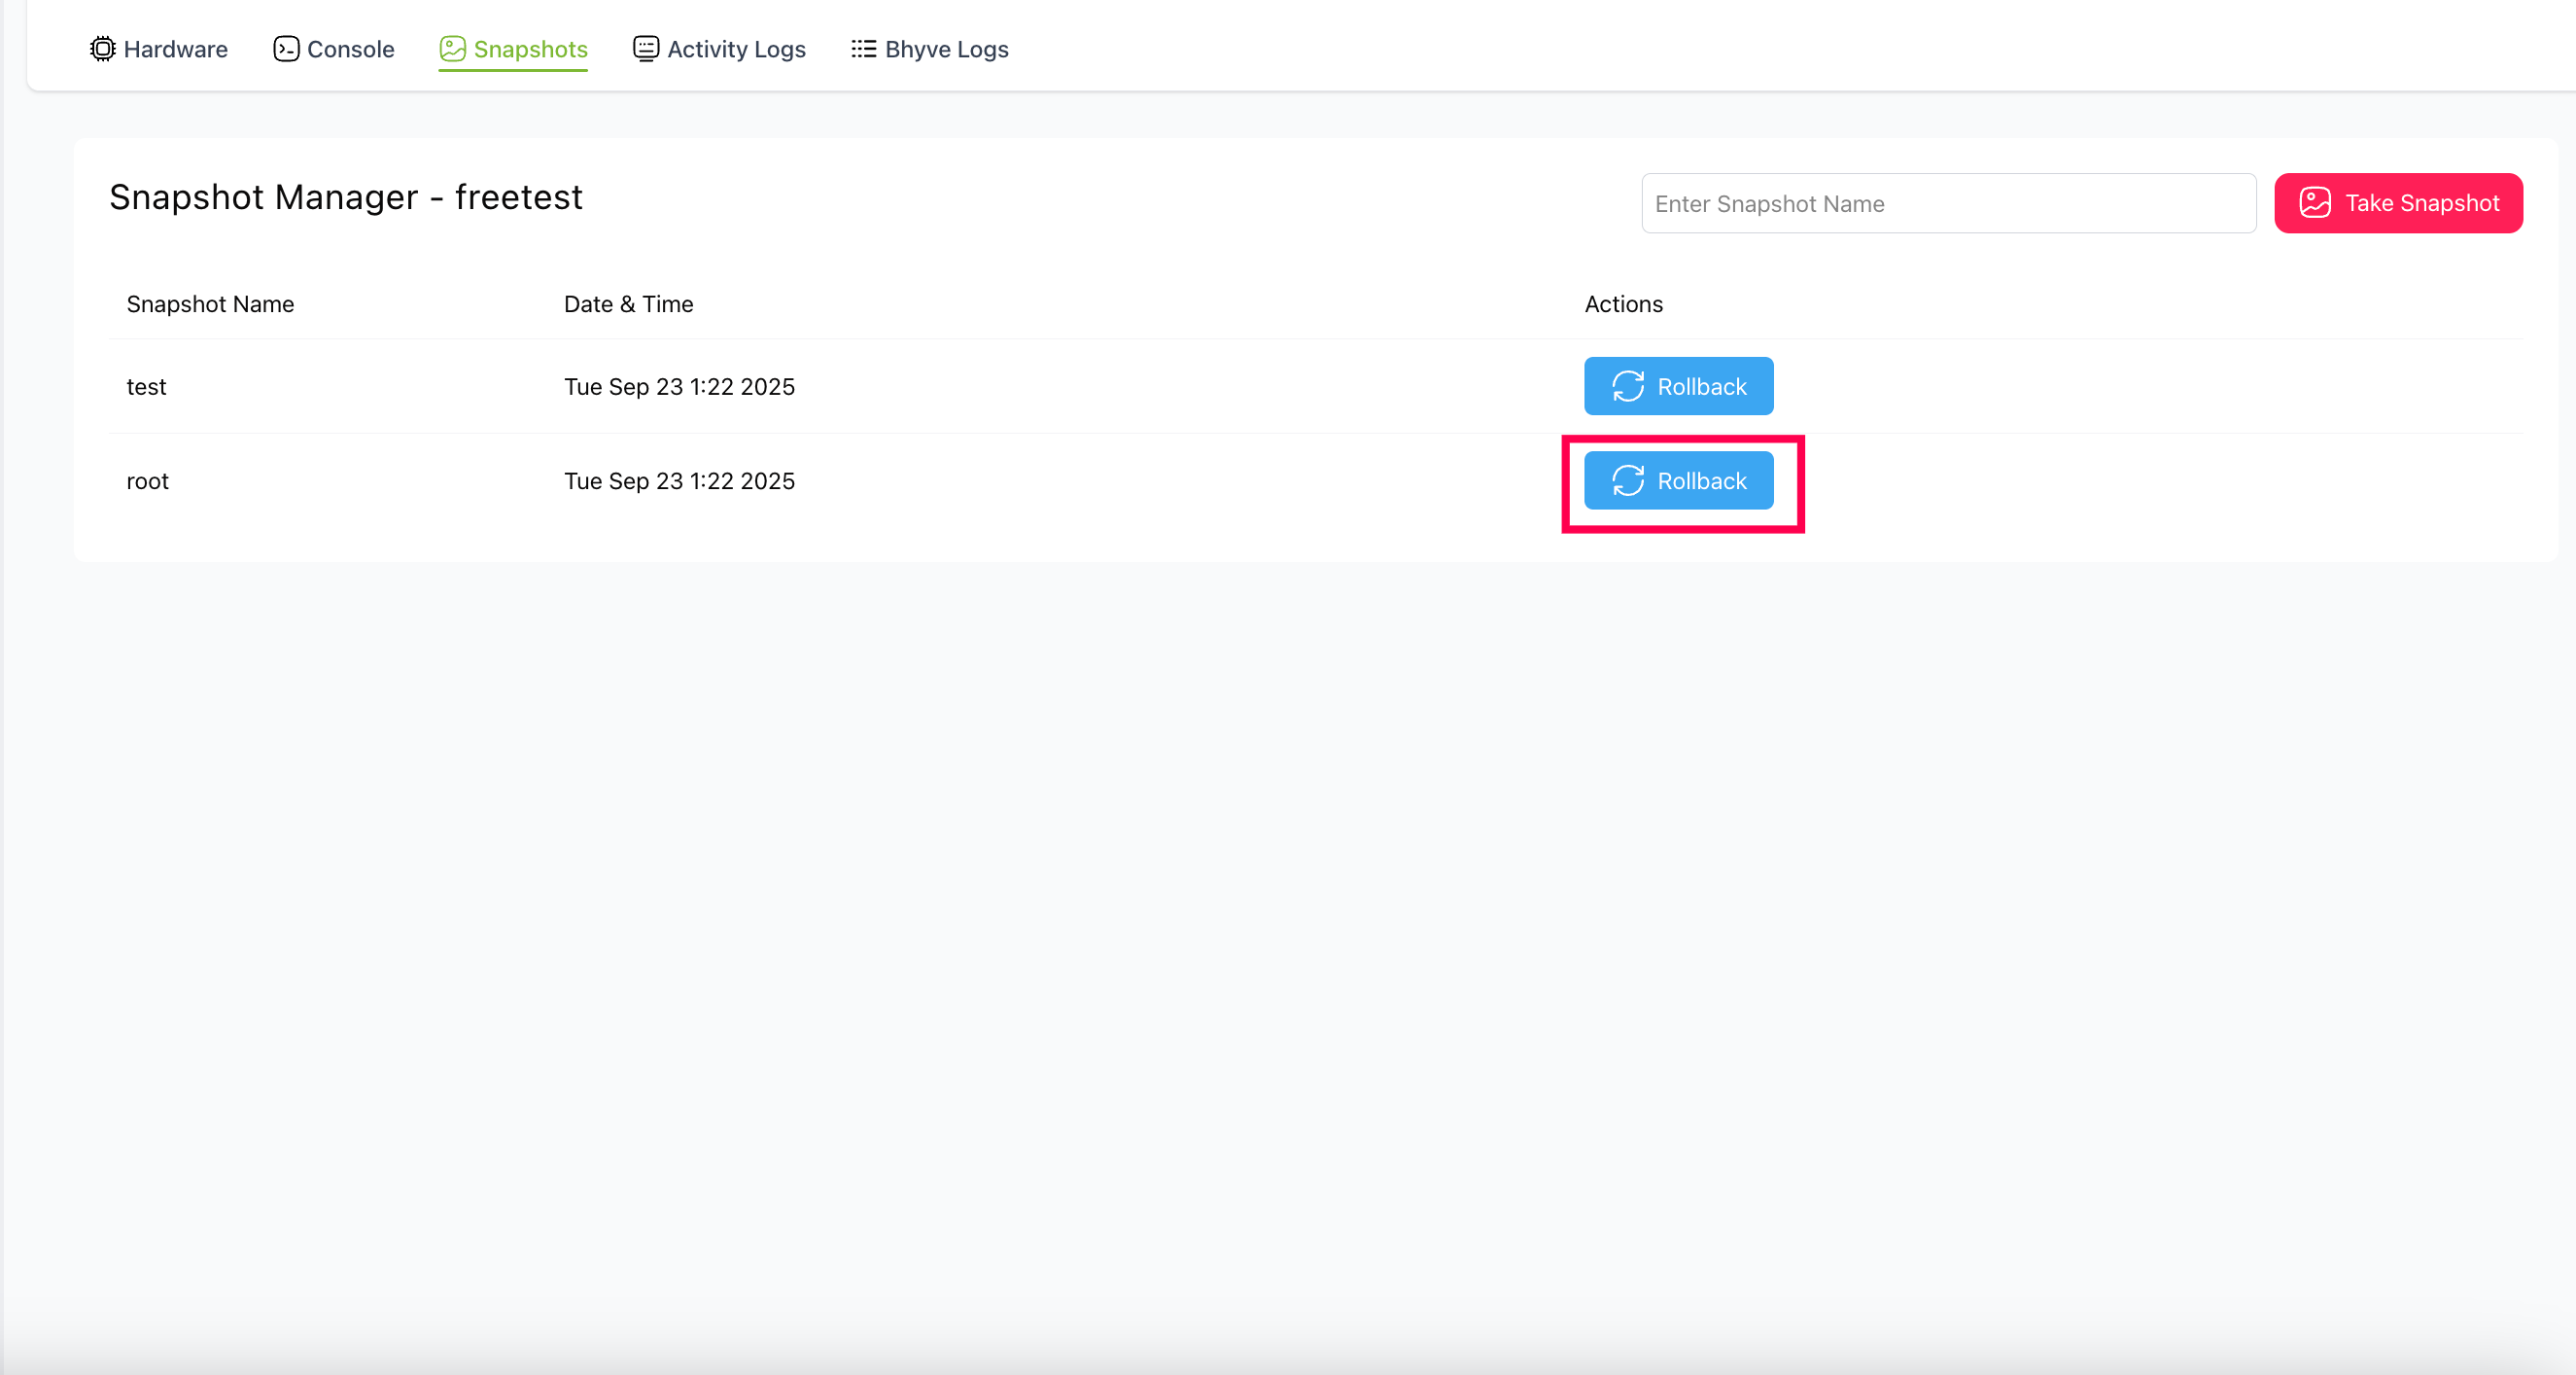
Snapshot Management: View, delete, and organize existing snapshots
Snapshot Scheduling: Configure automated snapshot creation for regular backups
VM Bhyve Logs
The Bhyve Logs tab provides comprehensive access to virtual machine hypervisor logs:
Real-time Log Monitoring: View live bhyve hypervisor logs with automatic updates
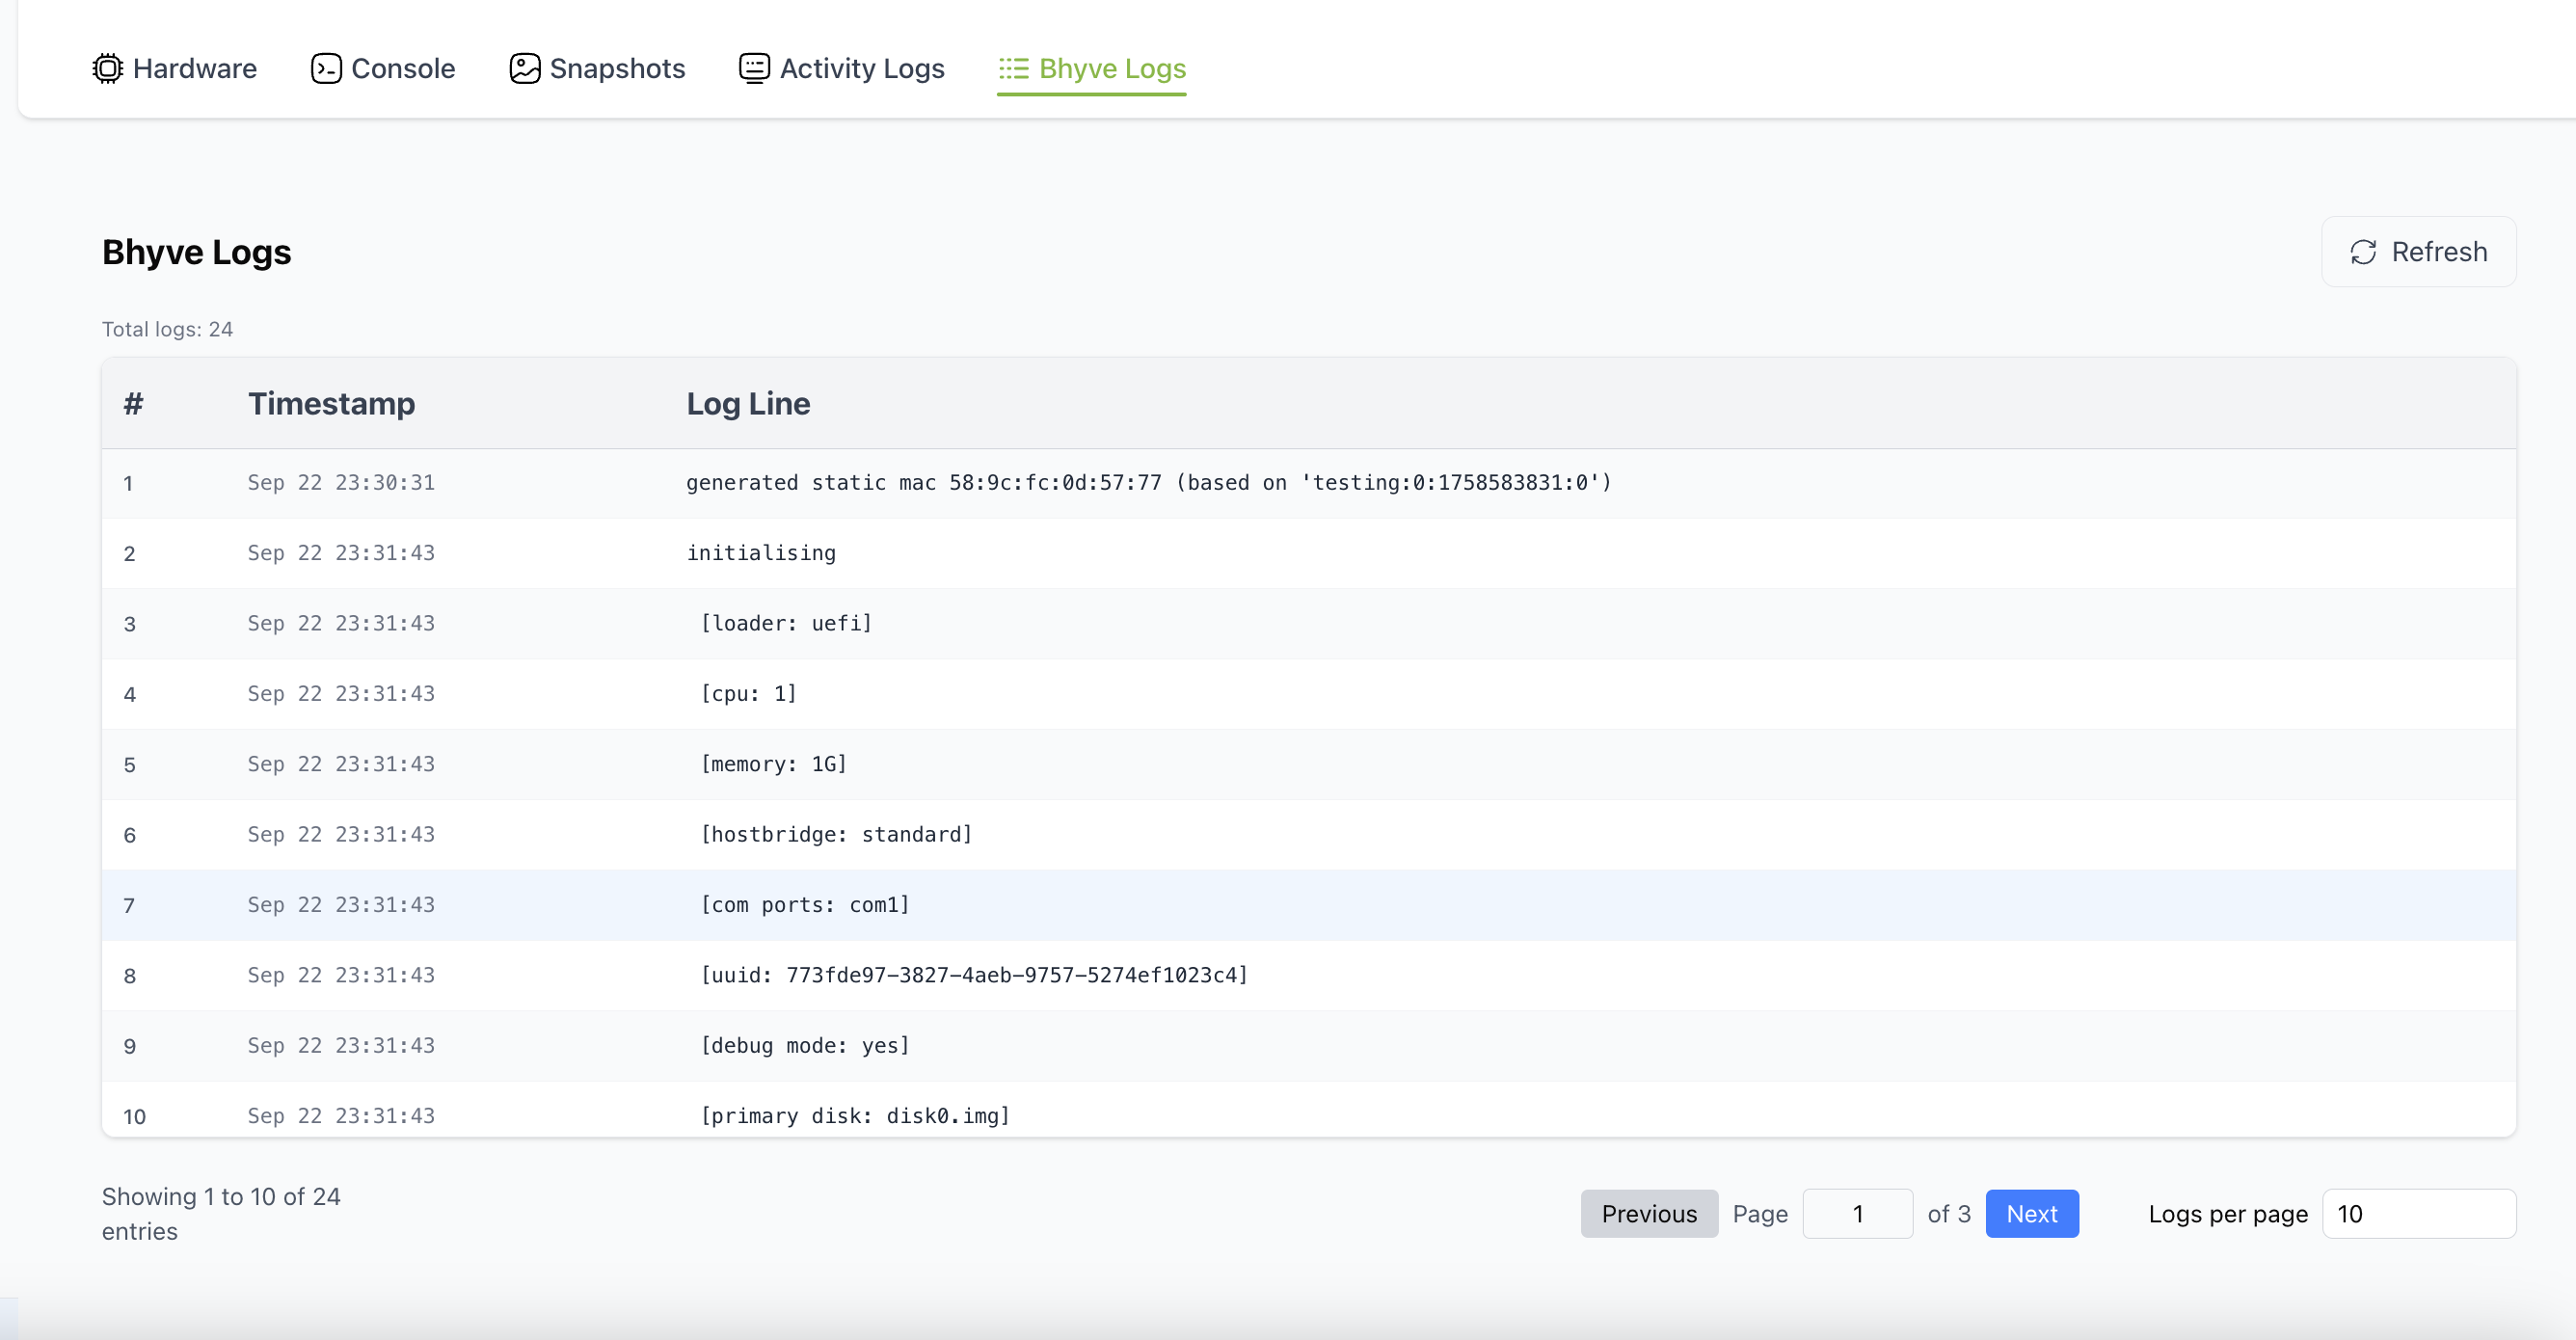
Log Entry Details: Each log entry displays timestamp and detailed system messages
VM Initialization Tracking: Monitor VM startup sequence including:
MAC address generation
Boot loader initialization
CPU and memory allocation
Network bridge configuration
UUID assignment and debug mode status
Primary disk attachment
Log Refresh Control: Manual refresh capability to update log entries on demand
Total Log Count Display: Shows complete number of log entries (e.g., “Total logs: 24”)
Chronological Log Organization: Entries numbered sequentially with precise timestamps
System Event Correlation: Track VM state changes and correlate with system events
Troubleshooting Support: Detailed logging for diagnosing VM startup and operational issues
The Bhyve Logs interface provides essential diagnostic information for understanding VM behavior, troubleshooting boot issues, and monitoring hypervisor-level operations during virtual machine lifecycle management.
VM Monitoring
Monitor VM performance and health using built-in tools:
Resource Usage: Track CPU, memory, and storage utilization
Network Traffic: Monitor network performance and connectivity
System Logs: Access VM system logs and error messages via the Activity Logs tab
VM Maintenance
Perform regular maintenance operations to ensure optimal VM performance:
Updates: Apply operating system, application, and patch updates promptly
Backups: Create regular VM backups for disaster recovery
Configuration Changes: Modify VM settings through the Hardware tab as needed
Hardware Modifications: Dynamically adjust CPU, memory, storage, and network configurations
VM Console Access
The Console tab provides direct browser-based access to the VM’s operating system:
Direct Console Access: Interact with the VM through a web-based console interface
Remote Management: Perform administrative tasks and troubleshooting directly from your browser
VM Snapshot Management
The Snapshots tab enables comprehensive snapshot operations:
Snapshot Creation: Create point-in-time snapshots of the VM state
Snapshot Rollback: Restore the VM to a previous snapshot
Snapshot Management: View, delete, and organize existing snapshots
Snapshot Scheduling: Configure automated snapshot creation for regular backups
VM Monitoring
Monitor VM performance and health using built-in tools:
Resource Usage: Track CPU, memory, and storage utilization
Network Traffic: Monitor network performance and connectivity
System Logs: Access VM system logs and error messages via the Activity Logs tab
VM Maintenance
Perform regular maintenance operations to ensure optimal VM performance:
Updates: Apply operating system, application, and patch updates promptly
Backups: Create regular VM backups for disaster recovery
Configuration Changes: Modify VM settings through the Hardware tab as needed
Hardware Modifications: Dynamically adjust CPU, memory, storage, and network configurations
PCIe Device Passthrough - GPU and NIC Passthrough
Overview
PCIe passthrough allows virtual machines to directly access physical hardware devices, providing near-native performance for graphics cards, network interfaces, and other PCIe devices. Karios implements PCIe passthrough through FreeBSD’s bhyve hypervisor with IOMMU support, enabling dedicated hardware access for virtualized workloads.
Performance Requirements
GPU Workloads: Machine learning, AI training, graphics rendering, and cryptocurrency mining require direct GPU access for optimal performance
Network Performance: High-throughput networking applications benefit from dedicated NIC access, bypassing virtualization overhead
Real-time Applications: Time-sensitive workloads need direct hardware access to minimize latency
Enterprise Use Cases
GPU Compute Clusters: Dedicated GPU resources for computational workloads
VDI (Virtual Desktop Infrastructure): Graphics acceleration for virtual desktops
Network Function Virtualization (NFV): Dedicated network interfaces for virtual network appliances
Development and Testing: Isolated hardware access for driver development and testing
Hardware Isolation
Resource Allocation: Guaranteed hardware resources without sharing
Compliance: Meeting regulatory requirements for hardware isolation
GPU Passthrough
GPU passthrough provides virtual machines with direct access to graphics processing units, enabling near-native performance for GPU-accelerated applications.
Hardware Requirements
IOMMU Support: Intel VT-d or AMD-Vi enabled in BIOS/UEFI
Multiple GPUs: Host system requires at least one GPU for console access (or integrated graphics)
Compatible GPU: Modern GPUs with UEFI support (NVIDIA, AMD, Intel Arc)
Sufficient PCIe Lanes: Adequate bandwidth for GPU operation
System Requirements
FreeBSD with bhyve: IOMMU-enabled kernel
Sufficient RAM: Additional memory overhead for VM and GPU operations
Power Supply: Adequate power for additional GPU hardware
GPU Passthrough Use Cases
Graphics and Rendering
CAD Workstations: Professional graphics applications requiring GPU acceleration
Gaming VMs: Near-native gaming performance in virtualized environments
Video Processing: Hardware-accelerated video encoding and transcoding
Scientific Computing
CUDA Applications: Direct access to NVIDIA CUDA cores
OpenCL Workloads: Cross-platform parallel computing
Simulation Software: GPU-accelerated scientific simulations
NIC Passthrough
Network Interface Card (NIC) passthrough provides virtual machines with dedicated network hardware access, enabling high-performance networking applications.
Benefits of NIC Passthrough
Performance Advantages
Reduced Latency: Elimination of virtualization network stack overhead
Higher Throughput: Direct access to full network interface bandwidth
CPU Efficiency: Reduced host CPU usage for network processing
Hardware Offloading: Access to NIC hardware acceleration features
Advanced Features
SR-IOV Support: Single Root I/O Virtualization for multiple VMs
DPDK Applications: Data Plane Development Kit compatibility
Network Function Virtualization: Dedicated interfaces for virtual appliances
Quality of Service: Hardware-level traffic management
NIC Passthrough Use Cases
Network Appliances
Firewalls: Dedicated interfaces for network appliances
Load Balancers: High-performance traffic distribution
VPN Gateways: Hardware-accelerated encryption processing
Network Monitoring: Dedicated capture interfaces for analysis tools
High-Performance Applications
High-Frequency Trading: Ultra-low latency network access
Real-time Communications: Dedicated bandwidth for VoIP/video systems
Database Clusters: Direct network access for distributed databases
Storage Networks: Dedicated interfaces for SAN/NAS access
Development and Testing
Network Driver Development: Direct hardware access for testing
Protocol Testing: Isolated network environments
Performance Benchmarking: Accurate network performance measurement
Best Practices
Hardware Planning
Device Allocation
Reserve Host Resources: Ensure host system retains necessary devices
IOMMU Groups: Understand PCIe device grouping limitations
Power and Cooling: Account for additional hardware power requirements
PCIe Lane Distribution: Optimize bandwidth allocation across devices
VM Resource Planning
Memory Allocation: Provide sufficient RAM for GPU/NIC operations
CPU Assignment: Allocate appropriate CPU cores for device-intensive workloads
Storage Performance: Ensure storage subsystem can support additional I/O
Hardware Access Considerations
Access Control
Device Ownership: Clearly define which VMs own which devices
Physical Access: Restrict physical access to passthrough-capable hardware
Firmware Updates: Maintain current firmware on passthrough devices
Isolation Verification
IOMMU Validation: Verify proper hardware isolation
Cross-VM Communication: Ensure devices cannot access other VM memory
Host Protection: Confirm host system stability with device assignments
Troubleshooting
IOMMU Problems
IOMMU Not Enabled: Verify BIOS/UEFI and FreeBSD configuration
Grouping Issues: Check IOMMU group assignments with
pciconf -lvDevice Conflicts: Ensure devices aren’t bound to host drivers
Device Recognition
Driver Issues: Install appropriate drivers in guest VM
Firmware Compatibility: Ensure device firmware supports passthrough
Resource Conflicts: Check for PCIe resource allocation problems
Performance Issues
Bandwidth Limitations: Verify adequate PCIe lane allocation
Memory Mapping: Ensure proper IOMMU page table configuration
Interrupt Handling: Check MSI/MSI-X interrupt configuration
Monitoring and Maintenance
Device Health
Temperature Monitoring: Track GPU/device temperatures
Performance Metrics: Monitor throughput and latency
Error Logging: Review system logs for hardware issues
System Impact
Host Performance: Monitor impact on host system resources
VM Performance: Track guest VM performance metrics
Network Utilization: Monitor bandwidth usage and efficiency
See also
- FreeBSD Documentation
- Hardware Specifications
Virtual Machine CLI Commands
VM Creation and Configuration
Basic VM Creation
# Create a new virtual machine
vm create -t template_name vm_name
VM Management Operations
Starting and Stopping VMs
# Start a virtual machine
vm start vm_name

# Start VM with specific boot options
vm start -B "-s 31,lpc -l com1,stdio" vm_name

# Stop a virtual machine
vm stop vm_name

# Force stop (power off)
vm poweroff vm_name

# Restart a virtual machine
vm restart vm_name
VM Status and Information
# List all virtual machines
vm list

# Show detailed VM information
vm info vm_name

# Show VM configuration
vm config vm_name

# Show VM console output
vm console vm_name
Resource Management
CPU and Memory Management
# Modify VM CPU count
vm config vm_name cpu=8

# Adjust VM memory
vm config vm_name memory=16G

# Configure CPU affinity
vm config vm_name cpuset=0,1,2,3
Network Configuration
Virtual Switch Operations
# Create virtual switch
vm switch create switch_name

# Add interface to switch
vm switch add switch_name em0

# Remove interface from switch
vm switch remove switch_name em0

# List virtual switches
vm switch list

# Show switch details
vm switch info switch_name
Template Management
Creating and Managing Templates
# Create a template from an existing VM config
cp /zroot/vm/vm_name/vm.conf /vm/.templates/template_name.conf

# List available templates
ls /vm/.templates/

# Show template details
cat /vm/.templates/template_name.conf

# Delete a template
rm /vm/.templates/template_name.conf

# Create a VM from a template
vm create -t template_name new_vm_name
VM Console and Access
Console Management
# Connect to VM console
vm console vm_name

# Disconnect from console
# Press Ctrl+] to exit console

# Enable VNC for VM
vm config vm_name vnc=on

# Set VNC port
vm config vm_name vnc_port=5900

# Set VNC password
vm config vm_name vnc_password=secure_password
VM Monitoring and Logs
Performance Monitoring
# Monitor overall system resource usage
top -a

# Show CPU usage per core
top -P

# Monitor disk I/O statistics
iostat -x 1

# Show live disk statistics per device
gstat

# Display network statistics (interfaces)
netstat -i

# Show protocol-level network statistics
netstat -s

# View specific VM process resource usage
ps aux | grep bhyve
Note
Replace vm_name, template_name, and other variables with actual values specific to your environment.
Warning
Some operations like PCI passthrough require specific hardware support and configuration.
Tip
Use vm help command_name to get detailed information about any specific command and its options.
VLAN Interface Configuration
Creating VLAN Interfaces
# Create VLAN interfaces
ifconfig vlan102 create vlan 102 vlandev vtnet0
ifconfig vlan103 create vlan 103 vlandev vtnet0
Assigning IP Addresses
# Assign IP addresses and bring interfaces up
ifconfig vlan102 inet 10.1.102.3/24 up
ifconfig vlan103 inet 10.1.103.3/24 up
Making Configuration Persistent
# Make VLAN configuration persistent across reboots
sysrc cloned_interfaces+="vlan102 vlan103"
sysrc ifconfig_vlan102="inet 10.1.102.3/24"
sysrc ifconfig_vlan103="inet 10.1.103.3/24"
Note
VLAN configuration will be automatically applied on system boot after making it persistent with sysrc commands.
Tip
Verify VLAN interface status with ifconfig vlan102 and ifconfig vlan103 after configuration.
ZFS CLI Commands
Show File System Info
Command |
Description |
|---|---|
|
List all ZFS file system |
|
List all properties of a ZFS file system |
Import/Export Commands
Command |
Description |
|---|---|
|
List pools available for import |
|
Imports all pools found in the search directories |
|
To search for pools with block devices not located in /dev/dsk |
|
Search for a pool with block devices created in /zfs |
|
Import a pool originally named oldpool under new name newpool |
|
Import pool using pool ID |
|
Deport a ZFS pool named datapool |
|
Force the unmount and deport of a ZFS pool |
Clone Commands
Command |
Description |
|---|---|
|
Clone an existing snapshot |
|
Destroy clone |
Show Pool Information
Command |
Description |
|---|---|
|
Show pool status |
|
Show individual pool status in verbose mode |
|
Show all the pools |
|
Show particular properties of all the pools (here, name and size) |
|
Show all pools without headers and columns |
Set ZFS File System Properties
Command |
Description |
|---|---|
|
Set quota of 1 GB on filesystem fs1 |
|
Set Reservation of 1 GB on filesystem fs1 |
|
Disable ZFS auto mounting and enable mounting through /etc/vfstab |
|
Share fs1 as NFS |
|
Enable compression on fs1 |
|
Set Dataset Record Size (Size should be a value like 16k, 128k, or 1M etc.) |
|
Get Dataset Record Size |
ZFS I/O Performance
Command |
Description |
|---|---|
|
Display ZFS I/O Statistics every 2 seconds |
|
Display detailed ZFS I/O statistics every 2 seconds |
ZFS Maintenance Commands
Command |
Description |
|---|---|
|
Run scrub on all file systems under data pool |
|
Temporarily offline a disk (until next reboot) |
|
Online a disk to clear error count |
|
Clear error count without a need to the disk |
Snapshot Commands
Command |
Description |
|---|---|
|
Create a snapshot named 12jan2014 of the fs1 filesystem |
|
List snapshots |
|
Roll back to 10jan2014 (recursively destroy intermediate snapshots) |
|
Roll back must and force unmount and remount |
|
Destroy snapshot created earlier |
|
Take a backup of ZFS snapshot locally |
|
Restore from the snapshot backup backup taken |
|
Combine the send and receive operation |
|
Send the snapshot to a remote system node02 |
Firewall CLI Commands
Note
For comprehensive pfctl administration details, refer to the FreeBSD pfctl documentation.
General Commands
Command |
Description |
|---|---|
|
Enable PF |
|
Disable PF |
|
Only print errors and warnings |
|
Produce more verbose output |
Loading Rules
Command |
Description |
|---|---|
|
Load the pf.conf file |
|
Parse the file, but don’t load it |
|
Load only the NAT rules from the file |
|
Load only the filter rules from the file |
Flushing Rules
Command |
Description |
|---|---|
|
Flush the NAT rules |
|
Flush the queue rules |
|
Flush the filter rules |
|
Flush the state table (connections) |
|
Flush the filter information (counters) |
|
Flush the passive operating system fingerprints |
|
Flush everything |
Showing Information
Command |
Description |
|---|---|
|
Show the currently loaded NAT rules |
|
Show the currently loaded queue rules |
|
Show the currently loaded filter rules |
|
Show the contents of the state table |
|
Show filter information (statistics and counters) |
|
Show per-rule statistics (bytes, packets, etc.) of filter rules with labels |
|
Show the current global timeouts |
|
Show the current pool memory hard limits |
|
Show the list of operating system fingerprints |
|
Show everything |
Debugging
Command |
Description |
|---|---|
|
Show filter rules with very verbose output |
|
Load /etc/pf.conf verbosely, showing rule numbers as loaded |
|
Set the debug level to loud |
Statistics
Command |
Description |
|---|---|
|
Show information and statistics |
|
Show per-rule statistics for rules that have labels |
|
Show state table |
|
Show state table for a specific IP |
Tables
Command |
Description |
|---|---|
|
Show contents of specified table |
|
Add address to table |
|
Delete address from table |
|
Remove all addresses from table |
|
Delete the table entirely |
|
Load addresses into table from file |
|
Test if address is in table |
Common Usage Examples
Command |
Description |
|---|---|
|
Show first 30 lines of everything |
|
Show first 20 active connections |
|
Show active connections, verbose, without established |
|
Kill all states for IP 192.168.1.1 |
|
Kill and prevent future connections for IP |
|
Clear per-rule statistics |
Network Traffic Monitoring
Command |
Description |
|---|---|
|
Read pflog file |
|
Monitor pflog in real-time |
|
Monitor pflog for specific host |
Storage and File Sharing CLI Commands
Note
For comprehensive storage system administration, refer to the respective official documentation for each technology.
Network File System (NFS)
- FreeBSD NFS Documentation
Server Message Block (SMB/CIFS)
- FreeBSD SMB/CIFS Resources
Internet Small Computer Systems Interface (iSCSI)
- FreeBSD iSCSI Documentation
MooseFS Distributed File System
- FreeBSD MooseFS Tutorial
Karios Management Commands
For troubleshooting scenarios where Karios services are unresponsive, you can manually control individual services using FreeBSD’s service management commands.
Warning
Only perform manual service operations when services are not responding through the normal Karios interface. Always check service status before making changes.
Backend APIs
Control the core Karios backend services:
Command |
Description |
|---|---|
|
Start the Karios core backend service |
|
Stop the Karios core backend service |
|
Restart the Karios core backend service |
|
Check Karios core service status |
Database and Infrastructure Services
Manage supporting database and web services:
Command |
Description |
|---|---|
|
Start PostgreSQL database service |
|
Stop PostgreSQL database service |
|
Restart PostgreSQL database service |
|
Check PostgreSQL service status |
|
Start InfluxDB time-series database |
|
Stop InfluxDB time-series database |
|
Restart InfluxDB time-series database |
|
Check InfluxDB service status |
|
Start Nginx web server |
|
Stop Nginx web server |
|
Restart Nginx web server |
|
Check Nginx service status |
Caution
Always backup your system before performing service restarts in production environments. Database service interruptions may affect running virtual machines and storage operations.
API Integration
API Authentication and Usage Guide
Prerequisites
Postman installed
Swagger/OpenAPI documentation for the API
Valid user credentials
Authentication Process
Login and Obtain Access Token
Open Postman
Create a new POST request to the login/authentication endpoint
Set request type to POST
Enter the full authentication endpoint URL
In the request body, include username and password
Configure Authentication Request
Set Headers:
Content-Type: application/json
Prepare JSON body with login credentials:
{
  "username": "your_username",
  "password": "your_password"
}
Retrieve Access Token
Send the login request
The response will contain an access token
Copy the access token from the response body
Prepare API Request in Postman
Create a new request for your desired API endpoint
Go to the “Authorization” tab
Select “Bearer Token” as the authorization type
Paste the copied access token in the token field
Configure API Request
Set the appropriate HTTP method (GET, POST, PUT, DELETE)
Enter the complete API endpoint URL
Add any required headers
Prepare request body if needed (for POST/PUT requests)
Send the Request
Click “Send” to execute the API call
Review the response status and body
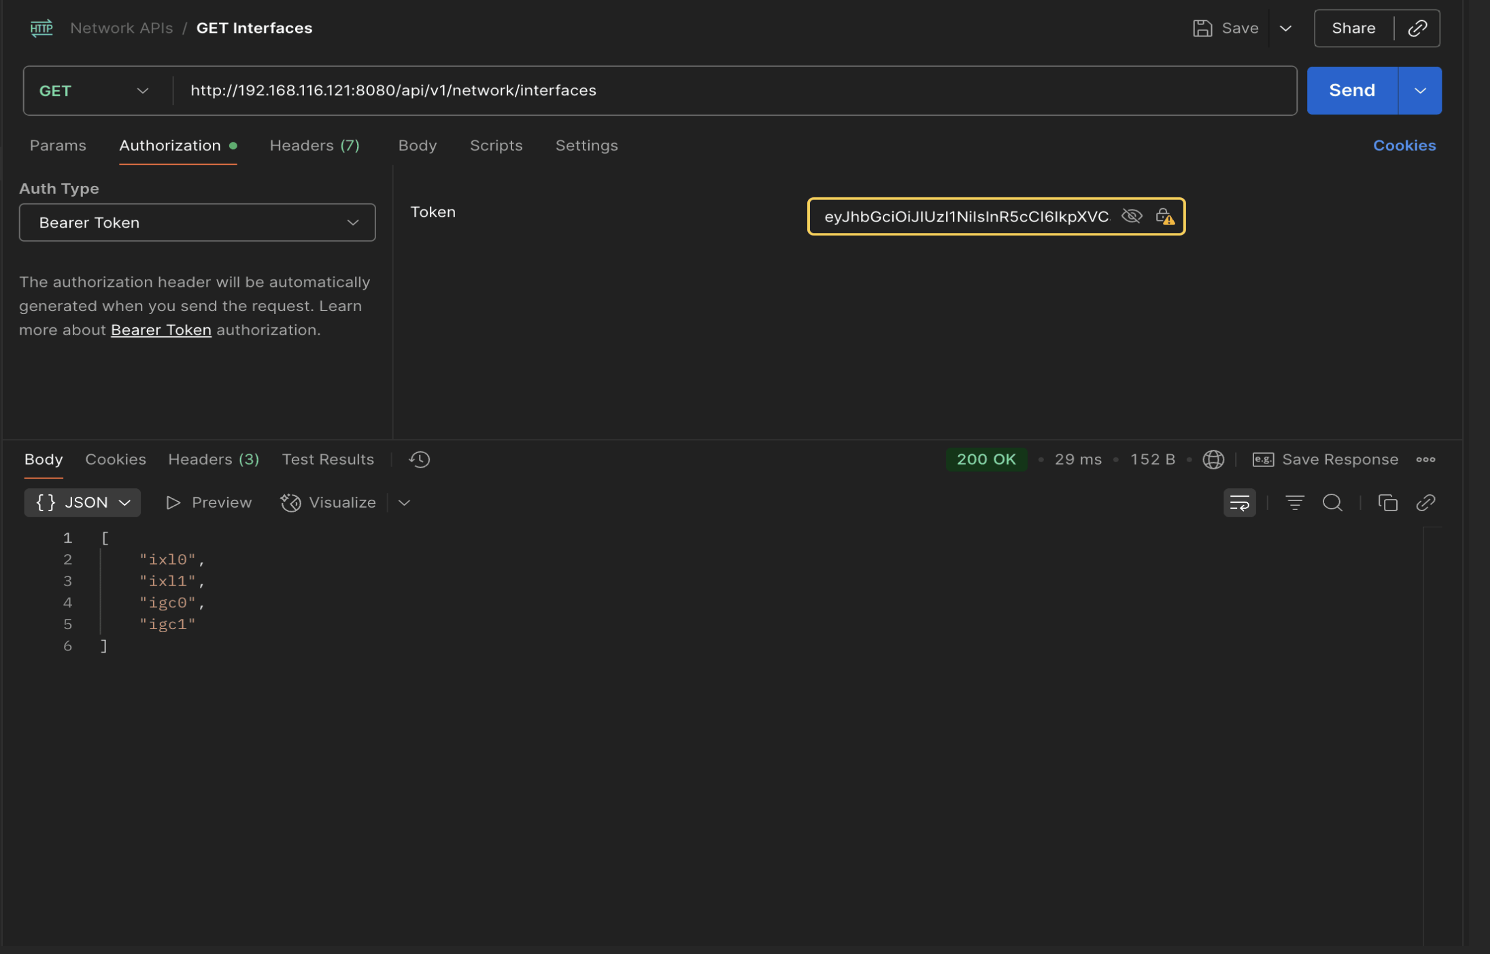
Swagger API Documentation Guide
Overview
The Karios platform provides a comprehensive RESTful API interface accessible through Swagger UI, enabling developers and administrators to interact with all platform features programmatically.
Step-by-Step API Access Guide
Step 1: Access Swagger Endpoint
The Swagger UI provides an interactive interface for exploring and testing the Karios API.
Navigate to Swagger Interface:
http://{IP}:8080/swagger/index.html
Swagger Interface Components
Upon accessing the Swagger interface, you’ll see:
API Title and Version: Displays the current API version
Server Information: Shows the base URL for API calls
Authorization Section: Located at the top-right corner
API Endpoints: Organized by functional categories
Try it Out Buttons: Interactive testing for each endpoint
Response Examples: Sample request/response formats
Step 2: Authentication - Obtain Access Token
Locate the Login API Endpoint
Find the User management Section and locate the “Login” endpoint
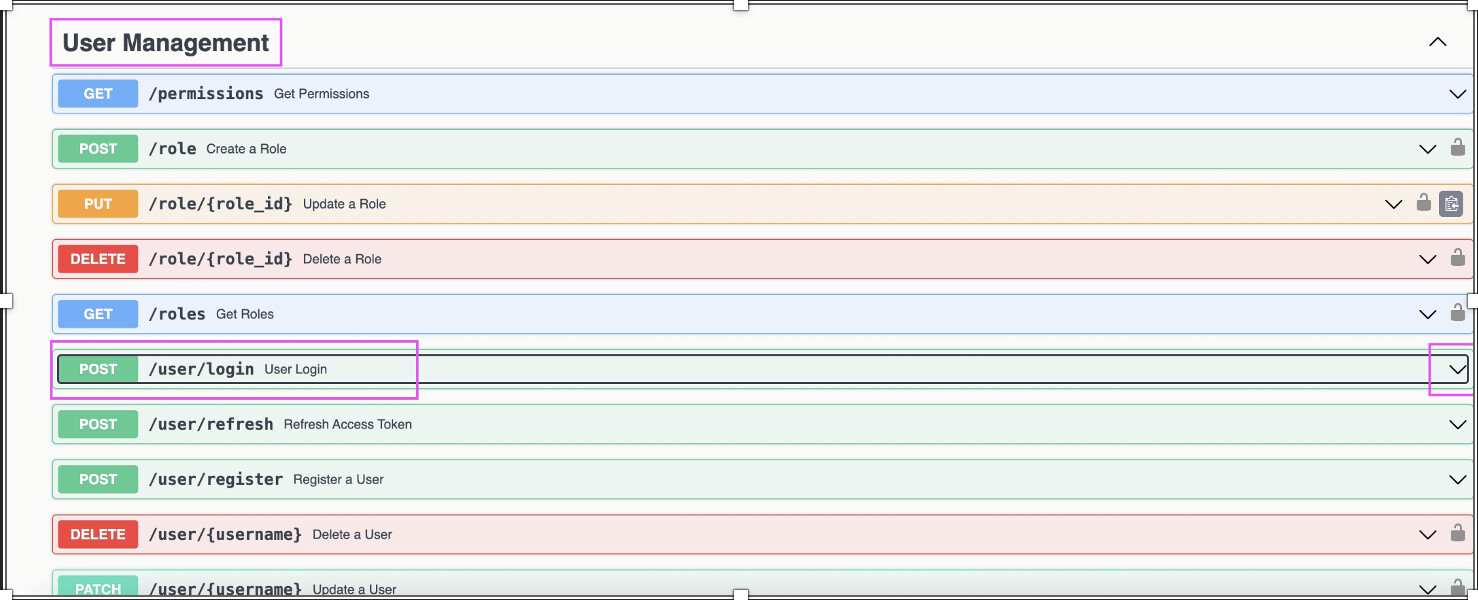
Execute the Login Request
Click “Try it out” button on the login endpoint
Enter Request Body with your credentials:
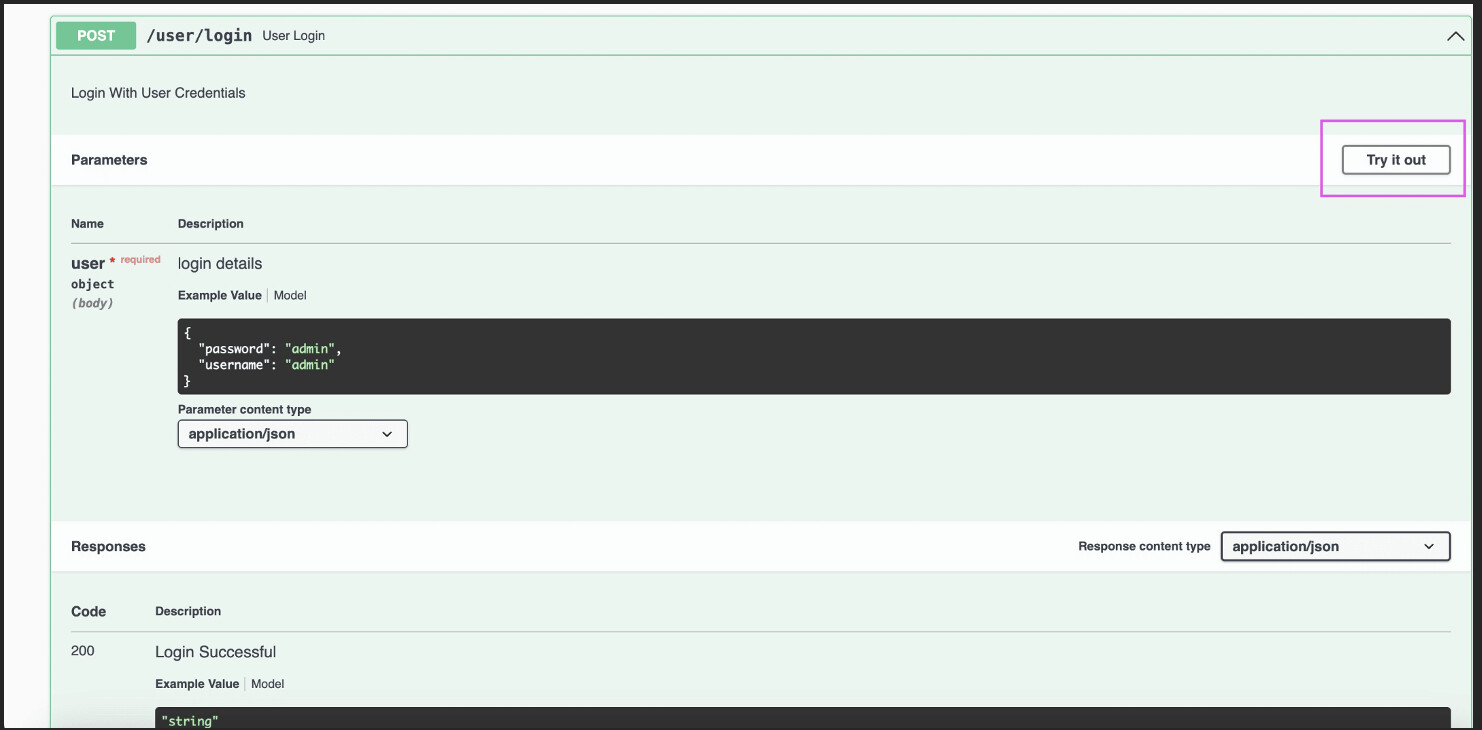
{
  "username": "admin",
  "password": "admin"
}
Click “Execute” to send the login request
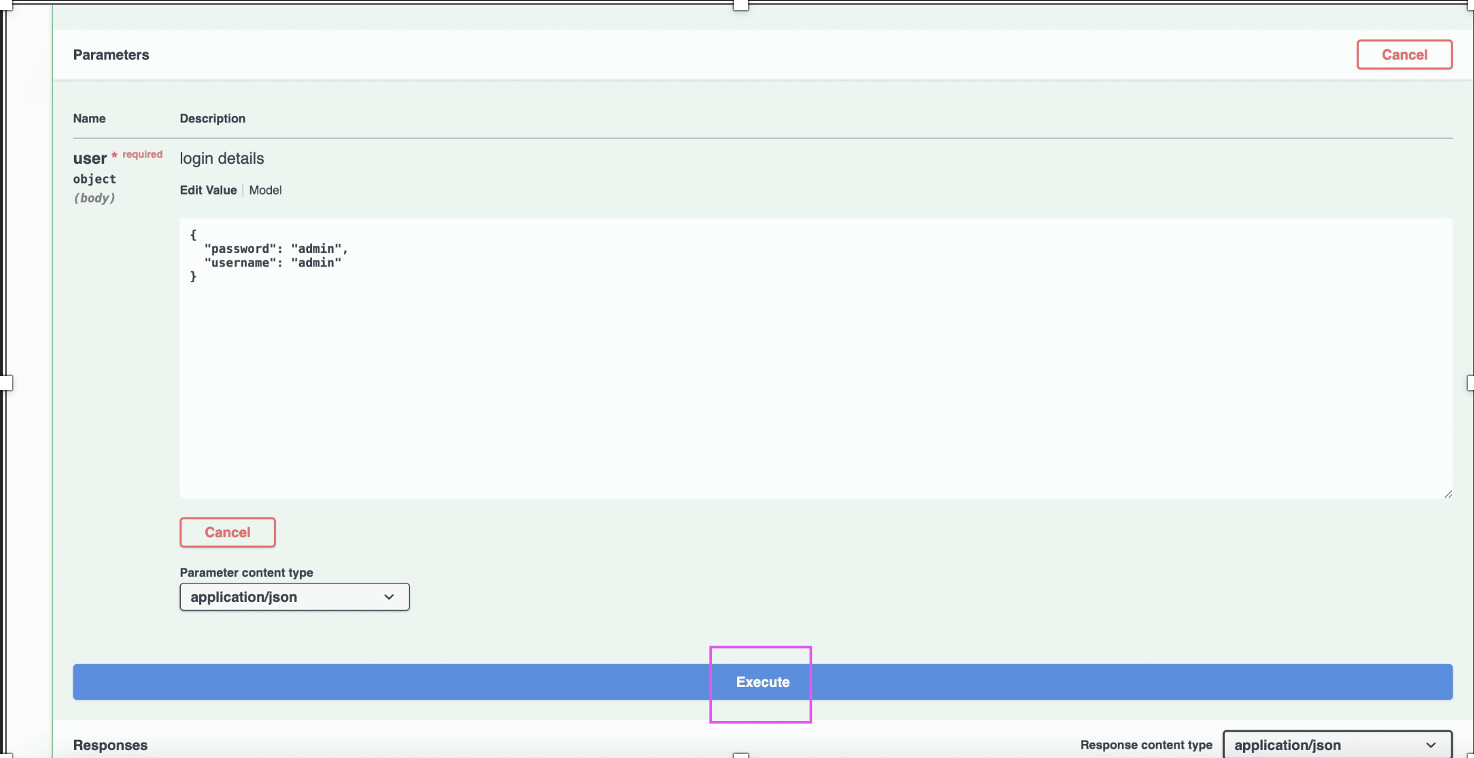
Review the Response in the response section
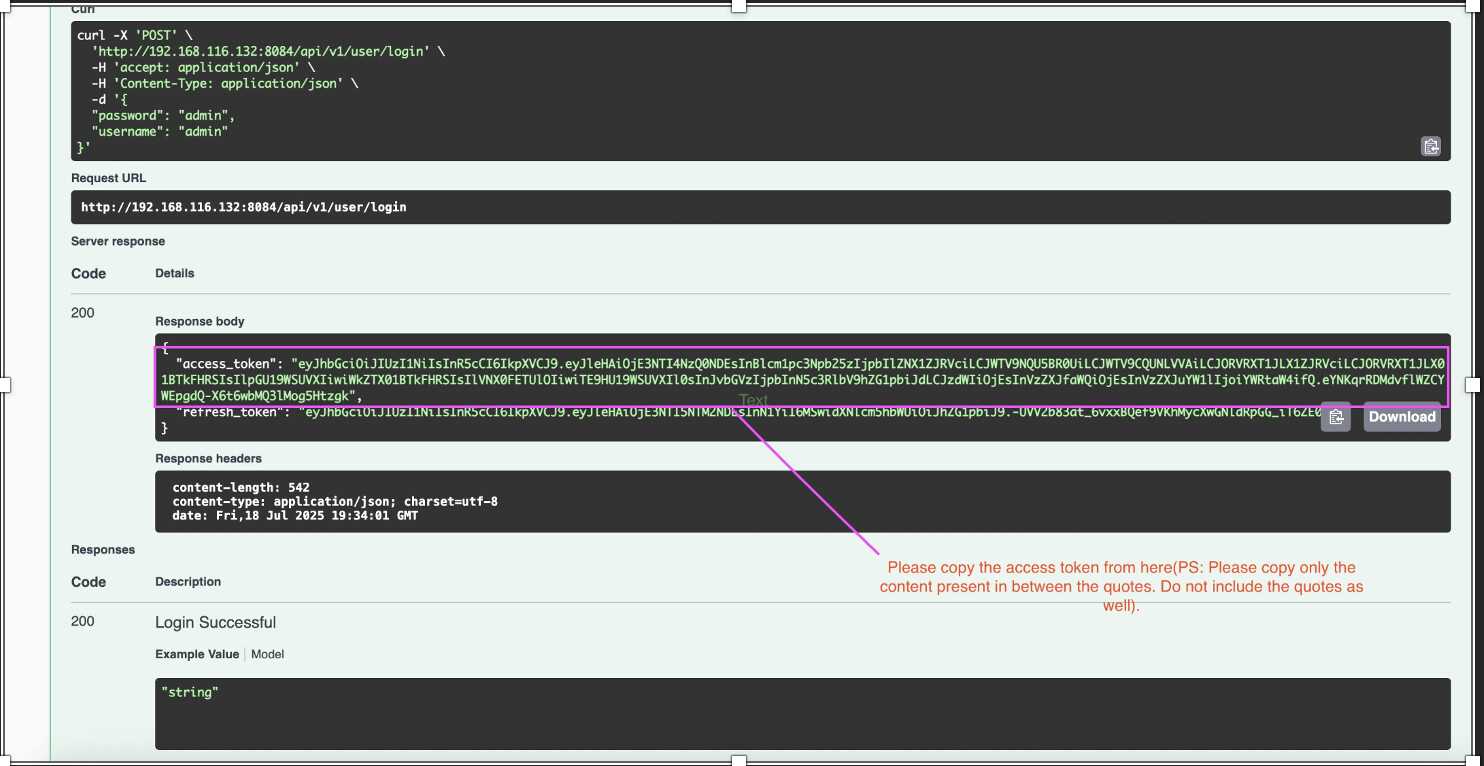
Step 3: Configure Bearer Token Authorization
Locate the Authorization Section
Find the “Authorize” button at the top of the Swagger interface
Click the “Authorize” button to open the authorization dialog
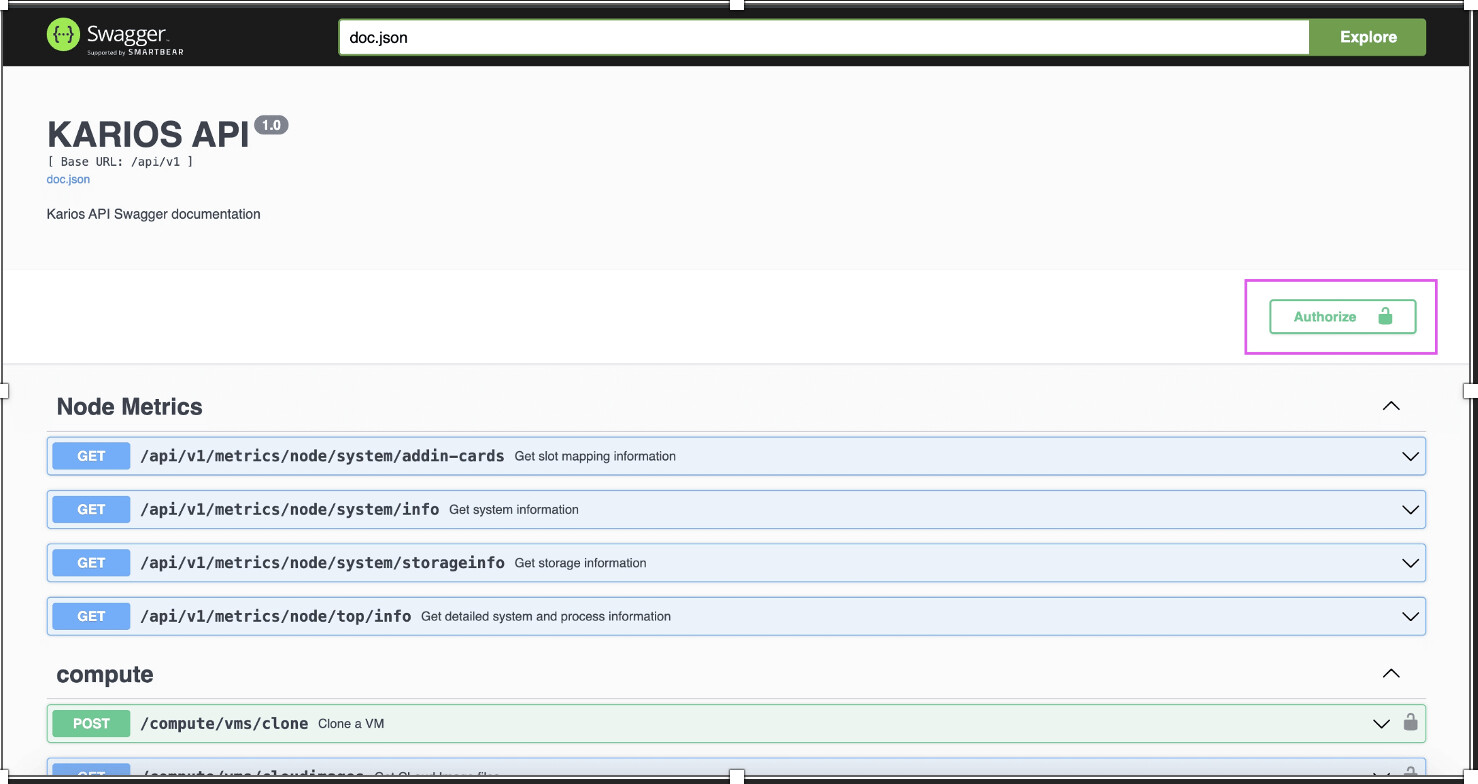
Configure Bearer Token Authentication
Select “Bearer Auth” section
Enter the Bearer Token:
Bearer eyJhbGciOiJIUzI1NiIsInR5cCI6IkpXVCJ9...
Click “Authorize” to save the configuration
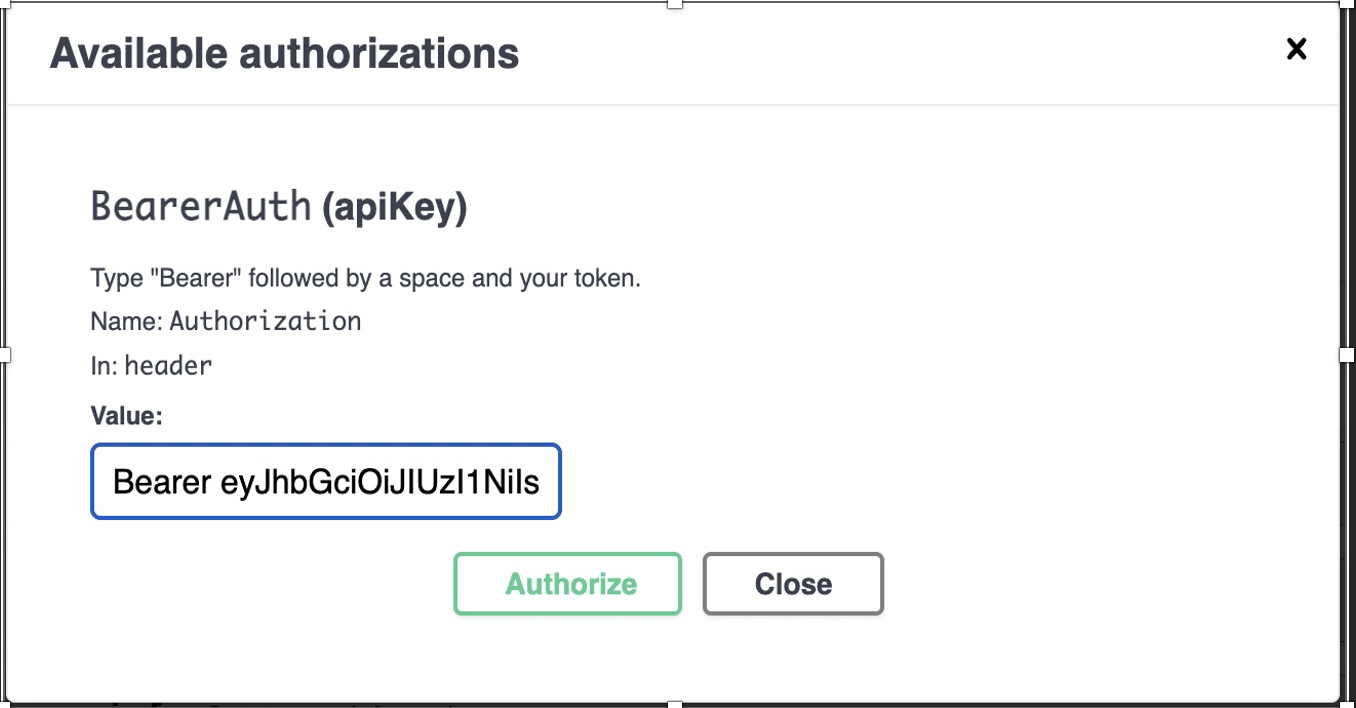
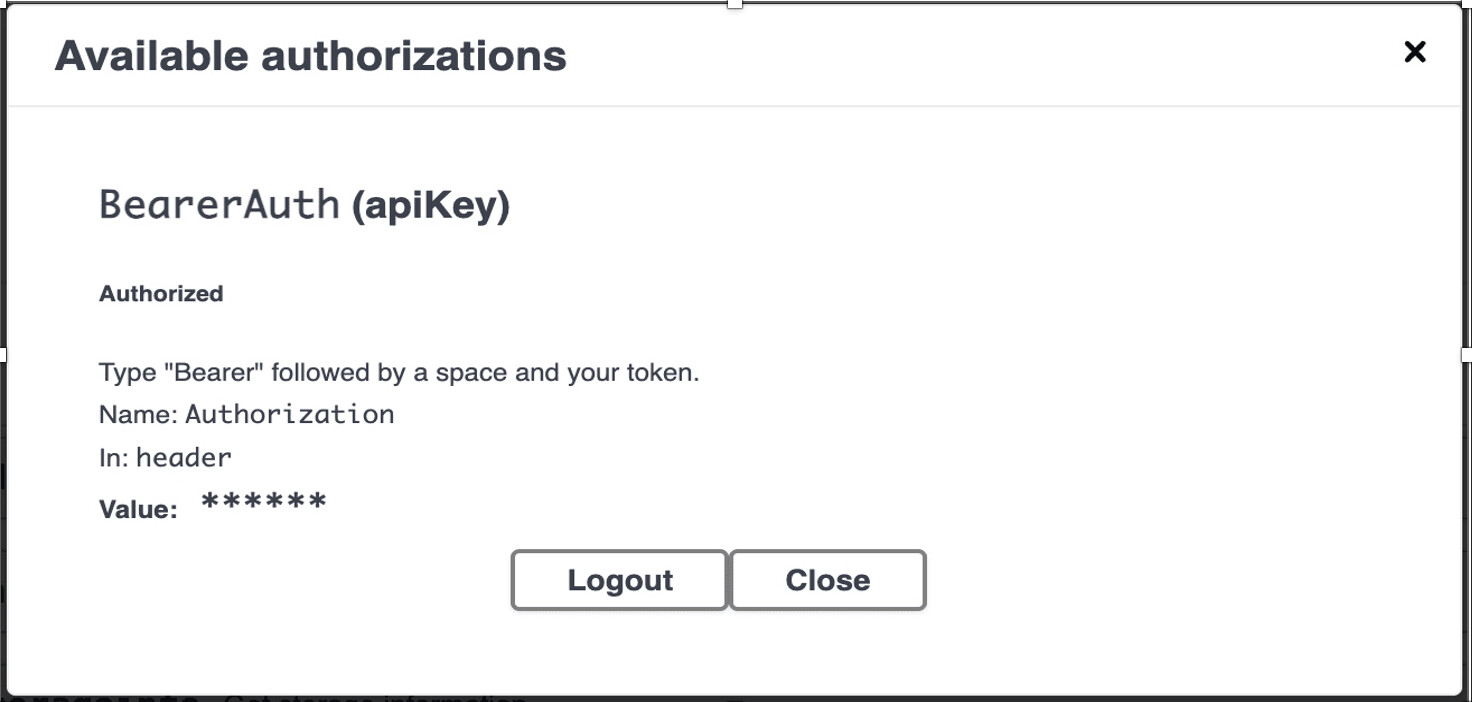
Step 4: Test API Endpoints
With authentication configured, you can now test all available API endpoints:
Select an Endpoint: Choose the desired API endpoint from the list
Review Endpoint Information: HTTP Method, URL Path, Parameters, Request Body, Response Codes
Click “Try it out”: This enables the interactive testing interface
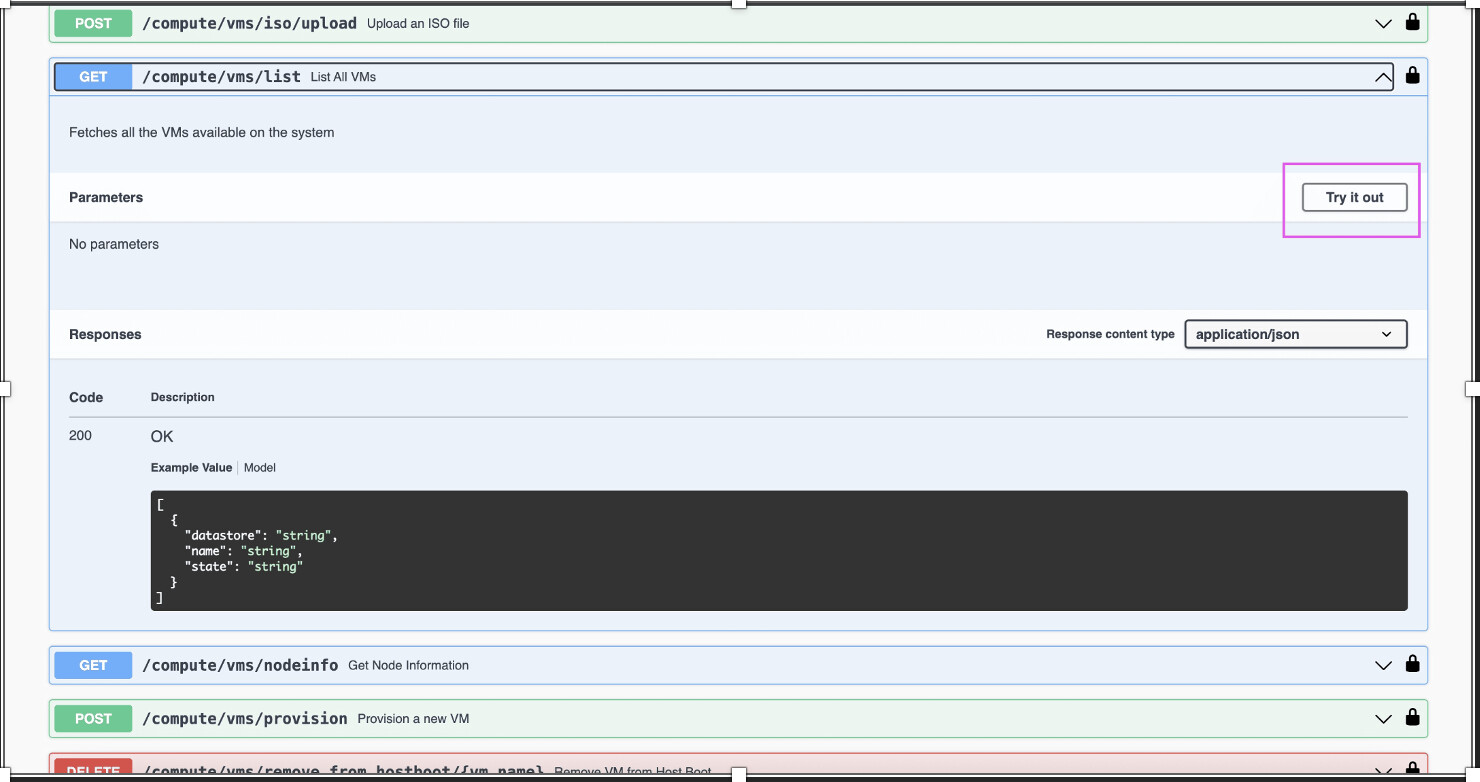
Configure Request Parameters: Fill in required path variables, query parameters, request body
Execute the Request: Click the “Execute” button
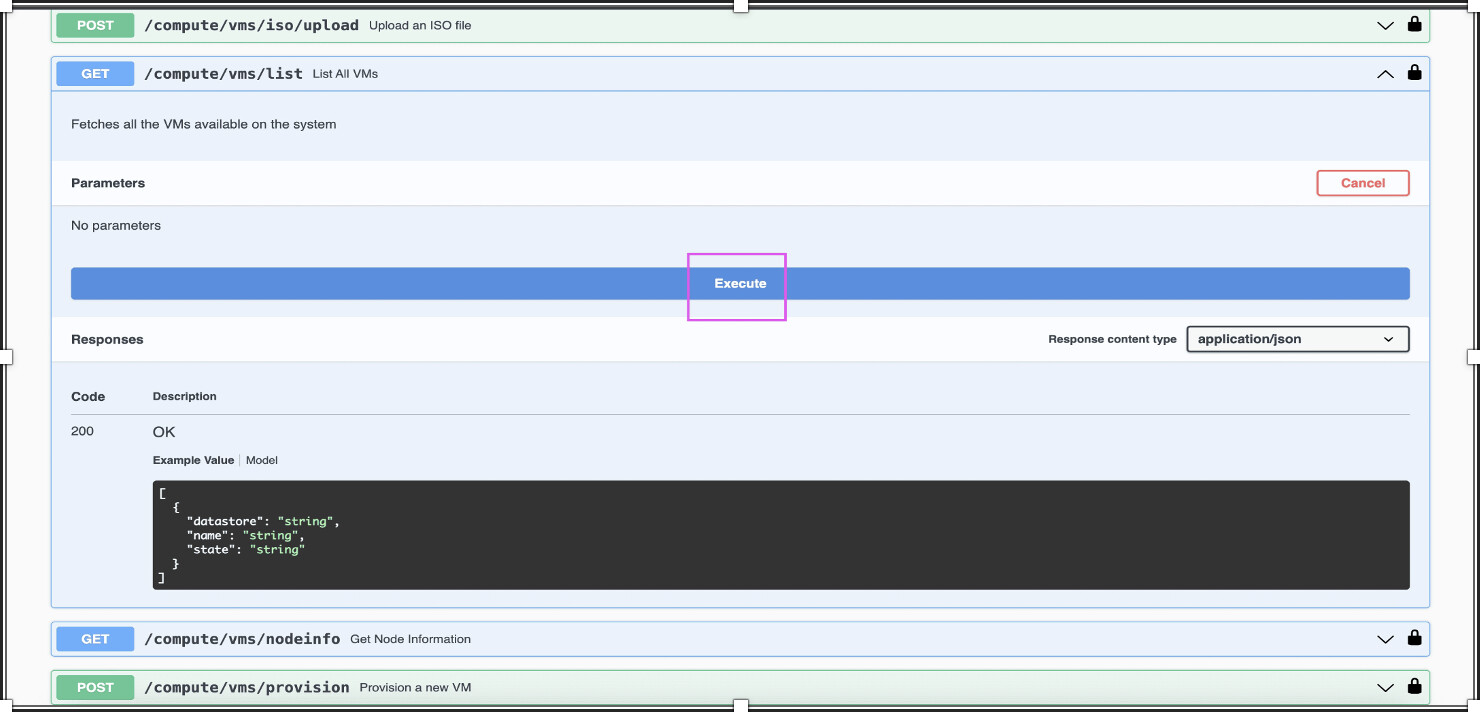
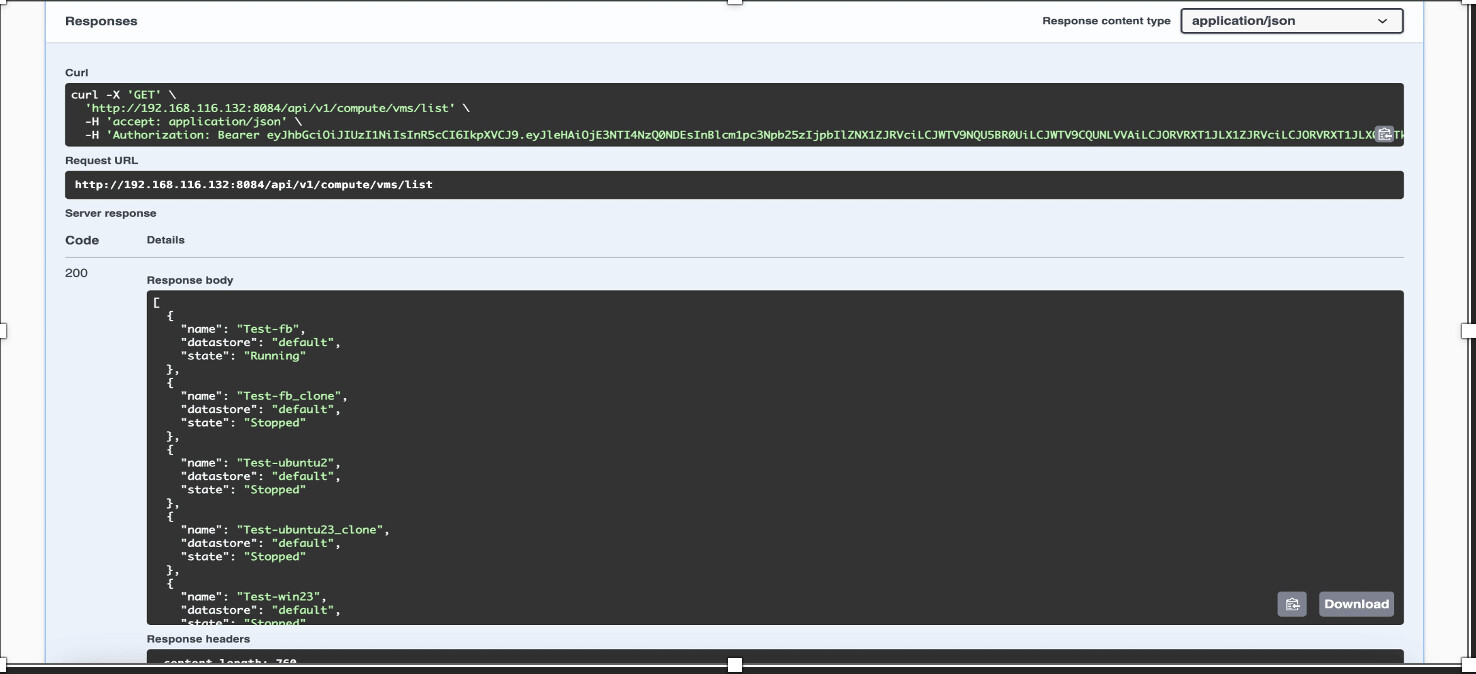
Best Practices
Always use HTTPS for API calls
Keep access tokens confidential
Refresh tokens as needed
Handle authentication errors gracefully
Validate response status codes
Response Information
Response Code: HTTP status code (e.g., 200, 201, 400, 401, 404, 500)
Response Body: JSON response data returned by the server
Response Headers: HTTP headers included in the response
Request URL: The actual URL that was called
Request Duration: Time taken to complete the request
Common Response Codes
200 OK: Request successful
201 Created: Resource created successfully
400 Bad Request: Invalid request format
401 Unauthorized: Authentication required or token expired
403 Forbidden: Insufficient permissions
404 Not Found: Resource not found
500 Internal Server Error: Server error